

XRP price stabilizes after the NFP data as technicals point to a rebound

The XRP price stabilized at a crucial support on Dec. 16 as traders reacted to the latest US jobs numbers and waited for the upcoming Bank of Japan interest rate decision and US inflation report.
- XRP price stabilized after falling to its lowest level since Nov. 22.
- The coin has formed an inverted head-and-shoulders pattern on the daily chart.
- It has also formed a bullish divergence pattern, pointing to a rebound.
Ripple (XRP) token rose by 1.15% to $1.9242, a few points above the key resistance support at $1.8140, its lowest level on Nov. 21. It remains much lower than the year-to-date high of $3.6675.
The XRP token stabilized after the Bureau of Labor Statistics published the latest jobs report. This report showed that the economy created 64,000 jobs in November as the unemployment rate rose to 4.6%, its highest level since 2021. The Black unemployment rate spiked to 8.3% during the month.
These numbers came two days ahead of the upcoming U.S. inflation report, which will come out on Thursday. It also came a week after the Federal Reserve slashed interest rates by 0.25% and pointed to one more in 2026. These numbers, together with those that will come out in January, will help investors predict the next Fed actions.
The other main catalyst for XRP and other tokens will be the upcoming BoJ interest rate decision on Friday. Polymarket data places the odds of a rate hike at 98%, a move that will push the benchmark lending rate to 0.75%, the highest point in decades. A BoJ rate hike is seen as a bearish catalyst for cryptocurrencies.
Meanwhile, the amount of XRP liquidations rose on Tuesday before the token started to stabilize. Data compiled by CoinGlass shows that bullish positions worth $16.6 million were liquidated in the last 24 hours.
XRP price technical analysis
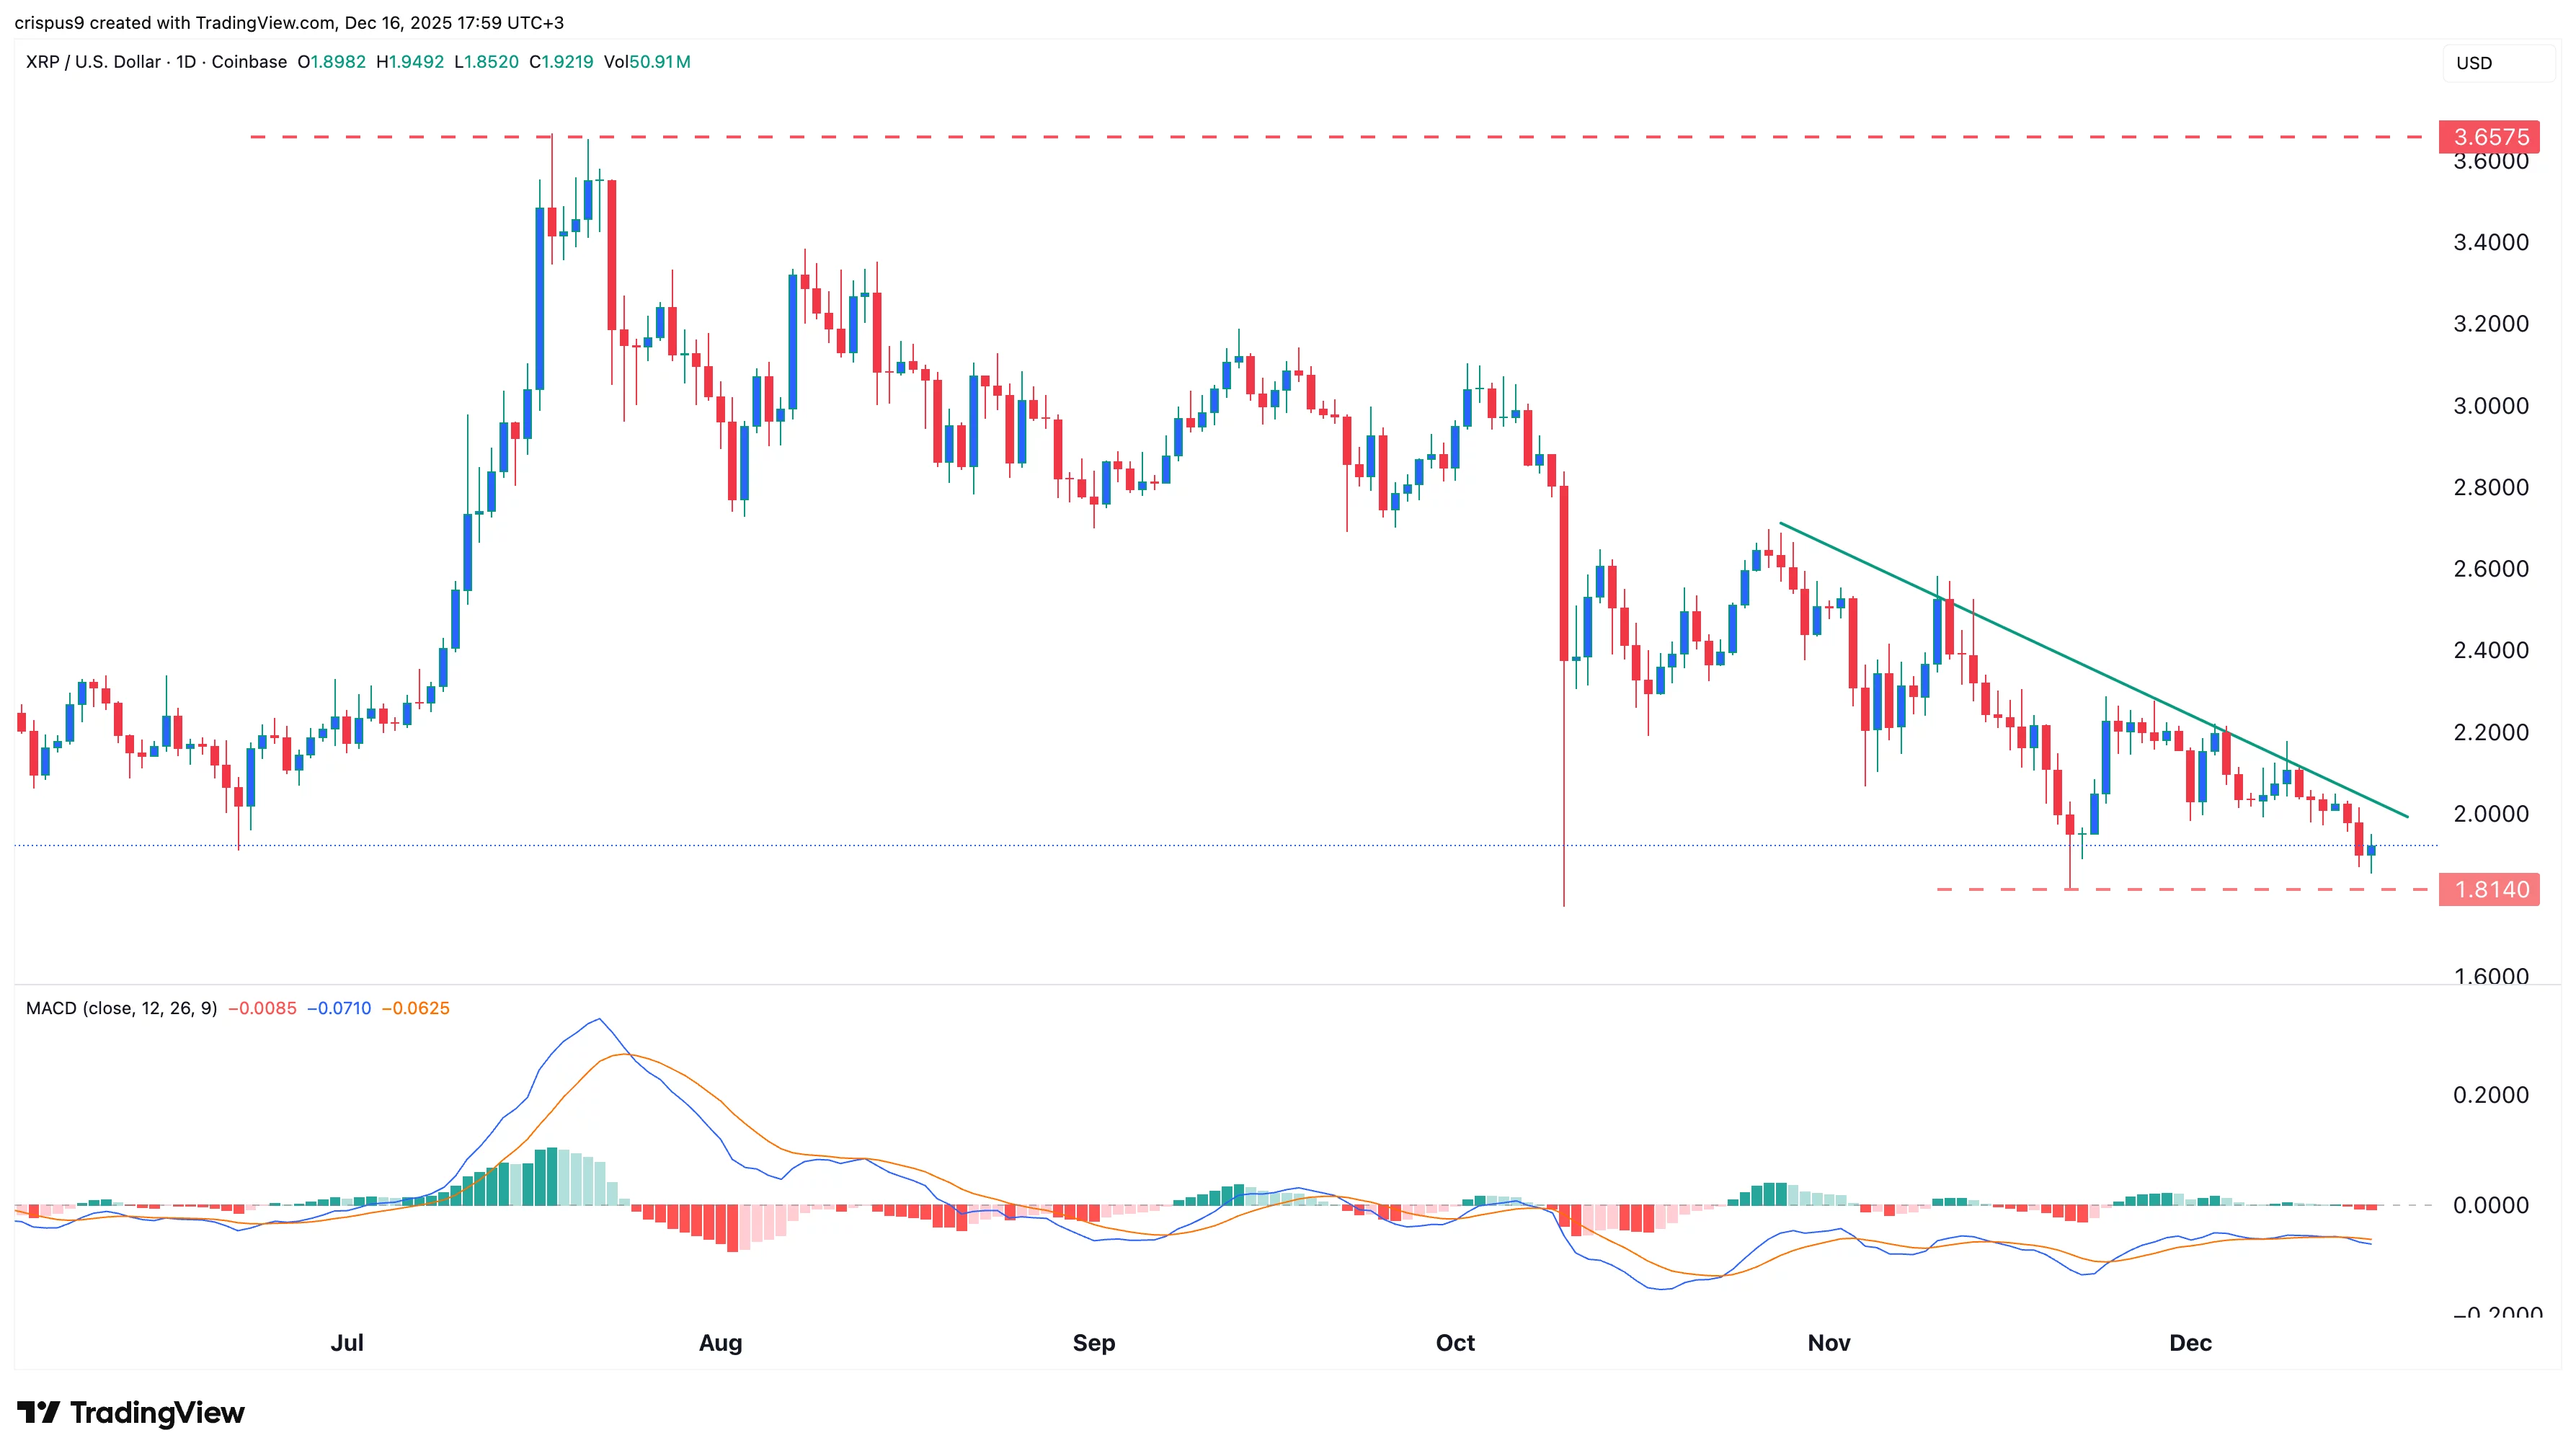
The daily timeframe chart shows that the XRP price has been in a steep sell-off in the past few months. This decline happened because of the ongoing crypto market crash, which affected Bitcoin and most altcoins.
The token has remained below the 50-day and 100-day Exponential Moving Averages and the descending trendline that connects the highest swings since October 28.
It has formed an inverse head-and-shoulders pattern, while the MACD indicator has formed a bullish divergence pattern.
Additionally, the token has found substantial support at $1.81, its lowest level on Nov. 21.
Therefore, the most likely scenario is where the token rebounds in the coming weeks as bulls target the key resistance level at $2.50. This view will be confirmed once it moves above the descending trendline, which is the neckline of the inverted head-and-shoulders pattern.
You May Also Like

Trump Cancels Tech, AI Trade Negotiations With The UK

Wormhole Unleashes W 2.0 Tokenomics for a Connected Blockchain Future
