

Bitcoin Price Regroups After Losses—Is Directional Break Near?
Bitcoin price declined further and traded below the $87,000 support zone. BTC is now consolidating and might struggle to clear the $89,350 zone.
- Bitcoin started a fresh decline below the $87,500 zone.
- The price is trading below $88,000 and the 100 hourly Simple moving average.
- There is a bearish trend line forming with resistance at $88,500 on the hourly chart of the BTC/USD pair (data feed from Kraken).
- The pair might continue to move up if it settles above the $89,350 zone.
Bitcoin Price Consolidates Losses
Bitcoin price struggled to stay above the $89,000 and $88,500 levels. BTC started a fresh decline and traded below the $88,000 support.
The price even spiked below the $86,500 support. However, the bulls were active near the $85,000 zone. A low was formed at $85,151 and the price recently started an upside correction. There was a move above the 23.6% Fib retracement level of the downward move from the $93,560 swing high to the $85,151 low.
The bears are active near $89,000. Bitcoin is now trading below $88,000 and the 100 hourly Simple moving average. If the bulls remain in action, the price could attempt more gains. Immediate resistance is near the $88,000 level. The first key resistance is near the $88,500 level. There is also a bearish trend line forming with resistance at $88,500 on the hourly chart of the BTC/USD pair.
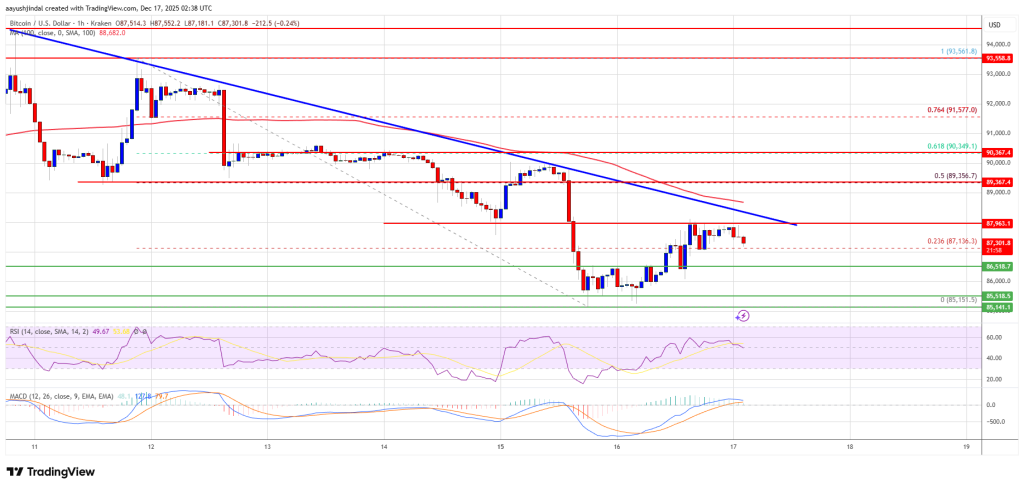
The next resistance could be $89,350 or the 50% Fib retracement level of the downward move from the $93,560 swing high to the $85,151 low. A close above the $89,350 resistance might send the price further higher. In the stated case, the price could rise and test the $90,000 resistance. Any more gains might send the price toward the $91,200 level. The next barrier for the bulls could be $92,000 and $92,500.
Another Drop In BTC?
If Bitcoin fails to rise above the $88,500 resistance zone, it could start another decline. Immediate support is near the $87,000 level. The first major support is near the $86,500 level.
The next support is now near the $85,500 zone. Any more losses might send the price toward the $85,000 support in the near term. The main support sits at $83,500, below which BTC might accelerate lower in the near term.
Technical indicators:
Hourly MACD – The MACD is now losing pace in the bearish zone.
Hourly RSI (Relative Strength Index) – The RSI for BTC/USD is now near the 50 level.
Major Support Levels – $85,500, followed by $85,500.
Major Resistance Levels – $88,500 and $89,350.
You May Also Like
Solana Faces Massive DDoS Attack Without Performance Issues

XRP Price Steady Near $2 Amid Chart Compression and Growing ETF Inflows
