The post SUI User Growth Surges as Price Hits a Key Turning Point — What’s Next? appeared first on Coinpedia Fintech News The Sui platform is seeing a sharp riseThe post SUI User Growth Surges as Price Hits a Key Turning Point — What’s Next? appeared first on Coinpedia Fintech News The Sui platform is seeing a sharp rise

SUI User Growth Surges as Price Hits a Key Turning Point — What’s Next?

2026/03/25 21:22
4 min read
For feedback or concerns regarding this content, please contact us at [email protected]
Why SUI Price is Up Today? 

The post SUI User Growth Surges as Price Hits a Key Turning Point — What’s Next? appeared first on Coinpedia Fintech News

The Sui platform is seeing a sharp rise in user activity, with both daily active users and new accounts spiking in recent weeks. At one point, new users surged close to the 800K mark, highlighting a sudden wave of attention on the network. But the price isn’t reflecting that strength—at least not yet.

In the past few weeks, the SUI price has been consolidating within a tight range. The token is up by just 1.36%, reaching $0.96, while the volume has hit back by 4.7%. This creates a clear divergence. User growth is picking up, but price remains stuck at a critical level. Whether this turns into a breakout or another rejection is what makes the current setup worth watching.

SUI User Growth Spikes, but Sustainability Remains Unclear

SUI’s on-chain data shows a sharp increase in both daily active users and new users, with recent spikes pushing new user inflows close to the 800K mark. Active users have also climbed toward the 250K–300K range, signaling a strong surge in network participation.

sui price

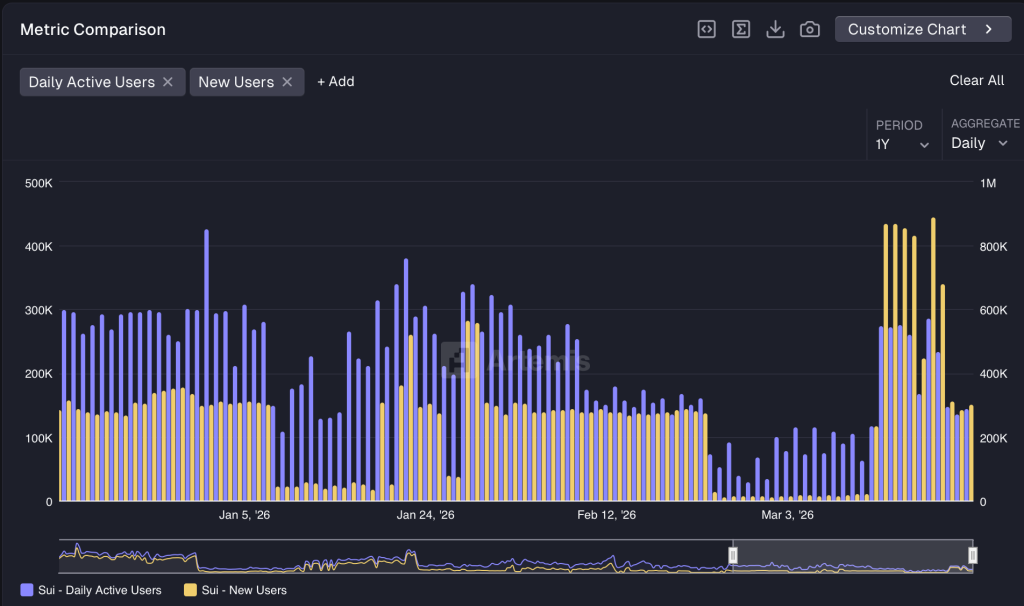
Another key observation is the gap between new users and active users during peak periods. While new user numbers jump significantly, active user retention does not scale at the same pace, indicating that a portion of these users may not be staying engaged with the network.

Overall, SUI is clearly capable of attracting large bursts of attention, but the data points to volatile and uneven growth. For this trend to support a sustained price move, the network will need to show more consistent user retention and stable activity levels rather than isolated spikes.

SUI Price Analysis—Is the Crypto Preparing for a Breakout?

SUI price action still doesn’t confirm the strength seen in its on-chain data. On the weekly chart, the token remains in a broader downtrend, marked by consistent lower highs after its previous rally.

Right now, price is sitting inside a key demand zone between $0.80 and $1.00. This level has held multiple times, which makes it important—but not bullish on its own. The current candles show consolidation rather than a strong reversal, suggesting buyers are active but not in control yet.

sui price

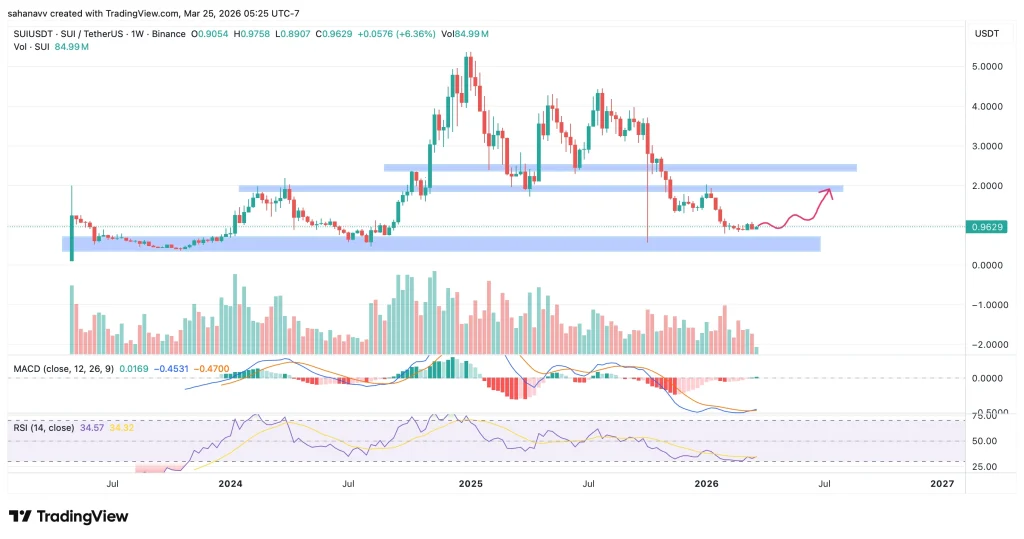
Momentum indicators are starting to shift. The RSI is hovering near oversold levels, while the MACD is flattening after an extended bearish phase. This points to weakening downside pressure, but not a confirmed trend change.

For any meaningful recovery, SUI needs to reclaim higher levels. The first key resistance sits near $1.50, followed by a stronger supply zone between $2.00 and $2.20. A move above these levels would signal a shift in structure. Until then, this remains a wait-and-watch setup. If the $0.80 support breaks, the downtrend could extend further. If it holds and momentum builds, this zone could turn into a base for the next move.

Wrapping it Up–What’s Next for SUI Price?

SUI price is currently sitting at a critical junction where fundamentals and price are telling two different stories. The $0.80–$1.00 range continues to act as a strong base. As long as this level holds, the possibility of a recovery remains intact. However, for any meaningful upside, SUI needs to reclaim the $1.50 level, which would be the first indication that buyers are stepping back in with strength. A move beyond that could open the path toward the $2.00–$2.20 range.
For now, SUI is not in a confirmed uptrend—but it is no longer weak either. The next move will likely depend on whether rising network activity can translate into sustained demand. Until then, this remains a classic wait-for-confirmation setup.

Market Opportunity
SUI Logo
SUI Price(SUI)
--
----
USD
SUI (SUI) Live Price Chart
Disclaimer: The articles reposted on this site are sourced from public platforms and are provided for informational purposes only. They do not necessarily reflect the views of MEXC. All rights remain with the original authors. If you believe any content infringes on third-party rights, please contact [email protected] for removal. MEXC makes no guarantees regarding the accuracy, completeness, or timeliness of the content and is not responsible for any actions taken based on the information provided. The content does not constitute financial, legal, or other professional advice, nor should it be considered a recommendation or endorsement by MEXC.

You May Also Like

Gold continues to hit new highs. How to invest in gold in the crypto market?

Gold continues to hit new highs. How to invest in gold in the crypto market?

As Bitcoin encounters a "value winter", real-world gold is recasting the iron curtain of value on the blockchain.
Share
PANews2025/04/14 17:12
Stellar’s XLM price climbs 7% as traders rotate into payment coins – can it go higher?

Stellar’s XLM price climbs 7% as traders rotate into payment coins – can it go higher?

Stellar’s XLM price jumps toward the top of its range as traders rotate into payment and remittance tokens amid rising volumes, stablecoin pilots, and CBDC tests
Share
Crypto.news2026/03/25 22:07
Ethereum koers toont zeldzaam dubbel koopsignaal en richt zich op $4.550

Ethereum koers toont zeldzaam dubbel koopsignaal en richt zich op $4.550

Connect met Like-minded Crypto Enthusiasts! Connect op Discord! Check onze Discord   Ethereum laat op de uurgrafiek twee opeenvolgende TD Sequential koopsignalen zien. Deze indicator meet uitputting in een trend en geeft vaak een signaal dat de verkoopdruk kan afnemen. Dit dubbele signaal verschijnt rond het niveau van $4.516, waar de ETH prijs kortstondig steun vindt. Dit type formatie komt zelden voor en wordt daarom extra nauwlettend gevolgd. Wat gaat de Ethereum koers hiermee doen? Ethereum koers test steun rond $4.516 De scherpe daling van de Ethereum koers vanaf de prijszone rond $4.800 bracht de ETH prijs in korte tijd naar ongeveer $4.516. Op dit niveau trad duidelijke koopactiviteit op, waardoor de neerwaartse beweging tijdelijk werd gestopt. Het dubbele signaal dat door de TD Sequential indicator is gegenereerd, viel precies samen met dit prijspunt. De TD Sequential is opgebouwd uit negen candles die een trend meetellen. Wanneer de negende candle verschijnt, kan dit duiden op een trendomslag. In dit geval verschenen zelfs twee signalen kort na elkaar, wat aangeeft dat de verkoopdruk mogelijk uitgeput is. Het feit dat dit gebeurde in een zone waar ETH kopers actief bleven, maakt het patroon extra opvallend. TD Sequential just flashed two buy signals for Ethereum $ETH! pic.twitter.com/JPO8EhiEPi — Ali (@ali_charts) September 16, 2025 Welke crypto nu kopen?Lees onze uitgebreide gids en leer welke crypto nu kopen verstandig kan zijn! Welke crypto nu kopen? Fed-voorzitter Jerome Powell heeft aangekondigd dat de rentes binnenkort zomaar eens omlaag zouden kunnen gaan, en tegelijkertijd blijft BlackRock volop crypto kopen, en dus lijkt de markt klaar om te gaan stijgen. Eén vraag komt telkens terug: welke crypto moet je nu kopen? In dit artikel bespreken we de munten die… Continue reading Ethereum koers toont zeldzaam dubbel koopsignaal en richt zich op $4.550 document.addEventListener('DOMContentLoaded', function() { var screenWidth = window.innerWidth; var excerpts = document.querySelectorAll('.lees-ook-description'); excerpts.forEach(function(description) { var excerpt = description.getAttribute('data-description'); var wordLimit = screenWidth wordLimit) { var trimmedDescription = excerpt.split(' ').slice(0, wordLimit).join(' ') + '...'; description.textContent = trimmedDescription; } }); }); Technische indicatoren schetsen herstelkans voor ETH Naast de dubbele koopsignalen verstrekken ook andere indicatoren belangrijke aanwijzingen. Tijdens de daling van de ETH koers waren grote rode candles zichtbaar, maar na de test van $4.516 stabiliseerde de Ethereum koers. Dit wijst op een mogelijke verschuiving in het evenwicht tussen de bears en bulls. Als deze opwaartse beweging doorzet, liggen de eerste weerstanden rond $4.550. Daarboven wacht een sterkere zone rond $4.650. Deze niveaus zijn in eerdere Ethereum sessies al meerdere keren getest. Een doorbraak zou ruimte openen richting de all-time high van ETH rond $4.953. Wanneer de prijs toch opnieuw onder $4.516 zakt, liggen er zones rond $4.500 en $4.450 waar grotere kooporders worden verwacht. Deze niveaus kunnen als een vangnet fungeren, mocht de druk opnieuw toenemen. Marktdynamiek bevestigt technische indicatoren De huidige situatie volgt op een bredere correctie in de cryptomarkt. Verschillende vooraanstaande crypto tokens zagen scherpe koersdalingen, waarna traders op zoek gingen naar signalen voor een mogelijke ommekeer. Dat juist Ethereum nu een dubbel TD Sequential signaal toont, versterkt de interesse in dit scenario. Fundamenteel blijft Ethereum sterk. Het aantal ETH tokens dat via staking is vastgezet, blijft groeien. Dat verkleint de vrije circulatie en vermindert verkoopdruk. Tegelijk blijft het netwerk intensief gebruikt voor DeFi, NFT’s en stablecoins. Deze activiteiten zorgen voor een stabiele vraag naar ETH, ook wanneer de prijs tijdelijk onder druk staat. Fundamentele drijfveren achter de Ethereum koers De Ethereum koers wordt echter niet alleen bepaald door candles en patronen, maar ook door bredere factoren. Een stijgend percentage van de totale ETH supply staat vast in staking contracten. Hierdoor neemt de liquiditeit op exchanges af. Dit kan prijsschommelingen versterken wanneer er plotseling meer koopdruk ontstaat. Daarnaast is Ethereum nog steeds het grootste smart contract platform. Nieuwe standaarden zoals ERC-8004 en ontwikkelingen rond layer-2 oplossingen houden de activiteit hoog. Deze technologische vooruitgang kan de waardepropositie ondersteunen en zo indirect bijdragen aan een ETH prijsherstel. Het belang van de korte termijn dynamiek De komende handelsdagen zullen duidelijk maken of de bulls genoeg kracht hebben om door de weerstandszone rond $4.550 te breken. Voor de bears ligt de focus juist op het verdedigen van de prijsregio rond $4.516. De whales, die met grote handelsorders opereren, kunnen hierin een beslissende rol spelen. Het dubbele TD Sequential signaal blijft hoe dan ook een zeldzame gebeurtenis. Voor cryptoanalisten vormt het een objectief aanknopingspunt om de kracht van de huidige Ethereum trend te toetsen. Vooruitblik op de ETH koers Ethereum liet twee opeenvolgende TD Sequential signalen zien op de uurgrafiek, iets wat zelden voorkomt. Deze formatie viel samen met steun rond $4.516, waar de bulls actief werden. Als de Ethereum koers boven dit niveau blijft, kan er ruimte ontstaan richting $4.550 en mogelijk $4.650. Zakt de prijs toch opnieuw onder $4.516, dan komen $4.500 en $4.450 in beeld als nieuwe steunzones. De combinatie van zeldzame indicatoren en een sterke fundamentele basis maakt Ethereum interessant voor zowel technische als fundamentele analyses. Of de bulls het momentum echt kunnen overnemen, zal blijken zodra de Ethereum koers de eerstvolgende weerstanden opnieuw test. Koop je crypto via Best Wallet Best wallet is een topklasse crypto wallet waarmee je anoniem crypto kan kopen. Met meer dan 60 chains gesupport kan je al je main crypto coins aanschaffen via Best Wallet. Best wallet - betrouwbare en anonieme wallet Best wallet - betrouwbare en anonieme wallet Meer dan 60 chains beschikbaar voor alle crypto Vroege toegang tot nieuwe projecten Hoge staking belongingen Lage transactiekosten Best wallet review Koop nu via Best Wallet Let op: cryptocurrency is een zeer volatiele en ongereguleerde investering. Doe je eigen onderzoek. Het bericht Ethereum koers toont zeldzaam dubbel koopsignaal en richt zich op $4.550 is geschreven door Dirk van Haaster en verscheen als eerst op Bitcoinmagazine.nl.
Share
Coinstats2025/09/17 23:31