

Bitcoin Eyes $70K, Oil Prices Dump as Trump Claims the War Is Almost Over
After a day of more fluctuations prompted by the quickly developing situation in the Middle East, bitcoin’s price aimed at $70,000 minutes ago as Trump addressed the war and the Strait of Hormuz.
His words sent shockwaves through other financial fields as well, especially with oil, as the CFDs on WTI Crude Oil plunged to under $90 per barrel after skyrocketing to $120 earlier today.
The POTUS’s indication that the war is pretty much completed comes in a rather intriguing time, as Iran just chose a new Supreme Leader – Mojtaba Khamenei, who is the son of the former. Trump repeatedly outlined that he is not happy with the choice, calling it a big mistake.
At the same time, reports continue to emerge that several countries in the region, including the UAE and Turkey, keep intercepting more drones and missiles from Iran.
While also addressing the situation in the Middle East, President Trump reportedly added that the US is mulling taking over the Strait of Hormuz, which has been essentially closed for days, thus reducing the amount of transported goods, mostly oil.
As mentioned above, oil prices dumped again following Trump’s latest remarks after reaching a multi-year peak this morning. Gold and the S&P 500 went on a run, with the former tapping $5,140/oz, while the latter climbed above 6,800.
Bitcoin quickly jumped from $68,000 to $69,600 (on Bitstamp) but was stopped there and now trades around $69,000 again. Ethereum has jumped past $2,000, while SOL is above $85.
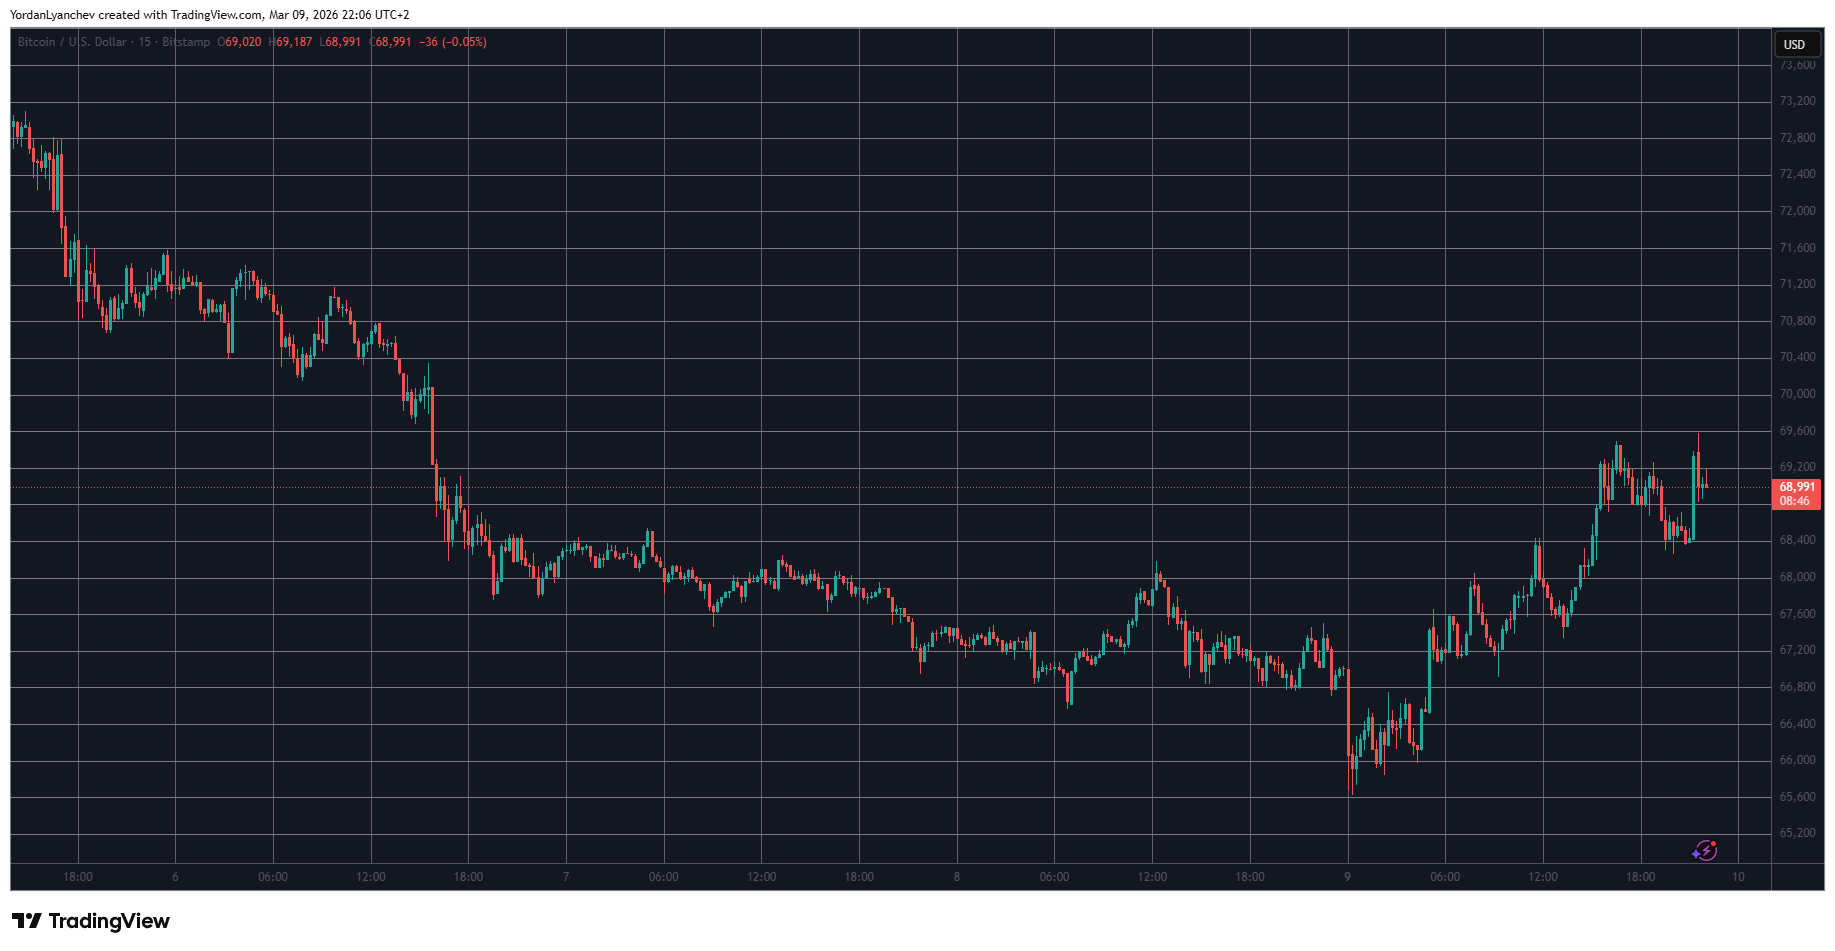 BTCUSD Mar 9. Source: TradingView
The post Bitcoin Eyes $70K, Oil Prices Dump as Trump Claims the War Is Almost Over appeared first on CryptoPotato.
You May Also Like

Husky Inu (HINU) Completes Move To $0.00020688

Cryptos Signal Divergence Ahead of Fed Rate Decision
