The post Bitcoin Price Eyes Upside as Buy Volume Surges and Binance USDT Reserves Hit $4.77B appeared first on Coinpedia Fintech News The Bitcoin price just clawedThe post Bitcoin Price Eyes Upside as Buy Volume Surges and Binance USDT Reserves Hit $4.77B appeared first on Coinpedia Fintech News The Bitcoin price just clawed

Bitcoin Price Eyes Upside as Buy Volume Surges and Binance USDT Reserves Hit $4.77B

2026/03/10 22:20
3 min read
For feedback or concerns regarding this content, please contact us at [email protected]
AI Models Favor Bitcoin Over Fiat in New Study

The post Bitcoin Price Eyes Upside as Buy Volume Surges and Binance USDT Reserves Hit $4.77B appeared first on Coinpedia Fintech News

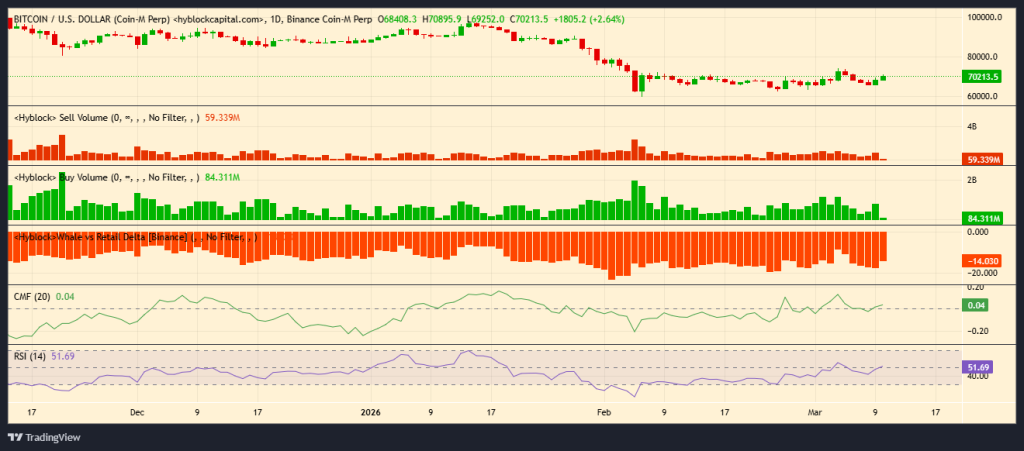
The Bitcoin price just clawed its way back above $70,000 and suddenly the market mood looks a little less gloomy. Not euphoric. Not yet. But the data flashing across trading dashboards suggests something interesting is brewing beneath the surface.

On the daily chart, buy pressure has quietly started to dominate. Buy volume currently sits around 84 million, comfortably ahead of sell volume near 59 million. That imbalance may not look dramatic at first glance, but in crypto markets it often hints that buyers are slowly regaining control after a period of weakness. And when momentum begins shifting like that, things can move fast.

Bitcoin Price Reclaims Key Momentum

Technically speaking, the rebound matters. The Bitcoin price chart shows the asset bouncing from recent lows and stabilizing above the psychologically important $70,000 level. Momentum indicators aren’t screaming “overheated” either.

The CMF currently reads 0.04, signaling that capital is flowing into the asset rather than draining out. Positive CMF readings generally indicate accumulation, suggesting traders are quietly building positions instead of exiting the market.

Then there’s the RSI. At 51.69, the indicator sits comfortably in neutral territory far from overbought conditions. In other words, there’s still room for price movement before the market starts flashing warning signs.

For anyone watching BTC/USD, that combination along with rising buy volume, positive capital flow, and neutral RSI this often points to potential continuation rather than exhaustion.

Bitcoin Price Eyes Upside as Buy Volume Surges and Binance USDT Reserves Hit $4.77B

Stablecoin Liquidity Begins Building

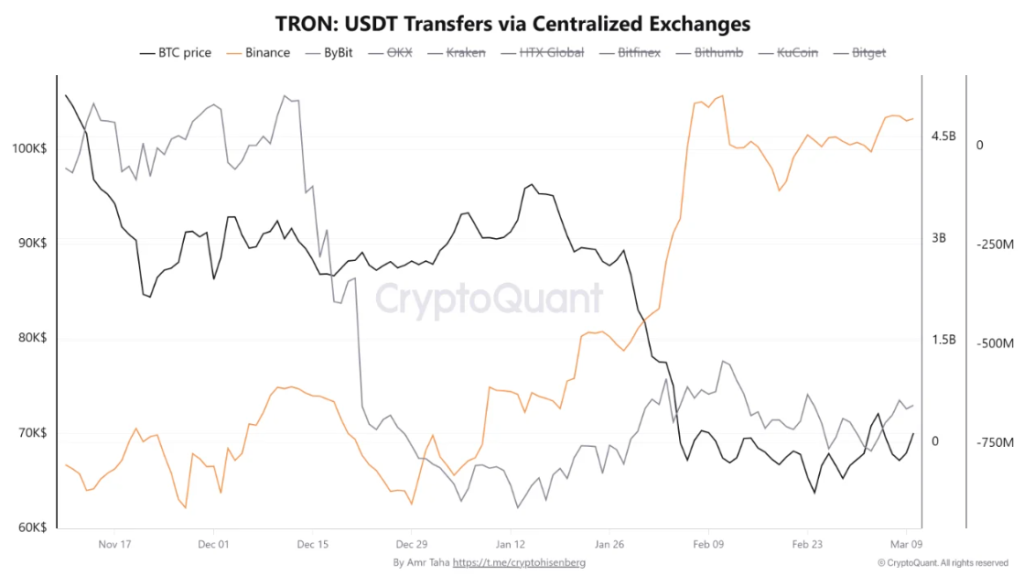
Moreover, Data tracking stablecoin movements on the TRON network reveals a noticeable rise in USDT transfers across centralized exchanges, with a particularly sharp increase in reserves on Binance.

As of March 10, Binance’s USDT reserves climbed to approximately $4.77 billion. This marks the second major spike since February 8, 2026, when reserves briefly reached around $4.9 billion.

In crypto market terms, stablecoin reserves are often described as “dry powder.” When traders move large amounts of stablecoins onto exchanges, it typically means capital is preparing to enter the market.

Bitcoin Price Eyes Upside as Buy Volume Surges and Binance USDT Reserves Hit $4.77B

Whales Move While Retail Hesitates

Meanwhile, another indicator offers a curious twist. The Whale vs Retail Delta on Binance remains negative, suggesting retail activity is still lagging behind larger participants. Yet the data also shows an increasing frequency of high-value whale transactions, hinting that bigger players are actively positioning themselves.

That dynamic shows whales accumulating while retail stays cautious this has historically preceded periods of heightened volatility. Combine that with rising stablecoin liquidity and improving technical indicators, and the market suddenly looks… primed.

For analysts building Bitcoin price prediction models, the situation is simple: liquidity is building, buyers are stepping in, and momentum indicators remain neutral. Which means the next move in the Bitcoin price could show momentum.

Market Opportunity
4 Logo
4 Price(4)
$0.007888
$0.007888$0.007888
-2.02%
USD
4 (4) Live Price Chart
Disclaimer: The articles reposted on this site are sourced from public platforms and are provided for informational purposes only. They do not necessarily reflect the views of MEXC. All rights remain with the original authors. If you believe any content infringes on third-party rights, please contact [email protected] for removal. MEXC makes no guarantees regarding the accuracy, completeness, or timeliness of the content and is not responsible for any actions taken based on the information provided. The content does not constitute financial, legal, or other professional advice, nor should it be considered a recommendation or endorsement by MEXC.

You May Also Like

Husky Inu (HINU) Completes Move To $0.00020688

Husky Inu (HINU) Completes Move To $0.00020688

Husky Inu (HINU) has completed its latest price jump, rising from $0.00020628 to $0.00020688. The price jump is part of the project’s pre-launch phase, which began on April 1, 2025.
Share
Cryptodaily2025/09/18 01:10
Cryptos Signal Divergence Ahead of Fed Rate Decision

Cryptos Signal Divergence Ahead of Fed Rate Decision

The post Cryptos Signal Divergence Ahead of Fed Rate Decision appeared on BitcoinEthereumNews.com. Crypto assets send conflicting signals ahead of the Federal Reserve’s September rate decision. On-chain data reveals a clear decrease in Bitcoin and Ethereum flowing into centralized exchanges, but a sharp increase in altcoin inflows. The findings come from a Tuesday report by CryptoQuant, an on-chain data platform. The firm’s data shows a stark divergence in coin volume, which has been observed in movements onto centralized exchanges over the past few weeks. Bitcoin and Ethereum Inflows Drop to Multi-Month Lows Sponsored Sponsored Bitcoin has seen a dramatic drop in exchange inflows, with the 7-day moving average plummeting to 25,000 BTC, its lowest level in over a year. The average deposit per transaction has fallen to 0.57 BTC as of September. This suggests that smaller retail investors, rather than large-scale whales, are responsible for the recent cash-outs. Ethereum is showing a similar trend, with its daily exchange inflows decreasing to a two-month low. CryptoQuant reported that the 7-day moving average for ETH deposits on exchanges is around 783,000 ETH, the lowest in two months. Other Altcoins See Renewed Selling Pressure In contrast, other altcoin deposit activity on exchanges has surged. The number of altcoin deposit transactions on centralized exchanges was quite steady in May and June of this year, maintaining a 7-day moving average of about 20,000 to 30,000. Recently, however, that figure has jumped to 55,000 transactions. Altcoins: Exchange Inflow Transaction Count. Source: CryptoQuant CryptoQuant projects that altcoins, given their increased inflow activity, could face relatively higher selling pressure compared to BTC and ETH. Meanwhile, the balance of stablecoins on exchanges—a key indicator of potential buying pressure—has increased significantly. The report notes that the exchange USDT balance, around $273 million in April, grew to $379 million by August 31, marking a new yearly high. CryptoQuant interprets this surge as a reflection of…
Share
BitcoinEthereumNews2025/09/18 01:01
Nasdaq Elliott Wave: End of correction?

Nasdaq Elliott Wave: End of correction?

The post Nasdaq Elliott Wave: End of correction? appeared on BitcoinEthereumNews.com. Executive summary Trend bias: Wave ii rally. Key support level: 24,629 – 24
Share
BitcoinEthereumNews2026/03/11 07:31