

Solana (SOL) Sees $1B ETF Inflows as Technical Setup Signals Potential Rally to $120
Key Takeaways
- SOL is currently valued at $85.95, maintaining position above its 20-day EMA at $85.31, while facing resistance at the 50-day EMA of $87.08 that has capped gains since March.
- The asset has successfully cleared a prolonged descending trendline on daily timeframes and is currently testing this breakout level, which could validate a shift in market structure.
- Weekly chart analysis identifies $120–$125 as the subsequent significant resistance zone should SOL overcome its present short-term bearish pattern.
- Real-world asset (RWA) holdings on Solana expanded from $170M to $2B over a 12-month period, accompanied by 80–100M active wallets and $17B in stablecoin liquidity.
- Cumulative inflows into SOL spot ETFs have surpassed the $1B threshold for the first time, with aggregate net assets reaching $887.92M.
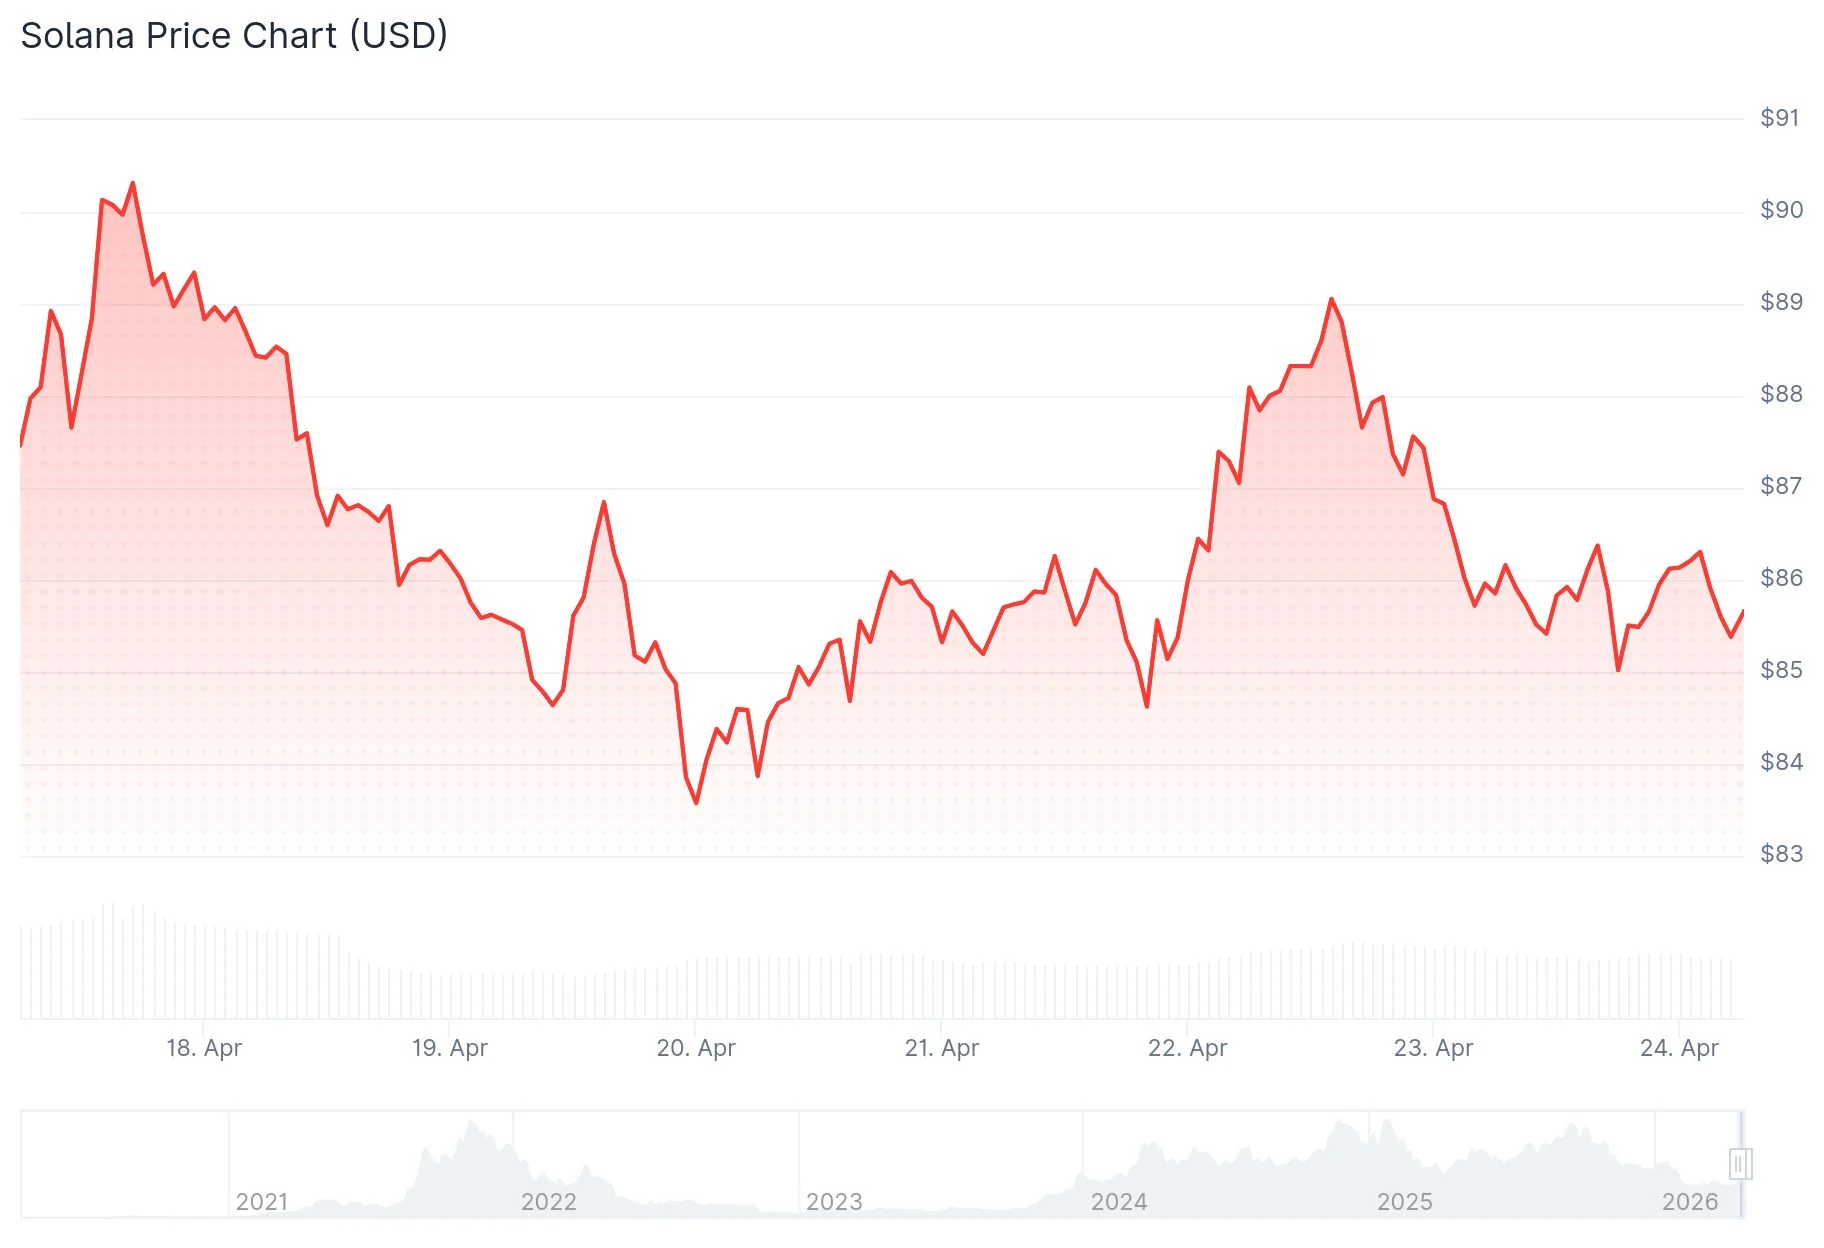
As of April 23, Solana is changing hands at $85.95, representing a 1.10% decline over the past 24 hours. The cryptocurrency has maintained its position above the 20-day exponential moving average at $85.31, a level that has provided support throughout the recent week.
 Solana (SOL) Price
The 50-day EMA positioned at $87.08 continues to serve as the primary resistance barrier. Since March began, each daily closing price has failed to sustain above this critical threshold. The upper boundary of the Bollinger Band is currently located at $89.43, while the 100-day EMA extends further at $96.63.
Regarding downside risk, a daily candle close beneath the 20-day EMA would activate the middle Bollinger Band at $84.63 as the next support target. Additional support levels include the lower Bollinger Band at $79.84 and the February bottom near $67.
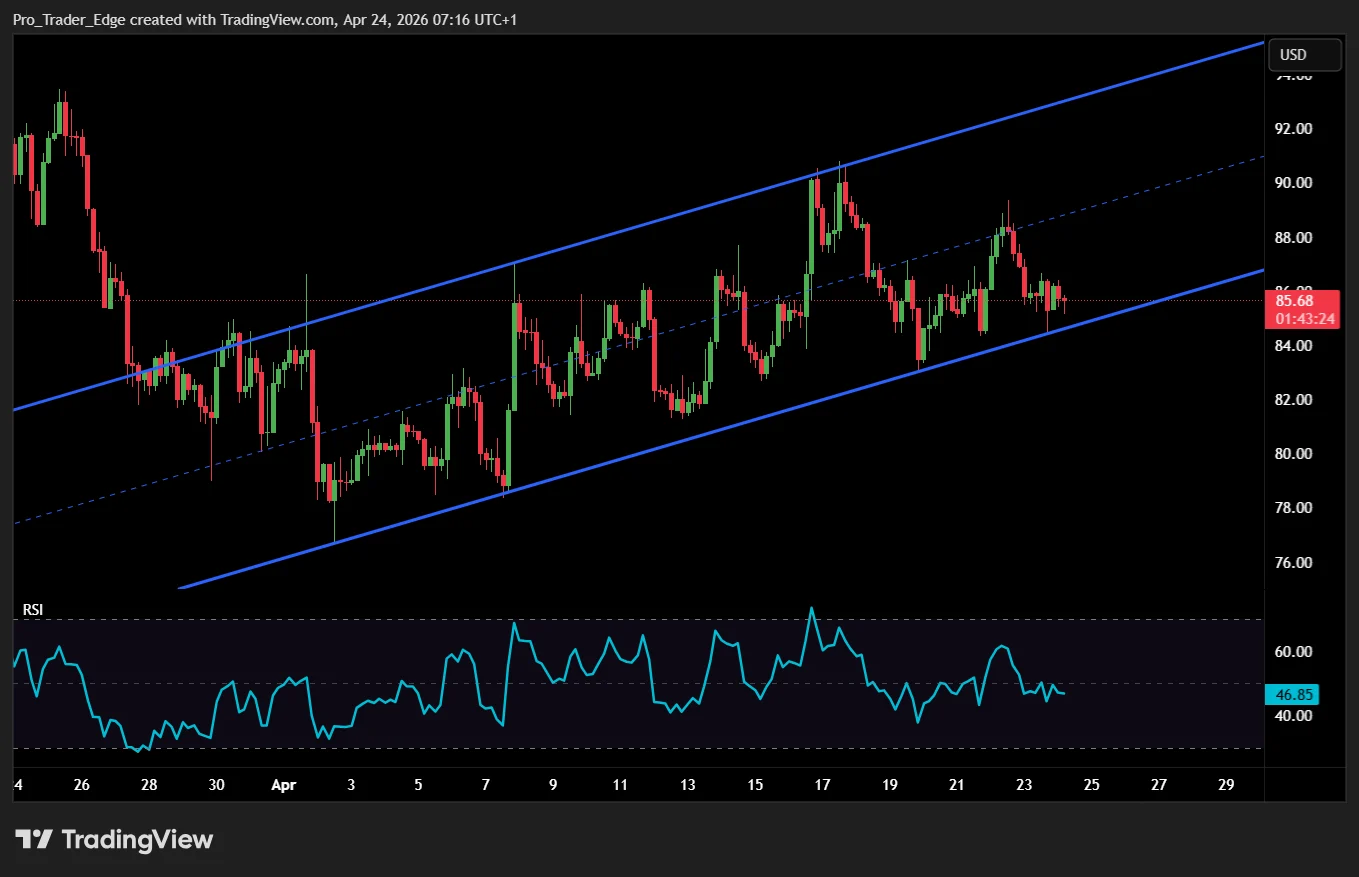
Examining the daily timeframe, SOL has successfully breached a descending trendline that restricted price action throughout late 2025 into early 2026. Technical analysis shared by CryptoCurb on X illustrates this breakout occurring after multiple rejection attempts, including during the Binance flash crash event and Iran conflict escalation phases.
[[LINK_START_0]]https://twitter.com/CryptoCurb/status/2046978584418611353?s=20[[LINK_END_0]]The current price action remains positioned near this breakout zone without falling back beneath the former resistance. This represents a notable change in market structure. However, this technical formation only gains validity if buyers successfully defend this region and the breached trendline transitions into a support level.
Institutional Capital Accelerates
According to Solana ecosystem executive Nick Ducoff, RWA assets deployed on the network expanded from $170M to $2B within a single 12-month period — approximately a 1,100% increase. Institutional participants have highlighted three primary drivers: network stability and uptime, 80 to 100 million active wallets providing distribution channels, and $17B worth of stablecoins already operating on the blockchain.
[[LINK_START_1]]https://twitter.com/solana/status/2046908400056082596?s=20[[LINK_END_1]]Cumulative inflows into SOL spot ETF products have exceeded $1B for the first time in history. Total net assets currently measure $887.92M, representing 1.77% of Solana’s overall market capitalization. ETF products recorded weekly inflows of $35.17M during the most recent period. While April 22 showed zero daily inflow activity, the preceding three trading days collectively generated $31.32M in new capital.
Weekly Timeframe Suggests $120–$125 Objective
Analysis of the weekly chart from Rendoshi AI on X reveals SOL challenging a falling trendline after successfully maintaining support within the $75–$80 range. The Relative Strength Index has rebounded from near oversold territory, indicating improving momentum characteristics, though this alone doesn’t constitute breakout confirmation.
 Source: TradingView
Should SOL successfully break and maintain position above the weekly downtrend line, the subsequent major resistance zone extends from $120 to $125. A rejection at current levels would likely result in continued range-bound trading above the $75–$80 support area without establishing a definitive recovery trajectory.
On the 2-hour timeframe, Solana is operating within an ascending channel pattern that originated from the April 2 low near $78. The RSI indicator displays a fresh bullish signal at the recent low around $83 — mirroring the same pattern that preceded previous upward movements. The MACD indicator remains in negative territory at -0.25, suggesting momentum has not yet validated the signal.
The lower boundary of the 2-hour channel at $83–$84 coincides with the daily 20-day EMA, establishing this zone as the most critical support region to monitor heading into April 24.
The post Solana (SOL) Sees $1B ETF Inflows as Technical Setup Signals Potential Rally to $120 appeared first on Blockonomi.


You May Also Like

X Layer and Ethereum Foundation’s dAI Team Partner to Architect the Future of the Agentic Economy

Hyperliquid Volume Hits Binance-Comparable Levels In Less Than a Year


