

Is Ethereum Entering a Distribution Phase? Key On-Chain and Price Signals to Watch

The post Is Ethereum Entering a Distribution Phase? Key On-Chain and Price Signals to Watch appeared first on Coinpedia Fintech News
The crypto market bears have strengthened since the start of the month as the top tokens, Bitcoin and Ethereum, have attracted significant selling pressure. While BTC price is feared to drop below $60,000, ETH is showing mixed but increasingly cautionary signals. Now that the Ethereum price is about to test one of the crucial support levels at $2000, the question arises whether the distribution phase is about to begin.
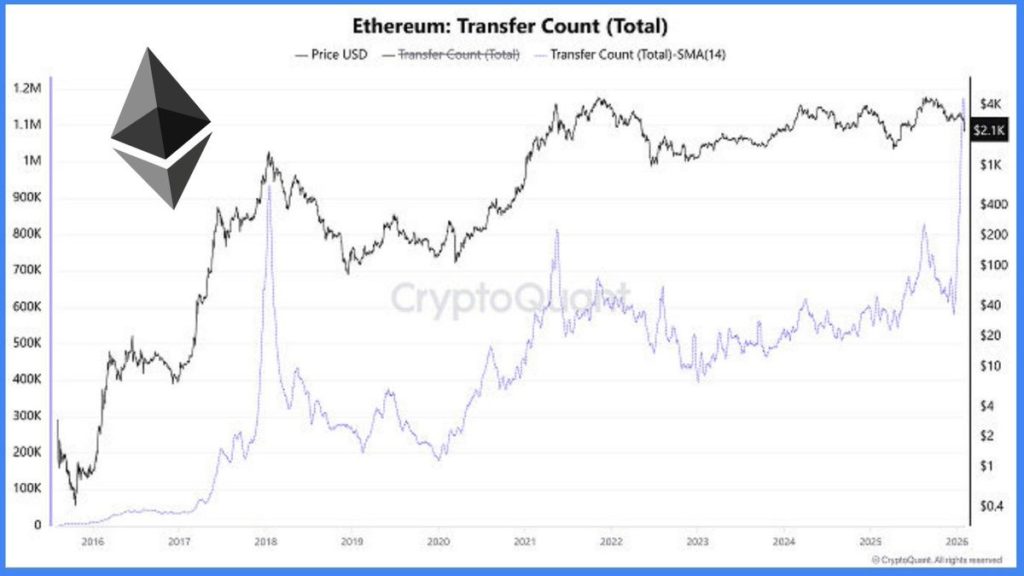
Ethereum Transfer Activity Hits 1.17 Million
On-chain data shows Ethereum transfer count has surged to 1.17 million, a level historically associated with late-cycle market behavior. Similar spikes were last seen near market tops in 2018 and 2021, periods that preceded sharp volatility and prolonged consolidations.
 Source: X
While high network activity is often interpreted as bullish, history shows that activity peaks without sustained price expansion can signal distribution. In such phases, large holders continue transacting, but price struggles to trend higher as supply gradually outweighs demand.
Notably, Ethereum’s price has failed to establish a strong upside continuation despite rising transfers, reinforcing the view that network usage is no longer translating into directional price strength.
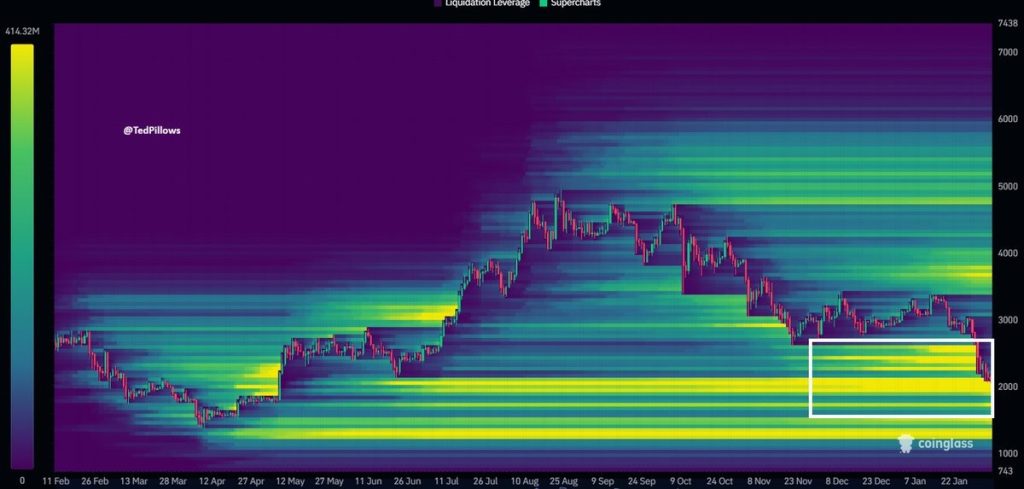
ETH Price Drifts Toward a High-Liquidity Zone
At the same time, derivatives data highlights a dense liquidity cluster between $1,800 and $2,000, where a large concentration of leveraged positions sits. Liquidation heatmaps show this zone acting as a magnet for price, particularly during periods of weakening momentum.
 Source: X
As ETH moves closer to this range, downside liquidity becomes increasingly attractive from a market-structure perspective. In distribution environments, price often drifts toward areas with maximum liquidation potential, rather than breaking higher resistance levels. This setup suggests that short-term price action may remain reactive and volatility-driven, with sharp moves possible as leverage is flushed out.
What Traders Should Watch Next
Both charts combined indicate active participation with potential supply rotation with the probability of downside tests. The second-largest token now appears to be more vulnerable to liquidity-driven moves due to a lack of strong upside follow-through. These points hint towards a distribution phase where markets transition from momentum-driven to balance-seeking behaviour.
Overall, the Ethereum (ETH) price is not showing signs of panic or breakdown, but the data suggests the risk remains skewed to the downside in the near term.
You May Also Like

Woman shot 5 times by DHS to stare down Trump at State of the Union address

WLFI Drops 20% Weekly as Price Tests the Crucial $0.113 Support
