DeFi is still largely dominated by Ethereum and its EVM ecosystem.DeFi is still largely dominated by Ethereum and its EVM ecosystem.

A panoramic interpretation of the current status of DeFi development: Aave and Lido become the highest TVL protocols, and Solana ranks second among the public chains

2025/05/02 09:42
8 min read

Author: A Fox in Web3 , Crypto KOL

Compiled by: Felix, PANews (This article has been edited)

Decentralized Finance (DeFi), often compared to traditional finance (TradFi), has become a large and exponentially growing sector in Web3. The goal of DeFi is highly consistent with the phrase often heard in the crypto space: “banking the unbanked.”

The promise of providing global financial services without banks is a lofty goal, and much of the appeal of Web3 stems from this. This article aims to review the development of DeF over the past year from a current perspective.

Overview

A panoramic interpretation of the current status of DeFi development: Aave and Lido become the highest TVL protocols, and Solana ranks second among the public chains

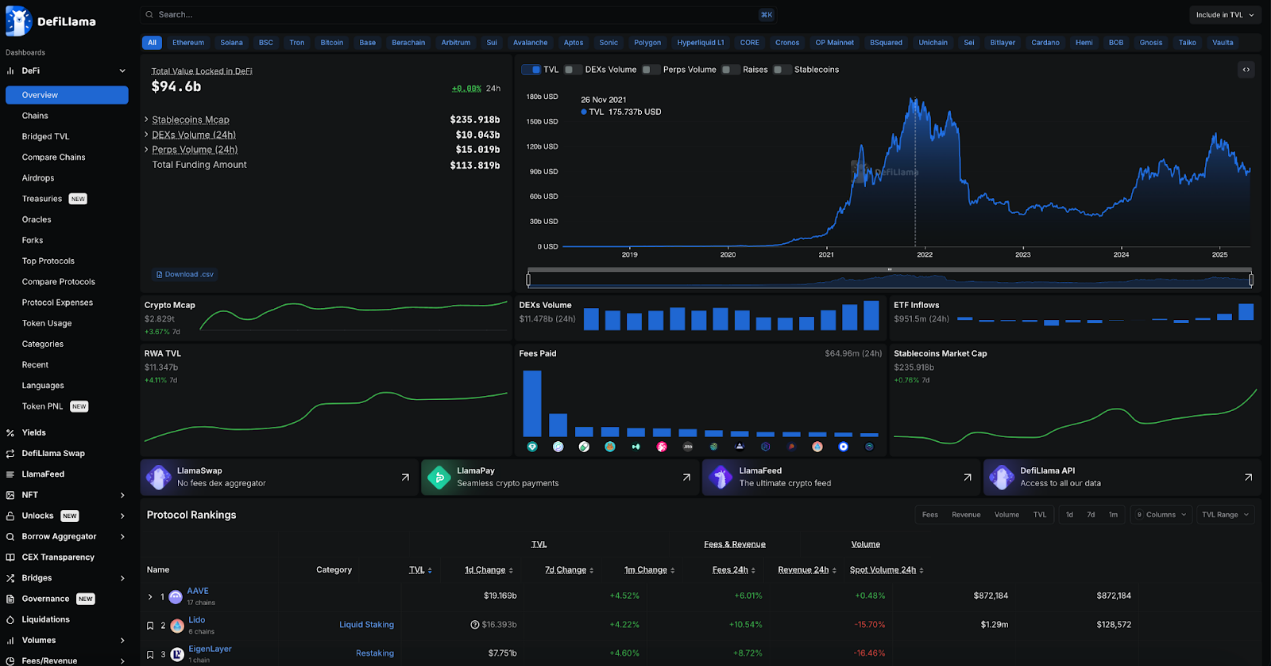
Total Value Locked (TVL) at $94.6B: The amount of money locked up across all DeFi protocols is huge. But considering that the market cap of the entire crypto space is currently around $2.8T, it still only accounts for around 3.3%, so there is a lot of room for growth. TVL has grown by about 1.5 times since last year to around $65.4B, but as a percentage of the crypto space, it has remained fairly stable, as it previously accounted for 3.5%.

DeFiLlama's chart starts in June 2018, less than 7 years ago, which fully shows that DeFi is still in its infancy. However, in November 2021, DeFi TVL reached a historical peak of US$176 billion. Expect TVL to reach this peak again.

Aave and Lido TVL reached $35.6 billion: Currently, more than 37% of DeFi TVL is ETH staked in Aave and Lido. This shows that both Aave and Lido are dominant. Last year Lido was in the lead, but then Aave took the lead. In addition, most DeFi happens on Ethereum, which is still the most important blockchain.

Stablecoins have a market cap of $236 billion: Stablecoins account for more than 8.3% of the $2.8 trillion crypto market, more than double that of DeFi. Stablecoins continue to outpace DeFi TVL, indicating that they have truly achieved product-market fit.

There is so much data in DeFiLlama that it can be overwhelming. Let’s take a closer look at some of the categories and analyze the key points.

Head blockchain

A panoramic interpretation of the current status of DeFi development: Aave and Lido become the highest TVL protocols, and Solana ranks second among the public chains

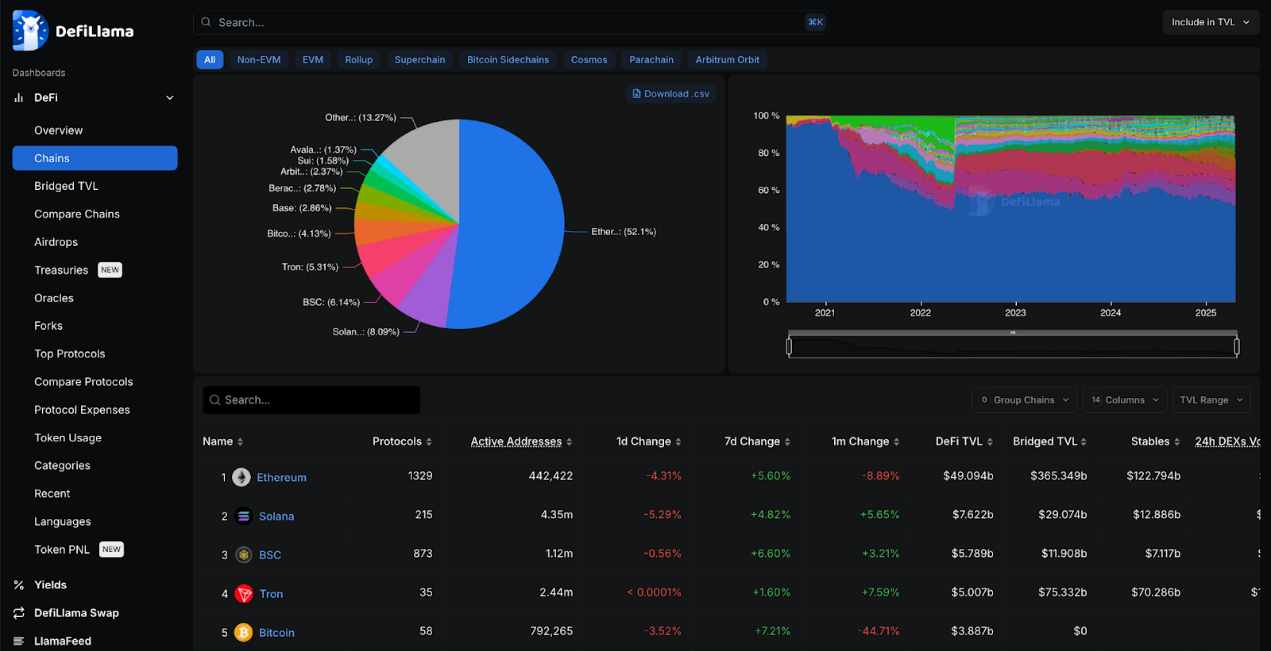
Ethereum is still the most dominant player in DeFi, accounting for 52% of TVL, but this is down from 58.3% last year. Solana is the second largest competitor with 8% TVL, but it is still more than 6 times smaller than Ethereum.

Solana and BSC replaced Tron as the second and third largest public chains respectively, pushing Tron from second to fourth place. The number of active addresses of these three far exceeds that of Ethereum, with Solana having over 4.3 million addresses, while Ethereum has only 442,000.

Ethereum has the most DeFi protocols, with more than 1,320 currently, up from more than 960 last year.

The Bitcoin network has 58 documented DeFi protocols, up from 12 last year. Considering Bitcoin was not designed for smart contracts, it still accounts for more than 4% of all DeFi TVL, about $3.8 billion.

Header Protocol

A panoramic interpretation of the current status of DeFi development: Aave and Lido become the highest TVL protocols, and Solana ranks second among the public chains

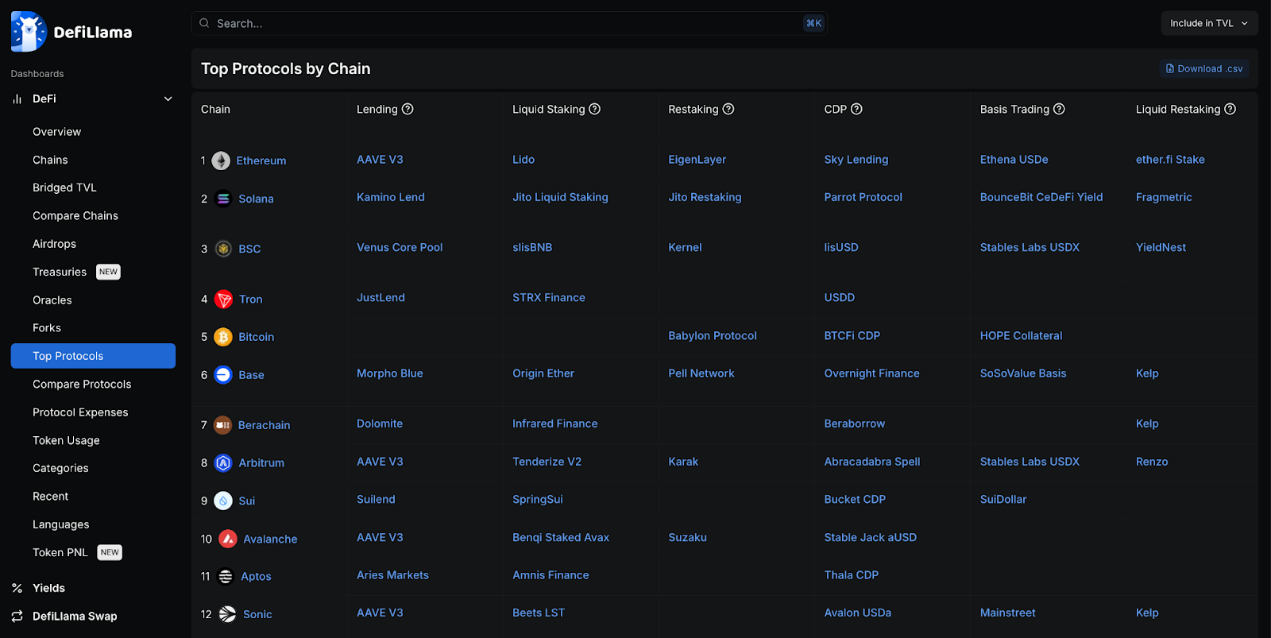
There is no doubt that Aave is the top lending protocol among several EVM chains such as Ethereum, Sonic, Avalanche, and Arbitrum, but Morpho dominates on Base.

Most blockchains have their own lending and stablecoin projects. Restaking is also evolving as many major blockchains have their own protocols, with the largest player being Eigen Layer, but Pell Network having the widest coverage.

Stargate is the main cross-chain protocol across multiple chains in TVL.

The protocol on Ethereum dominates among similar protocols due to the huge transaction volume of Ethereum DeFi.

Protocol Category

A panoramic interpretation of the current status of DeFi development: Aave and Lido become the highest TVL protocols, and Solana ranks second among the public chains

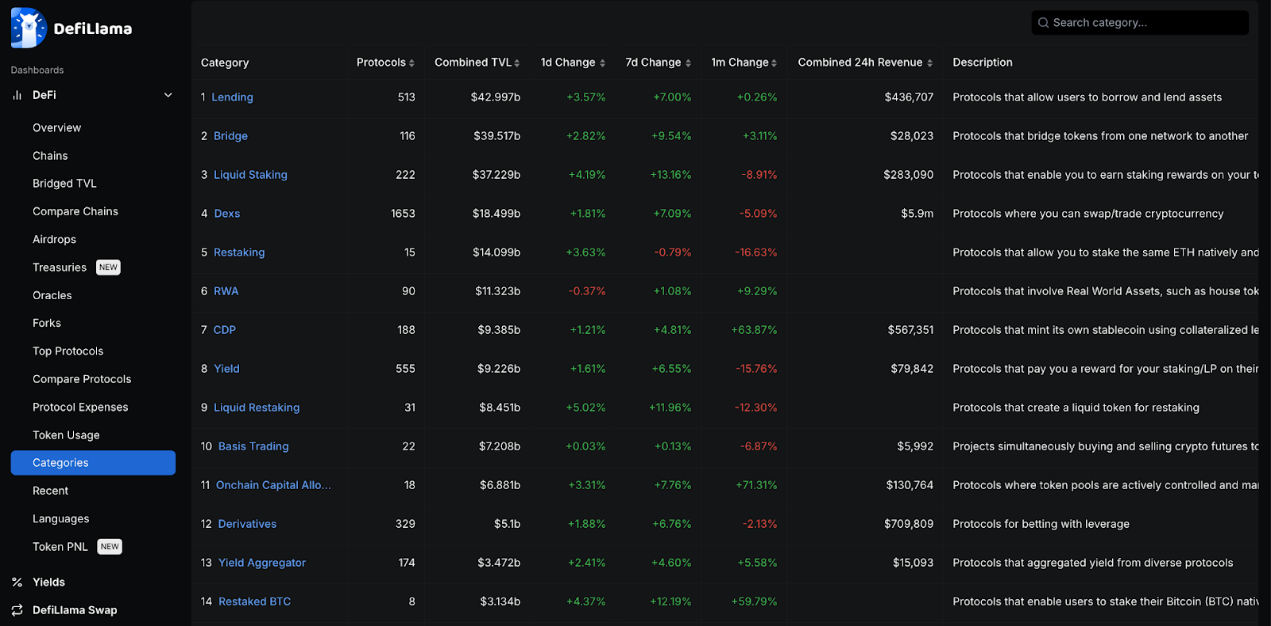
Lending, cross-chain bridges, and liquidity staking have the highest TVL, with relatively small gaps between them, ranging from $42 billion to $37 billion. Last year, liquidity staking was far ahead, but the gap has narrowed, with lending and cross-chain bridges catching up.

Aave accounts for 44% of all lending, and Lido accounts for 43% of all liquidity staking. These two protocols are the two with the highest TVL in the entire DeFi space to date.

DEXs have a much lower TVL of around $18 billion, with the top protocols being Uniswap, Curve, and PancakeSwap, each running on more than 9 EVM chains. Even with a lower TVL, this is the most profitable segment, with $5.9 million in transaction fees in the past 24 hours. With such a money-making effect, it’s no surprise that DEXs have more than 1,600 protocols in total.

The cross-chain bridge category is dominated by wrapped Bitcoin equivalents such as WBTC and Binance Bitcoin.

Foundations and Treasury

A panoramic interpretation of the current status of DeFi development: Aave and Lido become the highest TVL protocols, and Solana ranks second among the public chains

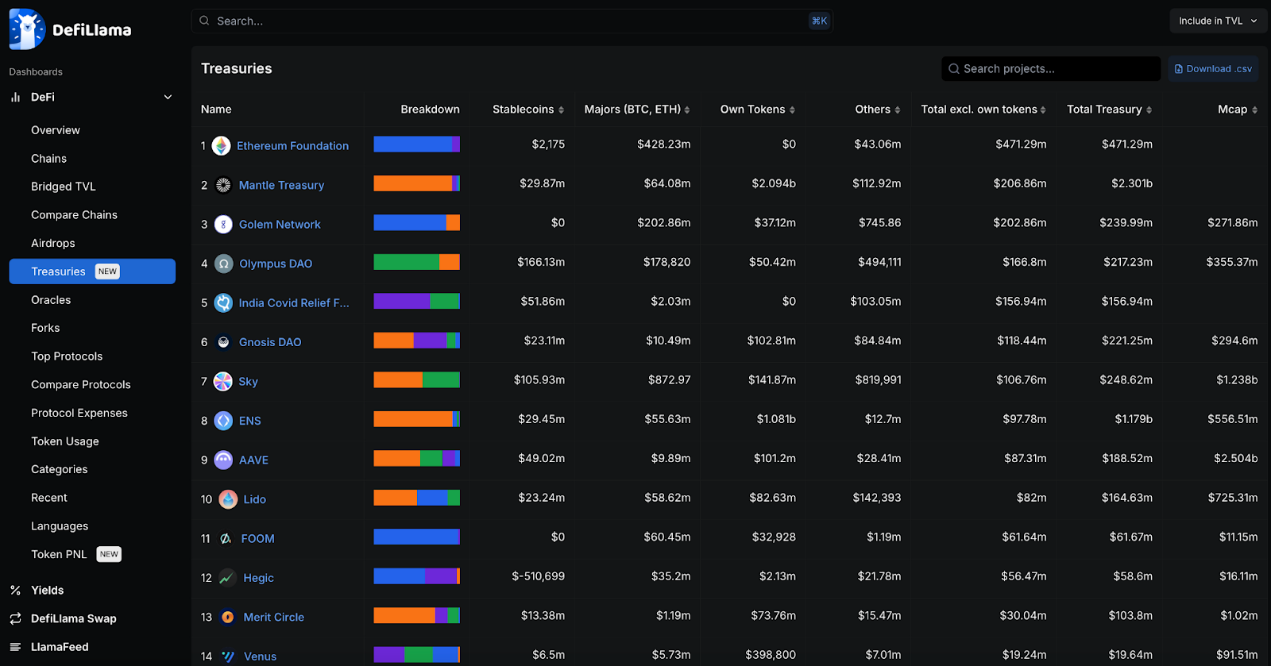
The Ethereum Foundation’s vault is just over half the size of what it was a year ago, a significant drop. Meanwhile, Mantle has a large vault, but it’s mostly denominated in its own tokens.

Some Ethereum-related projects also dominate in terms of total treasury, such as Aave, ENS, Lido, and Sky. However, they also mostly hold their own tokens.

If you exclude your own tokens, the rankings are even more mixed, but few vaults are primarily in stablecoins, so they are primarily affected by market fluctuations.

Yield

A panoramic interpretation of the current status of DeFi development: Aave and Lido become the highest TVL protocols, and Solana ranks second among the public chains

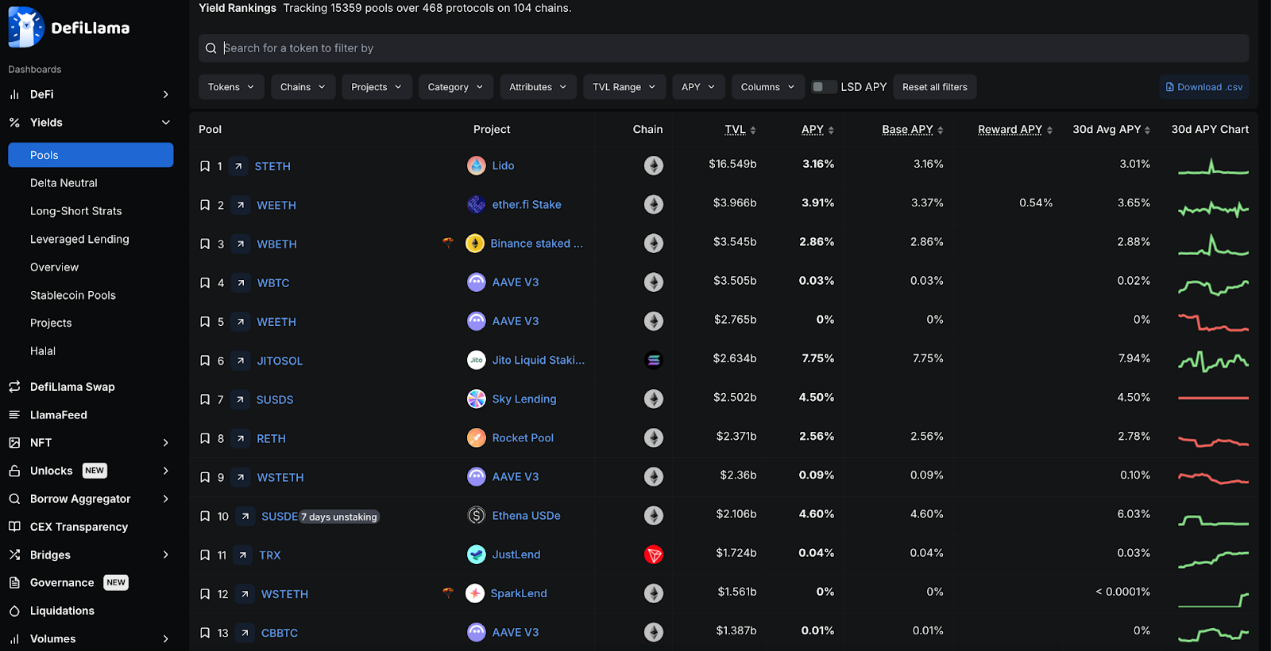
Most players deposit their funds in Lido to earn returns, probably because most people have confidence in ETH as a long-term value storage tool, and Lido also dominates in liquidity staking. Other ETH-based liquidity staking protocols also dominate, such as ether.fi.

JitoSOL’s pledged SOL yield is 7.75%, which exceeds all other top yield products. Marinade and Jupiter’s SOL annual interest rates are even higher, at about 9%.

Sky Lending is the number one low-risk stablecoin option by TVL, with over $2.5 billion in SUSDS stablecoins and a yield of 4.5%.

DeFiLlama tracks over 15,000 liquidity pools across 468 protocols on 104 blockchains.

cost

A panoramic interpretation of the current status of DeFi development: Aave and Lido become the highest TVL protocols, and Solana ranks second among the public chains

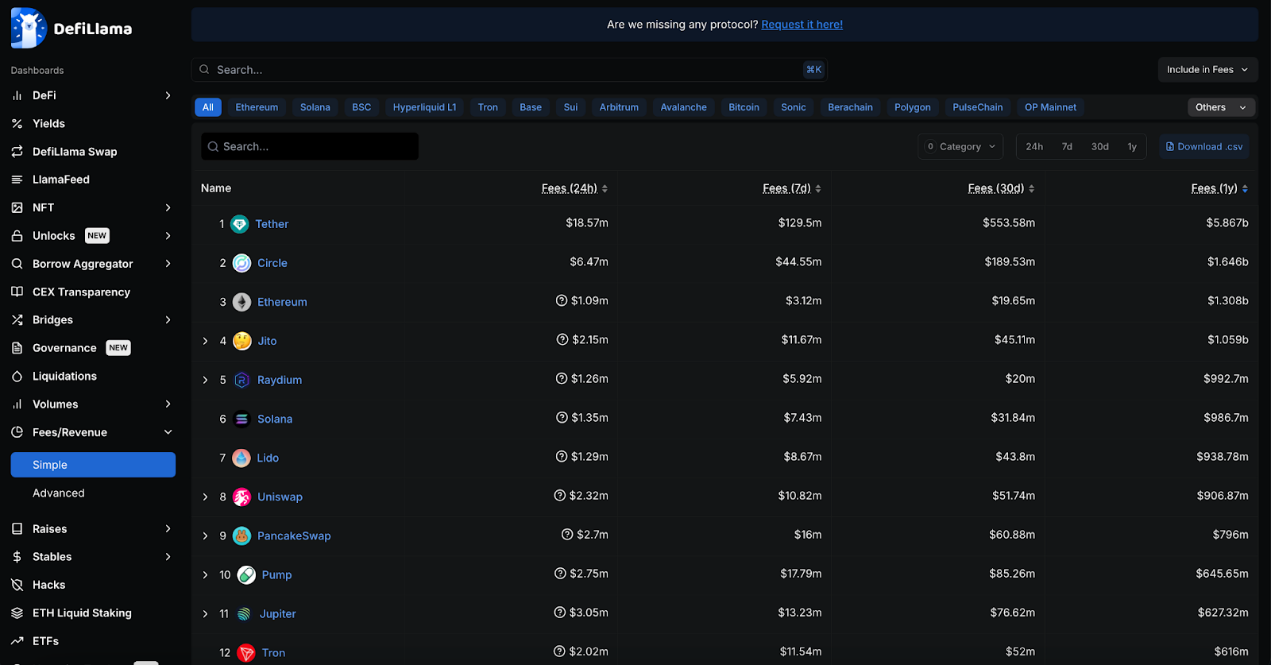
Tether and Circle’s respective stablecoins are by far the largest fee-generating businesses in crypto. Tether alone generated more than $5.8 billion in revenue in the past year.

Throughout the past year, Gas on Ethereum is still one of the largest ways to spend fees, with its total fees not far behind Circle, at $1.3 billion and $1.6 billion respectively. However, Ethereum's fees are falling rapidly, and in the past 30 days, it has not even made it into the top 15. However, Ethereum-based protocols Lido and Uniswap are still earning high fees.

Solana’s fee ecosystem has grown the fastest over the past year, with Jito, Raydium, and Pump.fun all earning huge fees. This is likely mainly due to the significant growth of memecoin on Solana.

Bitcoin’s fees have fallen by about half since last year, and as many other competitors in the fee market have risen, Bitcoin’s ranking has fallen from second to 14th.

Stablecoins

A panoramic interpretation of the current status of DeFi development: Aave and Lido become the highest TVL protocols, and Solana ranks second among the public chains

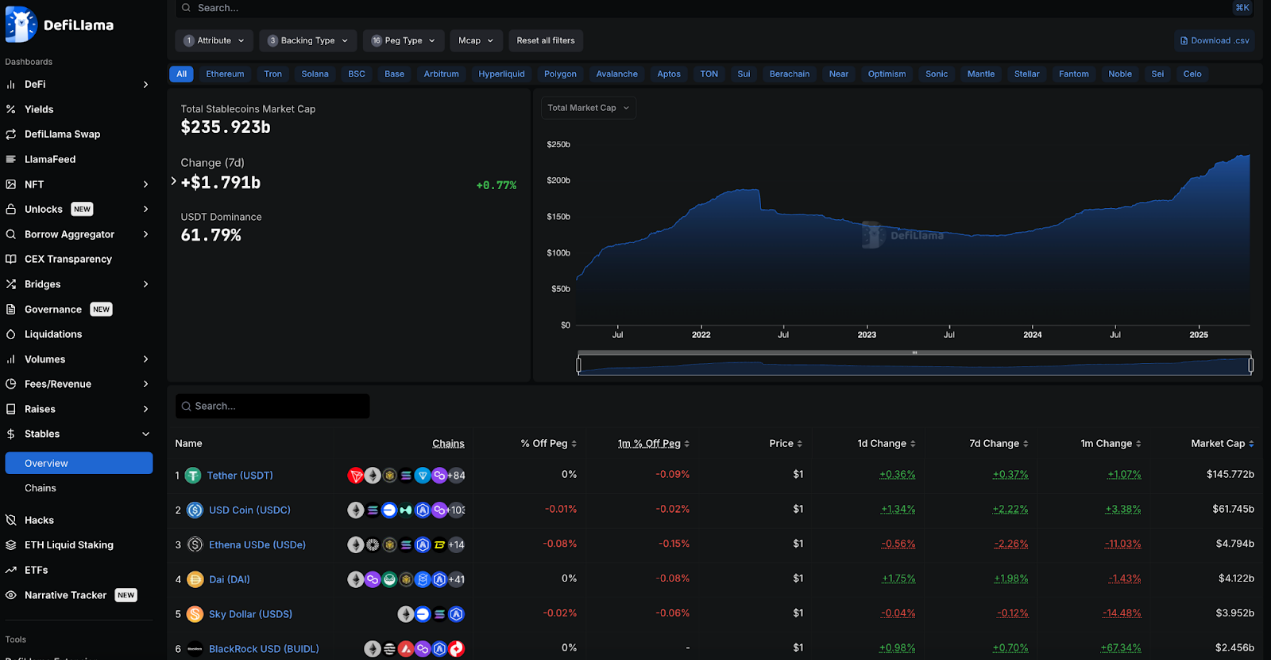
The total stablecoin market capitalization has almost doubled from $136 billion last year to $235 billion currently. However, USDT and USDC still dominate, accounting for 62% and 26% respectively, and together account for 88% of the entire market.

The largest growth was seen in Ethena’s USDe, which, despite not having been launched a year ago, has now become the third-largest stablecoin with a 2% market share.

Sky issued USDS tokens, breaking the dominance of DAI. However, after combining the market capitalization of DAI and USDS, Sky has a 3.5% market share and is still the third largest market player.

USDT, USDC, DAI/USDS and USDe together account for approximately 93% of the stablecoin market, with a market capitalization of more than $220 billion.

BlackRock's BUIDL fund represents a new entrant, indicating that TradFi also wants a piece of this market.

Financing

A panoramic interpretation of the current status of DeFi development: Aave and Lido become the highest TVL protocols, and Solana ranks second among the public chains

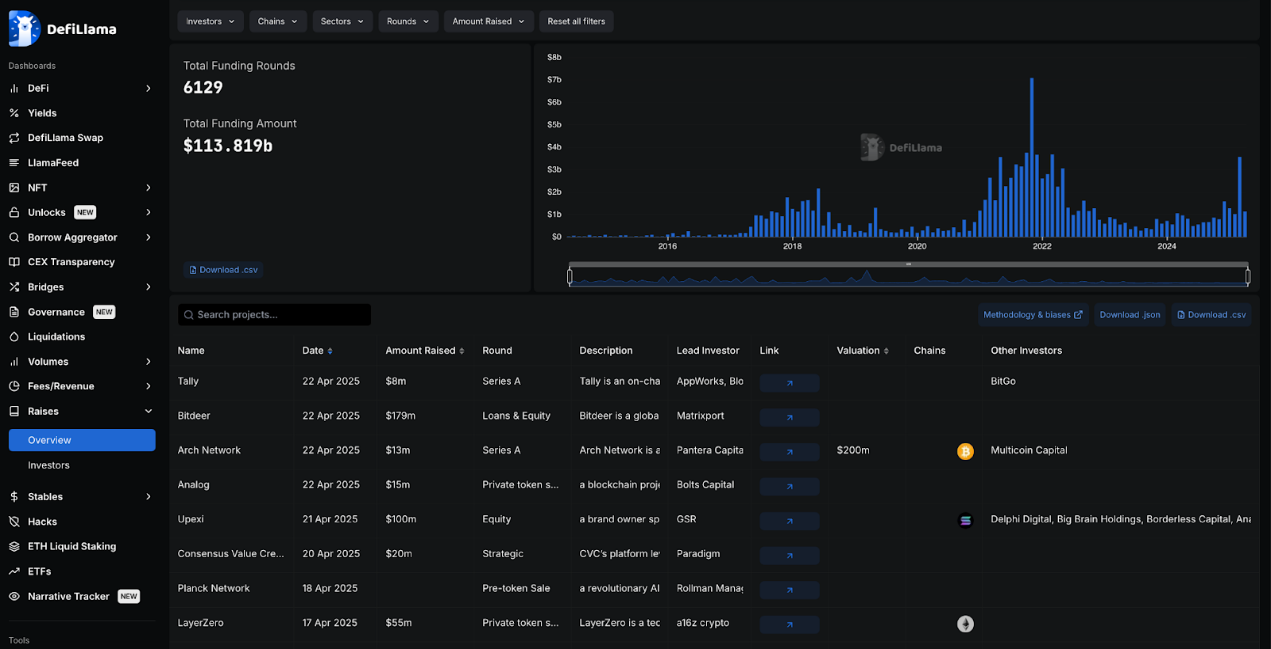
The DeFi sector has raised over $113 billion in financing, with a total of 6,129 financing rounds. The amount of financing reached its peak in late 2021 and early 2022, but is currently growing rapidly, exceeding $3.5 billion last month alone.

FTX and Celsius are among the most funded projects in the DeFi space, raising $900 million and $750 million respectively, and are also among the biggest failures in the space. EOS is in a similar situation, with its $4 billion funding round barely delivering on its promise.

Hacker Attacks

A panoramic interpretation of the current status of DeFi development: Aave and Lido become the highest TVL protocols, and Solana ranks second among the public chains

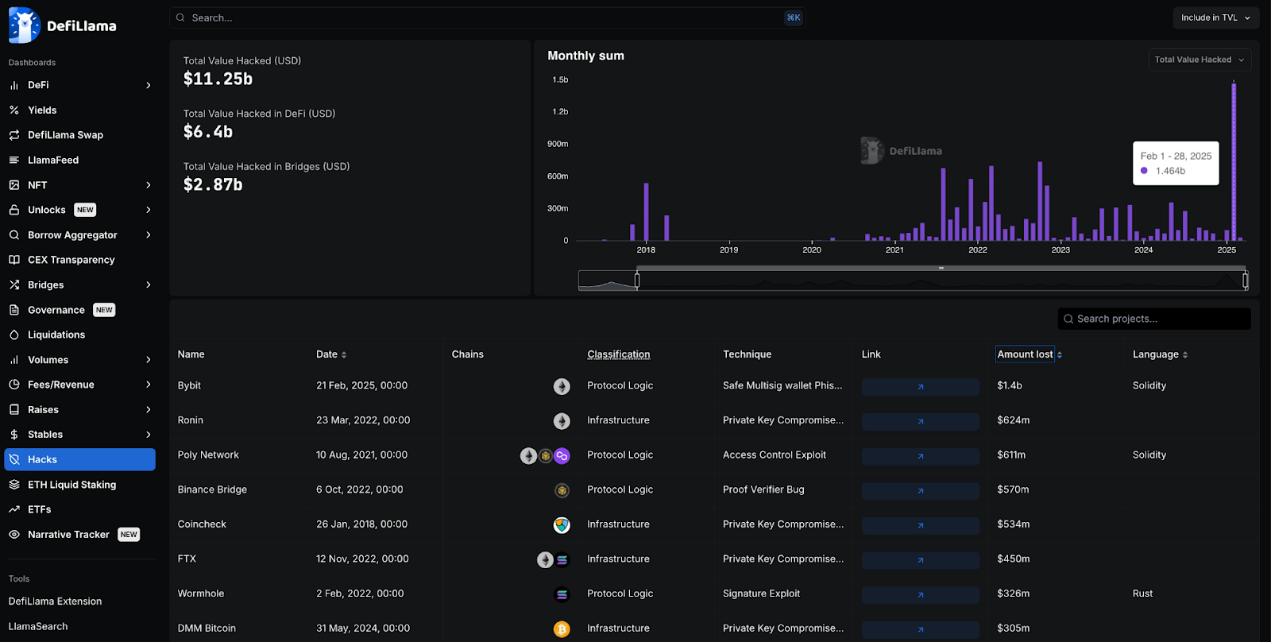
The DeFi sector has suffered more than $11.2 billion in hacker attacks, 25% of which came from cross-chain bridges and the rest from other DeFi companies and protocols.

In February this year, ByBit was hacked, which was the largest single hack in the history of cryptocurrencies, with losses exceeding $1.4 billion. The second largest hack occurred in 2022, when an attack on the Ronin network resulted in a loss of $624 million.

The North Korean group Lazarus was responsible for both hacks, becoming the largest hacker group in the crypto space.

Most large-scale hacking attacks have occurred in the Ethereum ecosystem, probably because most of the liquidity in DeFi is concentrated in the Ethereum ecosystem.

Summarize

Overall, DeFi transaction volume is still mainly dominated by Ethereum and its EVM ecosystem (with numerous L2s), from which DeFi has risen.

Solana has seen massive growth over the past year and is catching up, while Bitcoin has surprisingly begun to develop its own DeFi ecosystem, albeit one that is not designed to be a smart contract platform. The Tron ecosystem appears to have lagged behind the others, but Tron remains an important hub for stablecoin activity.

Related reading: Broker Act repeal, CAKE governance attack... 10 recent thoughts on DeFi

Market Opportunity
DeFi Logo
DeFi Price(DEFI)
$0.000343
$0.000343$0.000343
+0.29%
USD
DeFi (DEFI) Live Price Chart
Disclaimer: The articles reposted on this site are sourced from public platforms and are provided for informational purposes only. They do not necessarily reflect the views of MEXC. All rights remain with the original authors. If you believe any content infringes on third-party rights, please contact [email protected] for removal. MEXC makes no guarantees regarding the accuracy, completeness, or timeliness of the content and is not responsible for any actions taken based on the information provided. The content does not constitute financial, legal, or other professional advice, nor should it be considered a recommendation or endorsement by MEXC.

You May Also Like

Over 60% of crypto press releases linked to high-risk or scam projects: Report

Over 60% of crypto press releases linked to high-risk or scam projects: Report

A data analysis shows crypto press release wires are dominated by scam-linked projects, hype-driven content and low-impact announcements, raising concerns about
Share
Crypto.news2026/02/04 22:02
ArtGis Finance Partners with MetaXR to Expand its DeFi Offerings in the Metaverse

ArtGis Finance Partners with MetaXR to Expand its DeFi Offerings in the Metaverse

By using this collaboration, ArtGis utilizes MetaXR’s infrastructure to widen access to its assets and enable its customers to interact with the metaverse.
Share
Blockchainreporter2025/09/18 00:07
Crucial US Stock Market Update: What Wednesday’s Mixed Close Reveals

Crucial US Stock Market Update: What Wednesday’s Mixed Close Reveals

BitcoinWorld Crucial US Stock Market Update: What Wednesday’s Mixed Close Reveals The financial world often keeps us on our toes, and Wednesday was no exception. Investors watched closely as the US stock market concluded the day with a mixed performance across its major indexes. This snapshot offers a crucial glimpse into current investor sentiment and economic undercurrents, prompting many to ask: what exactly happened? Understanding the Latest US Stock Market Movements On Wednesday, the closing bell brought a varied picture for the US stock market. While some indexes celebrated gains, others registered slight declines, creating a truly mixed bag for investors. The Dow Jones Industrial Average showed resilience, climbing by a notable 0.57%. This positive movement suggests strength in some of the larger, more established companies. Conversely, the S&P 500, a broader benchmark often seen as a barometer for the overall market, experienced a modest dip of 0.1%. The technology-heavy Nasdaq Composite also saw a slight retreat, sliding by 0.33%. This particular index often reflects investor sentiment towards growth stocks and the tech sector. These divergent outcomes highlight the complex dynamics currently at play within the American economy. It’s not simply a matter of “up” or “down” for the entire US stock market; rather, it’s a nuanced landscape where different sectors and company types are responding to unique pressures and opportunities. Why Did the US Stock Market See Mixed Results? When the US stock market delivers a mixed performance, it often points to a tug-of-war between various economic factors. Several elements could have contributed to Wednesday’s varied closings. For instance, positive corporate earnings reports from certain industries might have bolstered the Dow. At the same time, concerns over inflation, interest rate policies by the Federal Reserve, or even global economic uncertainties could have pressured growth stocks, affecting the S&P 500 and Nasdaq. Key considerations often include: Economic Data: Recent reports on employment, manufacturing, or consumer spending can sway market sentiment. Corporate Announcements: Strong or weak earnings forecasts from influential companies can significantly impact their respective sectors. Interest Rate Expectations: The prospect of higher or lower interest rates directly influences borrowing costs for businesses and consumer spending, affecting future profitability. Geopolitical Events: Global tensions or trade policies can introduce uncertainty, causing investors to become more cautious. Understanding these underlying drivers is crucial for anyone trying to make sense of daily market fluctuations in the US stock market. Navigating Volatility in the US Stock Market A mixed close, while not a dramatic downturn, serves as a reminder that market volatility is a constant companion for investors. For those involved in the US stock market, particularly individuals managing their portfolios, these days underscore the importance of a well-thought-out strategy. It’s important not to react impulsively to daily movements. Instead, consider these actionable insights: Diversification: Spreading investments across different sectors and asset classes can help mitigate risk when one area underperforms. Long-Term Perspective: Focusing on long-term financial goals rather than short-term gains can help weather daily market swings. Stay Informed: Keeping abreast of economic news and company fundamentals provides context for market behavior. Consult Experts: Financial advisors can offer personalized guidance based on individual risk tolerance and objectives. Even small movements in major indexes can signal shifts that require attention, guiding future investment decisions within the dynamic US stock market. What’s Next for the US Stock Market? Looking ahead, investors will be keenly watching for further economic indicators and corporate announcements to gauge the direction of the US stock market. Upcoming inflation data, statements from the Federal Reserve, and quarterly earnings reports will likely provide more clarity. The interplay of these factors will continue to shape investor confidence and, consequently, the performance of the Dow, S&P 500, and Nasdaq. Remaining informed and adaptive will be key to understanding the market’s trajectory. Conclusion: Wednesday’s mixed close in the US stock market highlights the intricate balance of forces influencing financial markets. While the Dow showed strength, the S&P 500 and Nasdaq experienced slight declines, reflecting a nuanced economic landscape. This reminds us that understanding the ‘why’ behind these movements is as important as the movements themselves. As always, a thoughtful, informed approach remains the best strategy for navigating the complexities of the market. Frequently Asked Questions (FAQs) Q1: What does a “mixed close” mean for the US stock market? A1: A mixed close indicates that while some major stock indexes advanced, others declined. It suggests that different sectors or types of companies within the US stock market are experiencing varying influences, rather than a uniform market movement. Q2: Which major indexes were affected on Wednesday? A2: On Wednesday, the Dow Jones Industrial Average gained 0.57%, while the S&P 500 edged down 0.1%, and the Nasdaq Composite slid 0.33%, illustrating the mixed performance across the US stock market. Q3: What factors contribute to a mixed stock market performance? A3: Mixed performances in the US stock market can be influenced by various factors, including specific corporate earnings, economic data releases, shifts in interest rate expectations, and broader geopolitical events that affect different market segments uniquely. Q4: How should investors react to mixed market signals? A4: Investors are generally advised to maintain a long-term perspective, diversify their portfolios, stay informed about economic news, and avoid impulsive decisions. Consulting a financial advisor can also provide personalized guidance for navigating the US stock market. Q5: What indicators should investors watch for future US stock market trends? A5: Key indicators to watch include upcoming inflation reports, statements from the Federal Reserve regarding monetary policy, and quarterly corporate earnings reports. These will offer insights into the future direction of the US stock market. Did you find this analysis of the US stock market helpful? Share this article with your network on social media to help others understand the nuances of current financial trends! To learn more about the latest stock market trends, explore our article on key developments shaping the US stock market‘s future performance. This post Crucial US Stock Market Update: What Wednesday’s Mixed Close Reveals first appeared on BitcoinWorld.
Share
Coinstats2025/09/18 05:30