

Crypto Price Prediction for Today, April 26: TRON (TRX), Injective (INJ), XRP
TRON, Injective, and XRP moved in different directions over the past day. XRP stayed flat inside a tight range. TRON drifted lower toward oversold levels. Injective broke higher and pushed into overbought territory.
This kind of split in the crypto market means each asset is following its own path. TRX looks tired, INJ looks extended, and XRP looks stuck. Today’s price reaction around these levels will decide what comes next.
TRON Price Action Shows Weakness With RSI Nearing Oversold
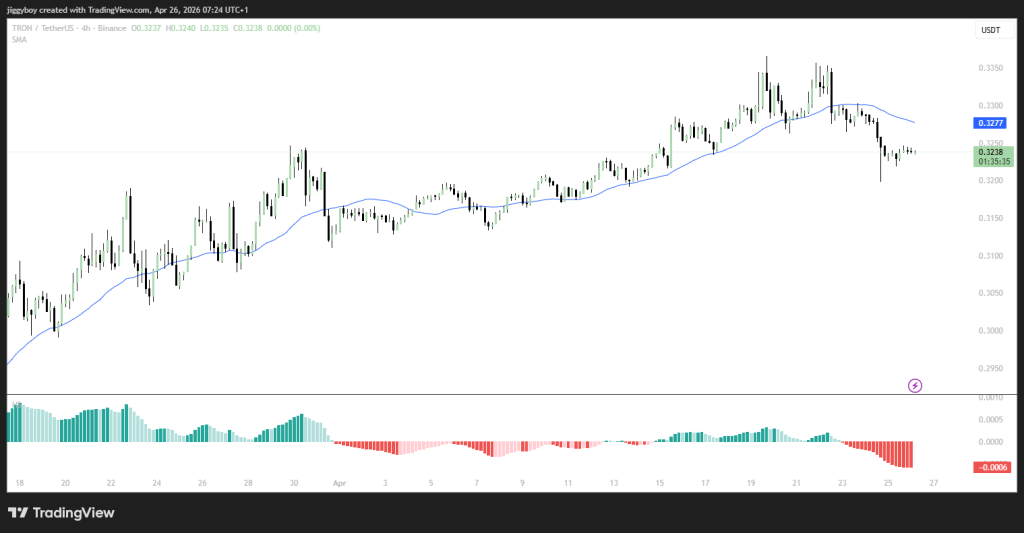
TRON opened near $0.3240 and drifted down from there. The low hit $0.3235, the high reached $0.3245, and price closed the day around $0.3238. That leaves a small loss, and more importantly, price ended below both moving averages.
Sellers have controlled the session. We had a look at the TRX chart and noticed the last three candles all closed with upper wicks.
 Source: TradingView.com
Every time the TRX price tried to move up, sellers pushed it back down. Volume on down candles has been higher than up candles over the past two days. The 7 RSI at 32.37 is one good down candle away from oversold.
Key levels remain very clear for today. First resistance comes in at $0.3250. Above that, $0.3277, where the 30 SMA is at. Support is at $0.3235. A break below that sends price to $0.3200, then $0.3150.
| Indicator | Value | Interpretation |
|---|---|---|
| Price | $0.3238 | Below both moving averages |
| 7 SMA | $0.3237 | Acting as resistance |
| 30 SMA | $0.3277 | Well above price, bearish |
| RSI 14 | 36.87 | Nearing oversold |
| RSI 7 | 32.37 | Weak, close to oversold |
| MACD | -0.0002 | Negative, sellers in control |
| Histogram | -0.0006 | Momentum fading lower |
TRON Prediction For Today
TRON is leaning weak, but the next move comes down to $0.3235.
In a bullish case, if buyers defend $0.3235 and push price above $0.3250, TRX could move toward $0.3277 next.
In a neutral case, if that push doesn’t happen, price is likely to stay stuck between $0.3235 and $0.3250, moving sideways without a clear direction.
A bearish case develops if price falls below $0.3235 and stays there. That could open a move toward $0.3200, then $0.3150.
Injective Price Action Breaks Higher But RSI Hits 77
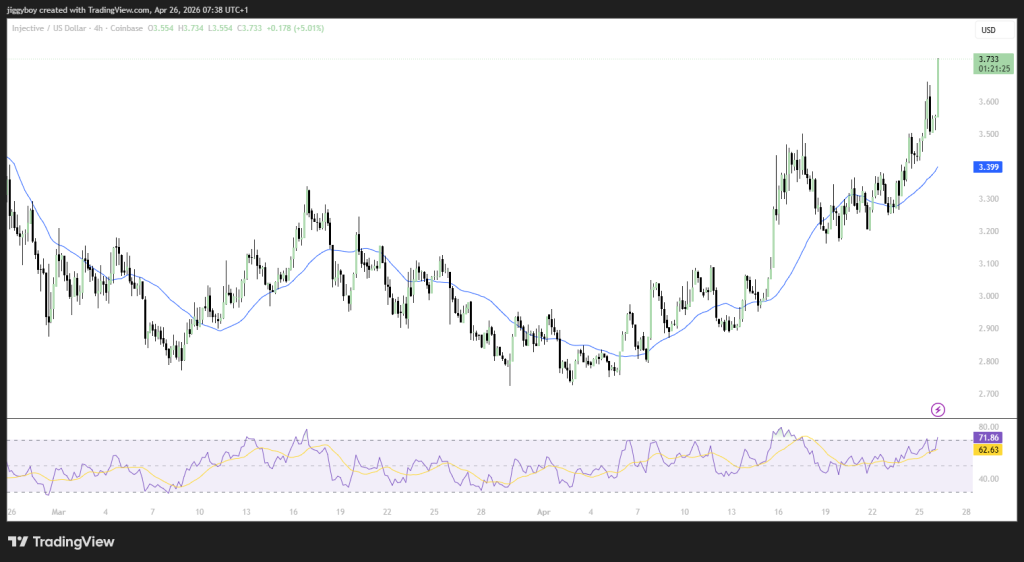
Injective opened near $3.55 and pushed higher throughout the session. The low formed around $3.55, and the high pushed toward $3.726 before settling near $3.64. That leaves a gain of nearly 5%, and price ended well above both moving averages.
Buyers showed real conviction. We had a look at the INJ chart and noticed the 4-hour candle that broke $3.60 had twice the volume of the previous four candles combined.
 Source: TradingView.com
But after the breakout, the INJ price printed a long upper wick near $3.73, then two smaller candles with lower highs. Sellers are stepping in at that level. The 7 RSI hit 77.45, which is very overbought. Looking back at March 15, the last time the 7 RSI hit 76, INJ dropped 8% over the next two days.
Key levels remain very clear for today. Immediate support is at $3.60, which was resistance before the breakout. A clean move below that could open the path toward $3.55. Resistance rests at $3.73, with a higher ceiling near $3.80.
Read Also: ChatGPT Predicts the Price of Silver and Gold if the Fed Cuts Rates in Q3 2026
| Indicator | Value | Interpretation |
|---|---|---|
| Price | $3.64 | Above both moving averages |
| 7 SMA | $3.567 | Support below price |
| 30 SMA | $3.399 | Well below price, bullish |
| RSI 14 | 70.83 | Overbought territory |
| RSI 7 | 77.45 | Very overbought, due for cooldown |
| MACD | 0.20 | Strong positive momentum |
| Histogram | 0.0184 | Momentum still rising |
Injective Prediction For Today
Injective is overbought, though direction will depend on whether $3.60 support holds.
A bullish move requires the Injective price to hold $3.60 and break above $3.73. That could lead to a push toward $3.80.
A neutral outcome keeps price moving between $3.60 and $3.73. That would allow the RSI to cool down while holding the breakout.
A bearish case develops if the INJ price falls below $3.60 and stays there. That could open a move toward $3.55.
XRP Price Action Stays Flat Inside a Tight Box
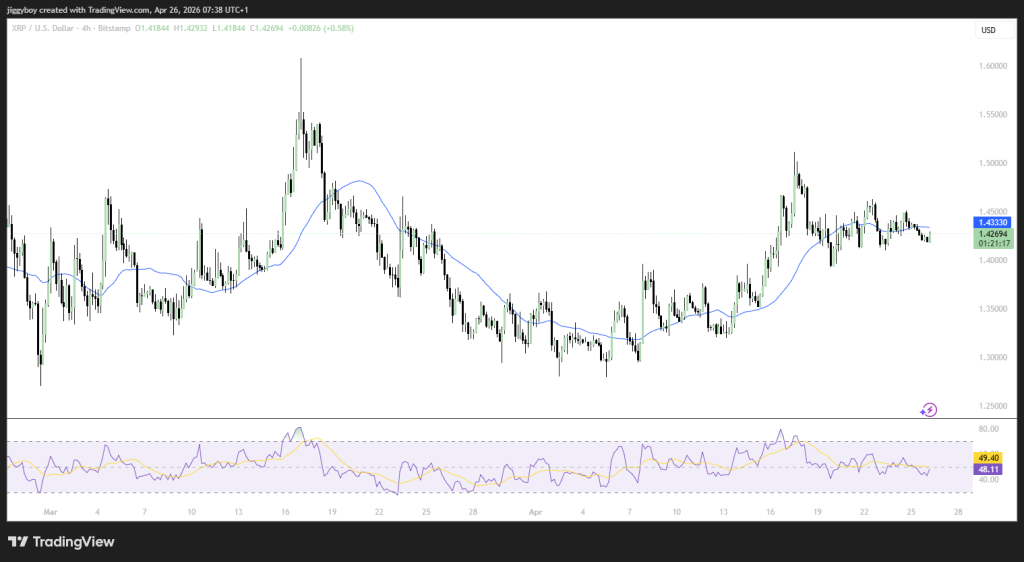
XRP opened near $1.425 and barely moved all day. Price touched $1.426 on the low side and $1.433 on the high side, then ended back at $1.42. The day ended flat, with price landing right on the 7 SMA.
Buyers and sellers are in balance. Neither side has managed to take control. We had a look at the XRP chart and saw that since April 20, XRP has been tightening. Each push higher has been smaller than the last, with highs dropping from $1.44 to $1.435 and then $1.433.
 Source: TradingView.com
The lows got higher: $1.40, then $1.415, then $1.425. That is a classic triangle compression. The XRP price is running out of room. Volume across the last 12 4-hour candles has been below average on eight of them. Low volume during compression usually means a breakout is coming, but direction is unclear.
Key levels remain very clear for today. Immediate resistance is at $1.44, which has rejected price four times. A clean move above that could open the path toward $1.46. Support rests at $1.425, with a deeper safety zone near $1.41.
| Indicator | Value | Interpretation |
|---|---|---|
| Price | $1.42 | Near both moving averages |
| 7 SMA | $1.425 | Flat, no direction |
| 30 SMA | $1.43 | Slight resistance above |
| RSI 14 | 48.03 | Neutral, leaning bearish |
| RSI 7 | 47.37 | Weak short term momentum |
| MACD | -0.00170 | Negative but very small |
| Histogram | 0.00035 | Trying to turn positive |
XRP Prediction For Today
XRP is stuck for now. The next move depends on whether price breaks out of this range.
For a bullish move, XRP must hold $1.425 and climb above $1.44. That could send it toward $1.46
A neutral outcome keeps price moving between $1.425 and $1.44. That would confirm continued consolidation inside the triangle.
A bearish case develops if the XRP price falls below $1.425 and stays there. That could open a move toward $1.41.
Frequently Asked Questions

XRP is moving in a tight range because buyers and sellers are balanced, and the price is cooling off after its recent run.
It’s still holding a strong structure, but the price is pulling back. What happens next depends on whether support levels hold.
Subscribe to our YouTube channel for daily crypto updates, market insights, and expert analysis.
The post Crypto Price Prediction for Today, April 26: TRON (TRX), Injective (INJ), XRP appeared first on CaptainAltcoin.


You May Also Like

Fernando Mendoza 2026 Fantasy Football Outlook

Gunman targets Trump officials at White House dinner, raising security concerns


