

Will XRP price lose $1.40 support as a bearish MACD crossover forms?
XRP price has been consolidating over the past week, holding the $1.40 support despite market volatility. But now a potential bearish MACD crossover threatens a breakdown below the major support level.
- XRP price trades in a tight $1.40–$1.46 range after a 17% rally, with buyers failing to reclaim the $1.45 resistance level.
- On-chain and derivatives data point to weakening momentum, with falling network growth, reduced whale activity, and a long/short ratio below 1.
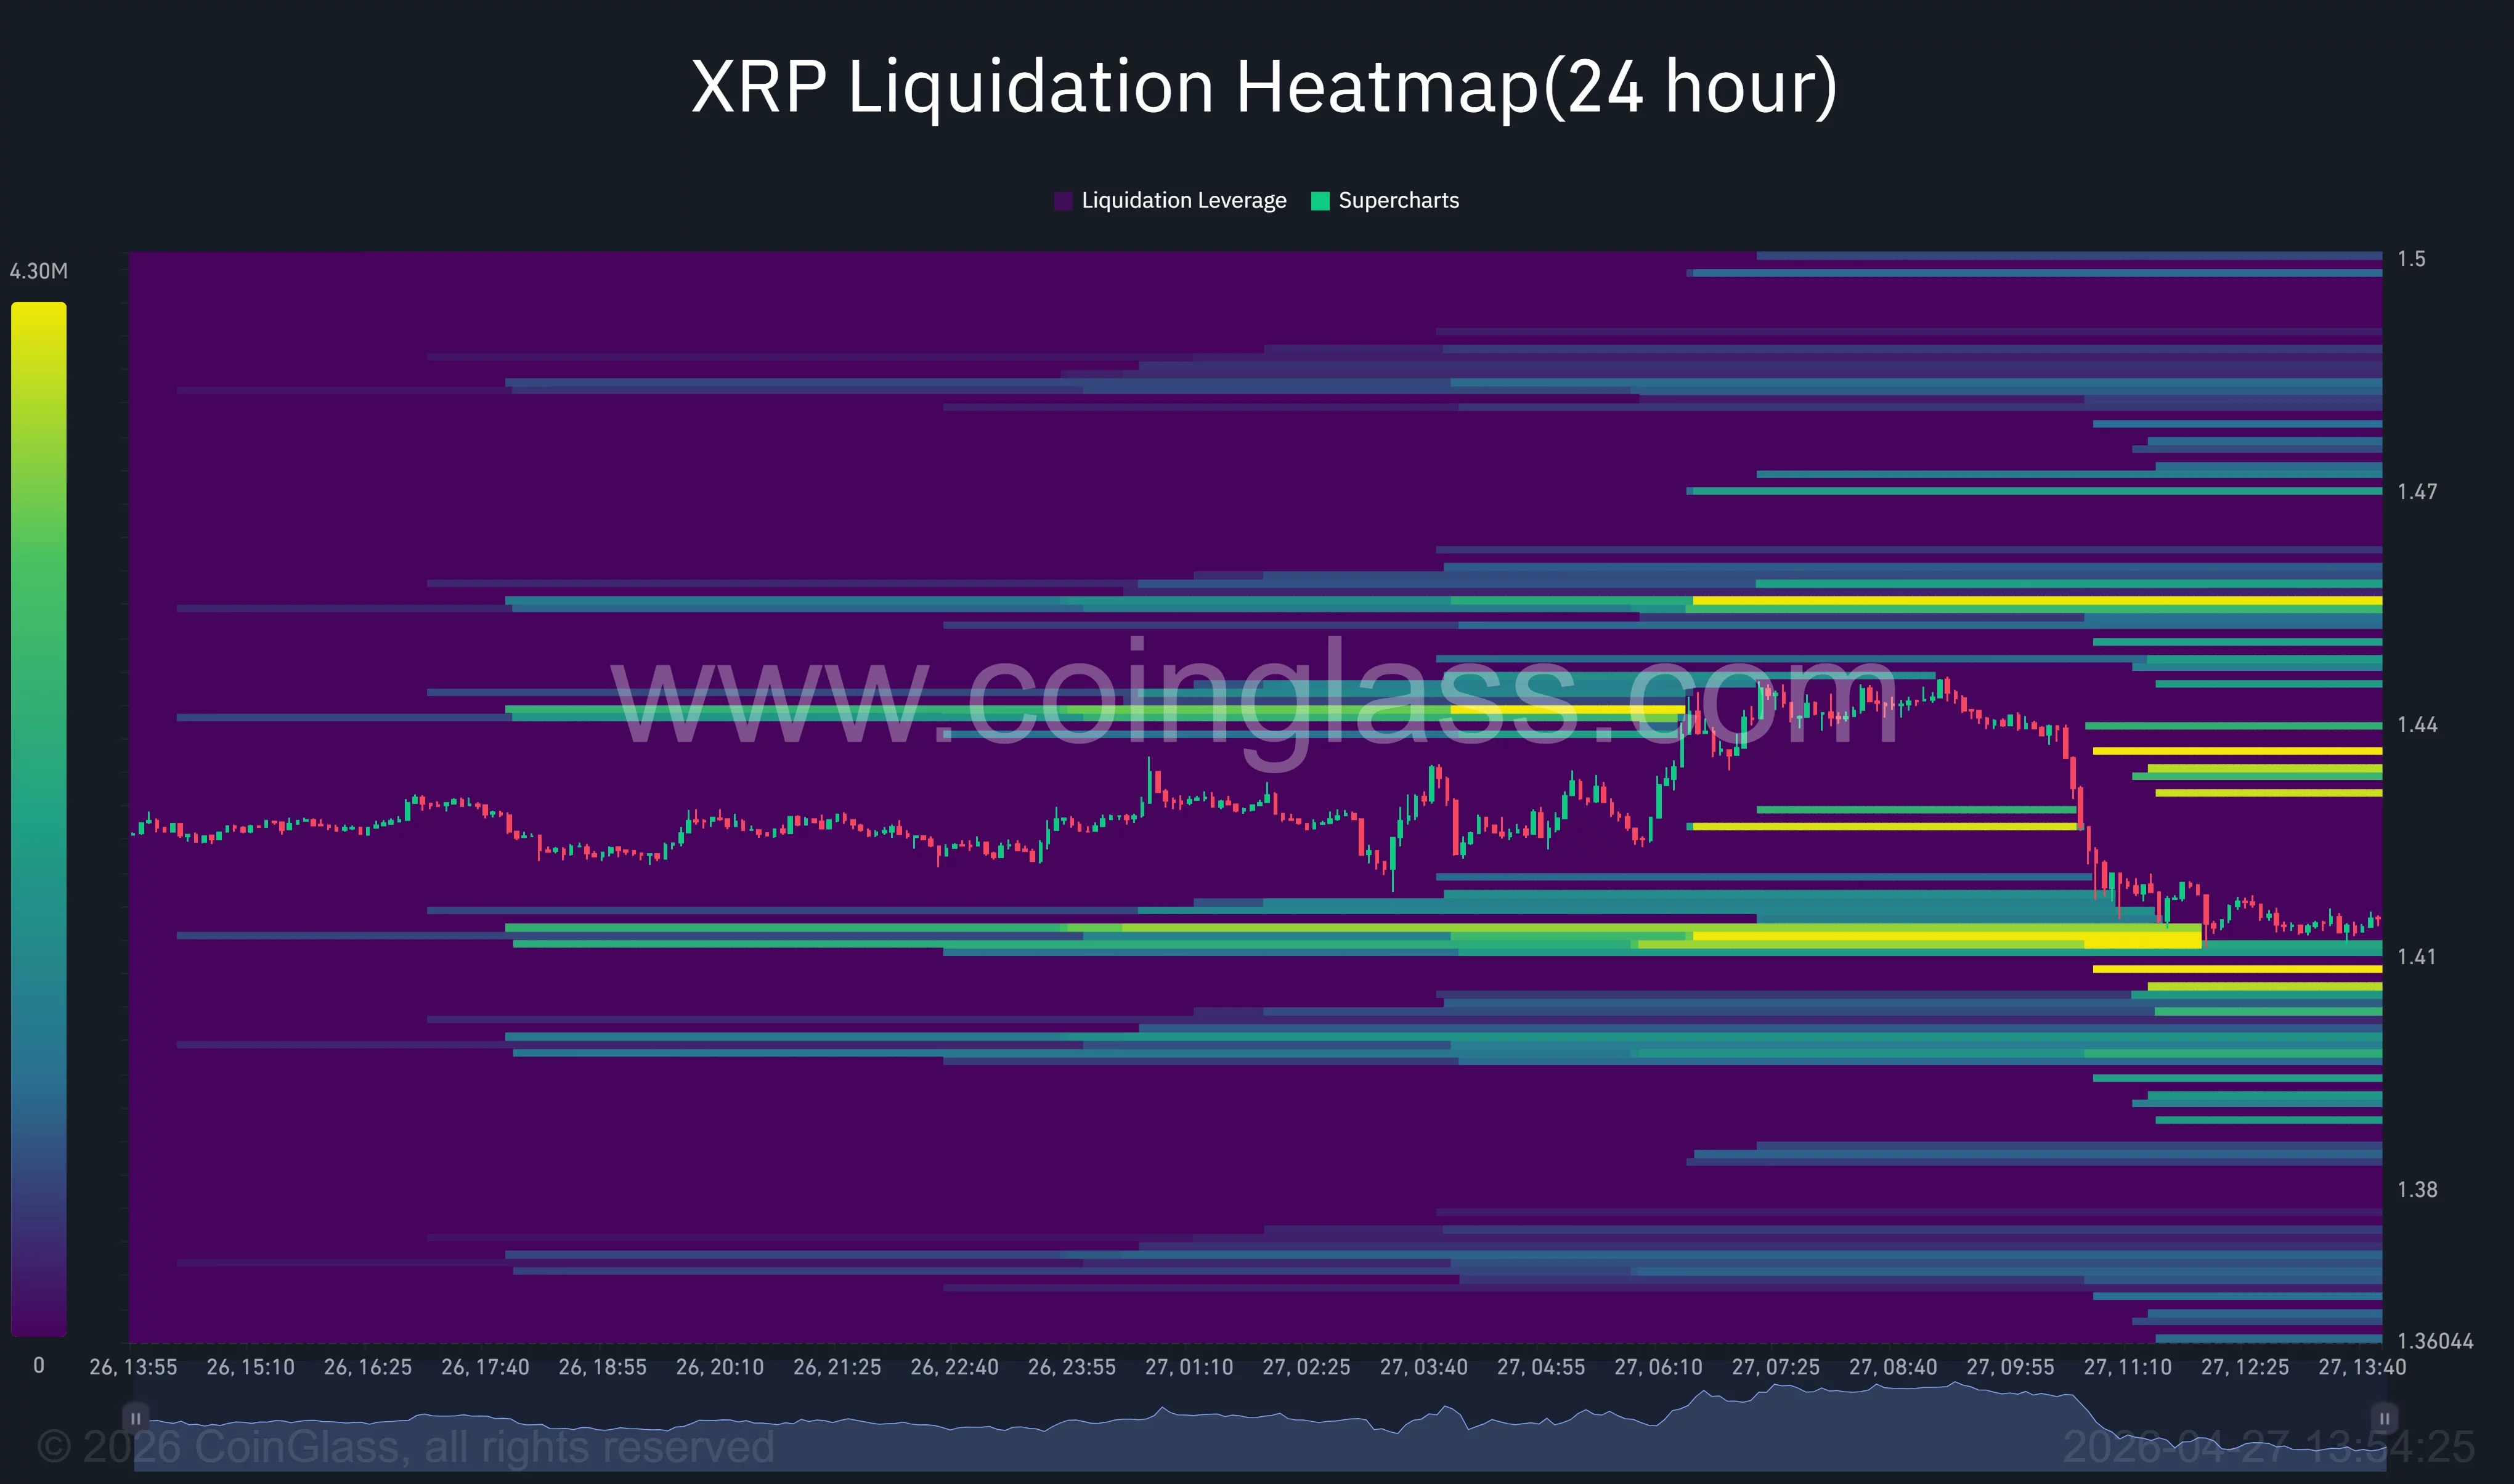
- A potential bearish MACD crossover and a liquidation cluster at $1.40 signal risk of a breakdown toward the $1.30 support level.
According to data from crypto.news, XRP (XRP) price rallied 17% to a monthly high of $1.50 in April before entering consolidation within the $1.40-$1.46 range for the past week as investors remained cautious amid no progress in peace talks between the U.S. and Iran, whose war has been impacting the Strait of Hormuz region, a key maritime waterway for global oil and energy flows.
Unlike Bitcoin (BTC), which has been in an uptrend since the beginning of April, XRP has so far failed to sustain its momentum, with buyers unable to push the asset past the $1.45 resistance zone.
Now, on-chain data suggest that the token is positioned to lose the $1.40 support soon, which can be attributed to a significant drop in network growth and declining whale accumulation. CoinGlass data show that a massive liquidation cluster has formed at $1.40, which acts as a price magnet for market makers seeking liquidity.
Meanwhile, charts also indicate that the token could be entering a distribution phase as trading volume thins out. On the XRP daily chart, the MACD lines are close to confirming a bearish crossover, which often signals strong downside over the following sessions.
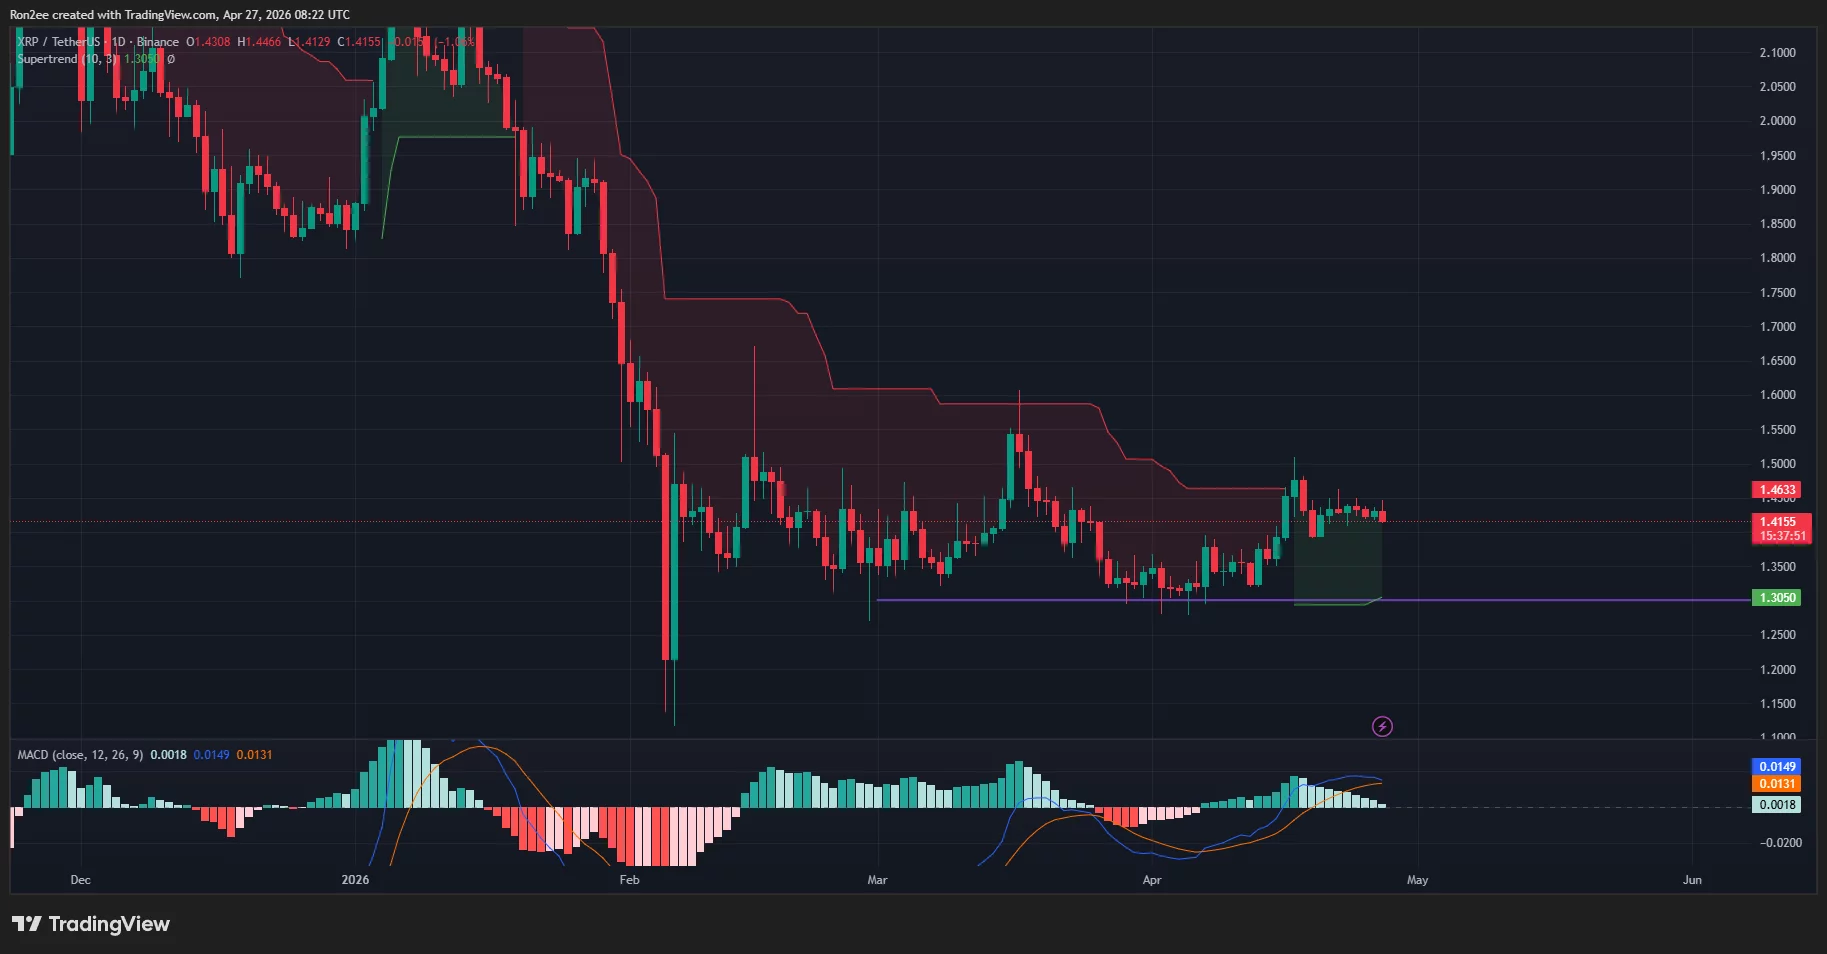
At the same time, the Supertrend indicator has flipped green, a sign that the local trend is still technically bullish, but this conflicting signal suggests a high-stakes battle between bulls and bears.
Hence, once the MACD crossover is confirmed, XRP price would drop to $1.30, the next major psychological support level, and potentially lower if broader market sentiment continues to sour.
Derivative traders have already been positioning for this shift as CoinGlass data show that the long/short ratio of XRP futures has fallen below 1, a telltale sign that more traders are now betting on further price declines.
Disclosure: This article does not represent investment advice. The content and materials featured on this page are for educational purposes only.


You May Also Like
![[Rappler’s Best] Second quarter storm](https://www.rappler.com/tachyon/2026/04/rapplers-best-second-quarter-storm-April-27-2026.jpg)
[Rappler’s Best] Second quarter storm

Trump's family creating problems for GOP as clock ticks down on president's promised bill


