

Bitcoin Price Prediction Tests Channel Support as Strategy Pauses Buys
Key Insights
- Bitcoin price prediction shows BTC testing rising channel support near $78,900.
- Past mid-cycle years saw 68% to 76% drawdowns after May peaks.
- Strategy paused Bitcoin purchases, holding 818,334 BTC ahead of earnings.
Bitcoin price prediction returned to focus in early May 2026 as Bitcoin tested a key technical support level while institutional flows showed mixed signals. BTC traded near $78,900 after pulling back from recent highs, with traders monitoring a possible breakdown below a rising channel structure. At the same time, Strategy paused its regular Bitcoin purchases ahead of its first-quarter earnings report. The setup mattered because price structure, institutional demand, and cycle comparisons converged at a critical level.
Bitcoin Price Tests Rising Channel Support
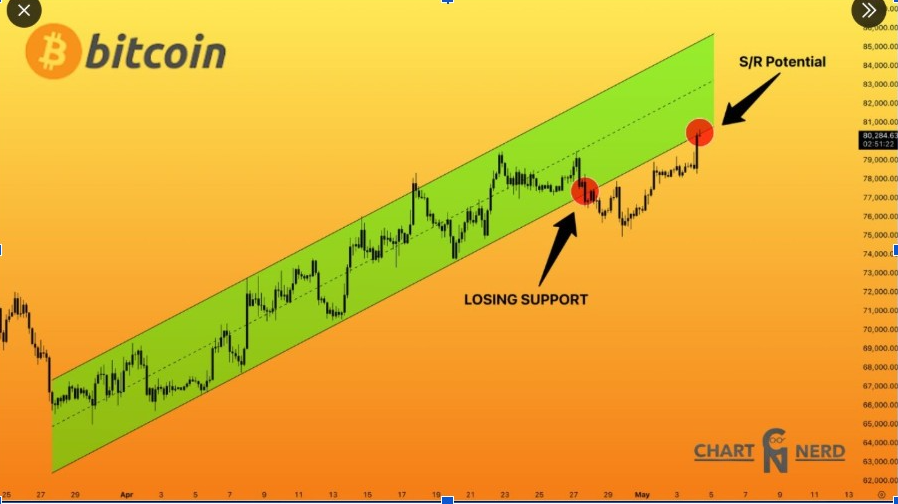
Bitcoin price action on the four-hour timeframe showed pressure near the lower boundary of a rising channel that formed through April. This structure reflected a steady trend of higher highs and higher lows, with buyers repeatedly defending support during pullbacks.
According to market analyst ChartNerd, a confirmed candle close below this channel would signal a shift in short-term momentum. Such a move would break the pattern that has supported the recent recovery and could expose Bitcoin to further downside.
Recent price action showed weakening strength near the $79,000 level, where BTC failed to maintain upward momentum. This rejection increased attention on the channel support as traders assessed whether buyers would continue defending the structure.
 BTCUSD Rising Channel Chart | Source: X
A breakdown below the channel would invalidate the current trend and shift focus toward lower support zones. However, as long as price remains within the structure, the broader short-term trend remains intact. Confirmation depends on a sustained close below support rather than intraday moves.
Strategy Pauses Weekly Bitcoin Buys
Strategy Chairman Michael Saylor said the company will not buy Bitcoin this week. The pause comes before Strategy’s first-quarter earnings report, which is scheduled for Tuesday. Analysts expect the company to report a loss of $18.98 per share.
 Michael Saylor Bitcoin | Source: X
This marks Strategy’s second weekly buying pause this year, after another break in late March. The company added 3,273 BTC last week at an average price of $77,906 per Bitcoin. Strategy now holds 818,334 BTC, equal to nearly 3.9% of Bitcoin’s fixed 21 million supply.
Strategy usually funds its Bitcoin purchases through sales of MSTR shares and perpetual preferred stock. One product, STRC, has drawn debate due to its variable monthly dividend, currently near 11.5% annualized. Some analysts warn that market drawdowns could pressure the structure if confidence weakens.
Meanwhile, supporters argue that Strategy’s model converts demand for yield into long-term Bitcoin exposure. Even so, this week’s pause removes a familiar source of buying from the market.
Long-Term Outlook Shows Extended Bottoming Phase
Veteran trader Peter Brandt provided a longer-term perspective on Bitcoin price prediction. He suggested that Bitcoin could reach $250,000 by 2029 but may require an extended consolidation phase before forming a final bottom.
Brandt indicated that a potential bottom could occur between September and October 2026, aligning with historical cycle timing following Bitcoin halving events. These cycles often show peaks occurring 16 to 18 months after a halving, followed by corrective phases.
 Bitcoin Price Chart | Source: X
In this scenario, Bitcoin may trade sideways or slightly lower before establishing a stronger base. Brandt noted that price does not necessarily need to revisit previous lows for this structure to hold, although deeper pullbacks remain possible.
His downside range extended into the high $40,000s to $50,000s under weaker conditions. This view contrasted with more bullish interpretations that consider the February recovery as the end of the corrective phase.
Bitcoin price now trades near $78,900 as rising channel support, institutional positioning, and historical cycle patterns converge. A confirmed break below channel support will determine whether short-term momentum shifts toward lower levels, while continued defense of this structure may keep BTC within its current upward range.
The post Bitcoin Price Prediction Tests Channel Support as Strategy Pauses Buys appeared first on The Market Periodical.


You May Also Like

Space and Time Targets Institutional Lending With the Launch of Virtual Vaults

GBP/JPY Soars: Six-Day Rally Intensifies as Surging Oil Prices Crush the Yen


