Bitcoin approaches all-time high, Ethereum surges: What do fund flows, volatility and skew indicators indicate?Bitcoin approaches all-time high, Ethereum surges: What do fund flows, volatility and skew indicators indicate?

Bitcoin stabilizes with triple positive support, while Ethereum volatility surges and takes over market dominance

2025/05/15 19:28
4 min read

By: Imran Lakha

Compiled by: Tim, PANews

Bitcoin stabilizes: benefiting from capital flows, policies and macro tailwinds

Bitcoin is once again approaching its all-time high, supported by the return of investor attention and a favorable macro environment.

In April, spot Bitcoin ETFs attracted nearly $3 billion in net inflows, and another $1.6 billion so far in May. Data from the U.S. Commodity Futures Trading Commission (CFTC) showed that leveraged funds did not significantly increase short positions, indicating that most of the capital flows were directional bets rather than arbitrage transactions.

At the policy level, relevant trends are heating up. New Hampshire became the first state in the United States to pass a strategic Bitcoin reserve law, and 19 other states are also preparing similar bills. At the same time, Arizona is simultaneously advancing the legislative process in the field of cryptocurrency custody and strategic reserves.

At the federal level, the Senate blocked the GENIUS Act, a stablecoin regulatory bill, but the crypto market did not take it seriously and market risk appetite remained solid.

Macroeconomic signals are also supportive. Trump's tariff revisions are seen as growth-boosting, boosting stocks and the dollar, while depressing gold, the yen and reducing the odds of a recession. Market volatility has cooled, with the VIX now back to its 12-month average.

In short, Bitcoin is benefiting from three major factors: rising institutional demand, favorable policy environment, and a warming macroeconomic environment. From the perspective of position layout, investors are actively going long.

Bitcoin cedes volatility dominance to Ethereum

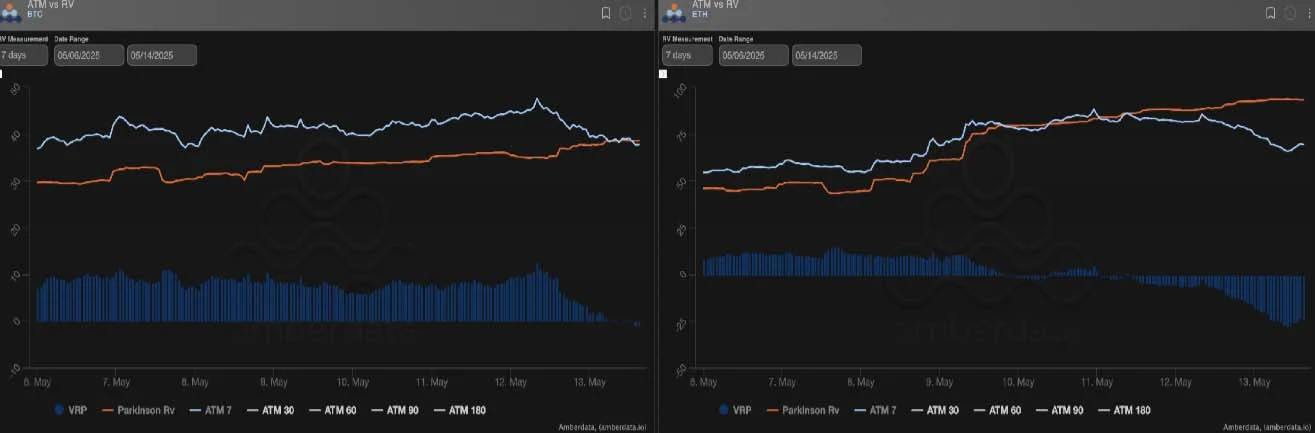
Bitcoin's realized volatility rebounded by about 8 percentage points and re-crossed the $100,000 mark. Ethereum was even more eye-catching, with its realized volatility soaring to 90%, and its price jumping 30% in just two days. Bitcoin's short-term implied volatility fell slightly, while Ethereum's implied volatility soared by 20 volatility points due to sharp price fluctuations.

The holding cost of Bitcoin returned to neutral, but the holding cost of Ethereum turned deeply negative, and Gamma sellers suffered heavy losses.

Bitcoin's rally has only broken through the implied high (at the 100,000 mark) once, while Ethereum has achieved multiple upward breakthroughs. It seems that Bitcoin has handed over the momentum to Ethereum, but whether this situation can continue remains to be verified by time.

Bitcoin stabilizes with triple positive support, while Ethereum volatility surges and takes over market dominance

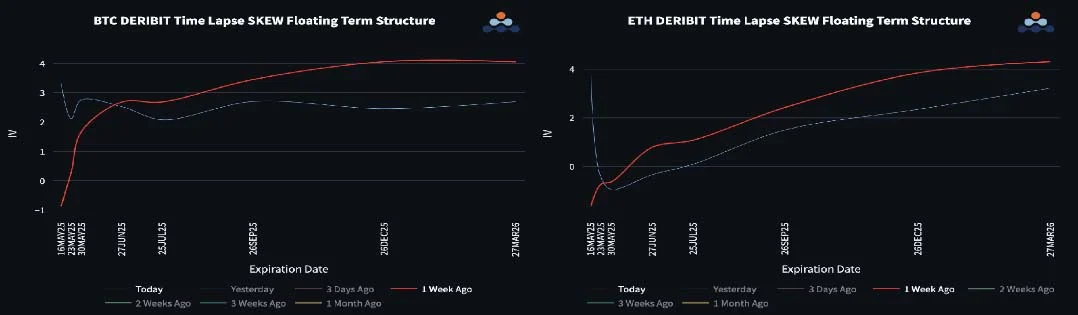
Bitcoin volatility term structure flattens, call option premium reappears

As the market rebounded, the skew curve flattened and call option premiums recovered.

Bitcoin’s volatility skew remains around 2-3 volatility points across the term structure, indicating that there is a bullish flow of funds betting on rising prices, but the implied volatility level remains relatively low.

The volatility skew of Ethereum options has shifted downward, showing a mild bearish trend overall (except for the short-term contract side). If Ethereum can hold on to its recent gains and effectively break through the $2,800 mark, the market may see a resurgence of sustained buying of call options. At this stage, investors remain cautious.

In the long run, Ethereum still has a gap to make up compared to Bitcoin.

Bitcoin stabilizes with triple positive support, while Ethereum volatility surges and takes over market dominance

Front-end volatility spreads widen dramatically

ETH/BTC has surged 33% over the past week and is now testing the critical downtrend resistance at 0.025. With Ethereum outperforming in realized volatility, its short volatility premium has surged to 35 volatility points.

Meanwhile, its long-end volatility spread remains around 15 volatility points, indicating little reaction, a phenomenon that supports the view that long VEGA (volatility exposure) may be suitable for selling at current levels.

Despite the sharp moves in Ethereum, the volatility skew for short-dated options contracts tilted further toward put premiums, suggesting that the options market has not yet fully recognized the rally.

Bitcoin stabilizes with triple positive support, while Ethereum volatility surges and takes over market dominance

Disclaimer: The articles reposted on this site are sourced from public platforms and are provided for informational purposes only. They do not necessarily reflect the views of MEXC. All rights remain with the original authors. If you believe any content infringes on third-party rights, please contact [email protected] for removal. MEXC makes no guarantees regarding the accuracy, completeness, or timeliness of the content and is not responsible for any actions taken based on the information provided. The content does not constitute financial, legal, or other professional advice, nor should it be considered a recommendation or endorsement by MEXC.

You May Also Like

Over 60% of crypto press releases linked to high-risk or scam projects: Report

Over 60% of crypto press releases linked to high-risk or scam projects: Report

A data analysis shows crypto press release wires are dominated by scam-linked projects, hype-driven content and low-impact announcements, raising concerns about
Share
Crypto.news2026/02/04 22:02
ArtGis Finance Partners with MetaXR to Expand its DeFi Offerings in the Metaverse

ArtGis Finance Partners with MetaXR to Expand its DeFi Offerings in the Metaverse

By using this collaboration, ArtGis utilizes MetaXR’s infrastructure to widen access to its assets and enable its customers to interact with the metaverse.
Share
Blockchainreporter2025/09/18 00:07
Crucial US Stock Market Update: What Wednesday’s Mixed Close Reveals

Crucial US Stock Market Update: What Wednesday’s Mixed Close Reveals

BitcoinWorld Crucial US Stock Market Update: What Wednesday’s Mixed Close Reveals The financial world often keeps us on our toes, and Wednesday was no exception. Investors watched closely as the US stock market concluded the day with a mixed performance across its major indexes. This snapshot offers a crucial glimpse into current investor sentiment and economic undercurrents, prompting many to ask: what exactly happened? Understanding the Latest US Stock Market Movements On Wednesday, the closing bell brought a varied picture for the US stock market. While some indexes celebrated gains, others registered slight declines, creating a truly mixed bag for investors. The Dow Jones Industrial Average showed resilience, climbing by a notable 0.57%. This positive movement suggests strength in some of the larger, more established companies. Conversely, the S&P 500, a broader benchmark often seen as a barometer for the overall market, experienced a modest dip of 0.1%. The technology-heavy Nasdaq Composite also saw a slight retreat, sliding by 0.33%. This particular index often reflects investor sentiment towards growth stocks and the tech sector. These divergent outcomes highlight the complex dynamics currently at play within the American economy. It’s not simply a matter of “up” or “down” for the entire US stock market; rather, it’s a nuanced landscape where different sectors and company types are responding to unique pressures and opportunities. Why Did the US Stock Market See Mixed Results? When the US stock market delivers a mixed performance, it often points to a tug-of-war between various economic factors. Several elements could have contributed to Wednesday’s varied closings. For instance, positive corporate earnings reports from certain industries might have bolstered the Dow. At the same time, concerns over inflation, interest rate policies by the Federal Reserve, or even global economic uncertainties could have pressured growth stocks, affecting the S&P 500 and Nasdaq. Key considerations often include: Economic Data: Recent reports on employment, manufacturing, or consumer spending can sway market sentiment. Corporate Announcements: Strong or weak earnings forecasts from influential companies can significantly impact their respective sectors. Interest Rate Expectations: The prospect of higher or lower interest rates directly influences borrowing costs for businesses and consumer spending, affecting future profitability. Geopolitical Events: Global tensions or trade policies can introduce uncertainty, causing investors to become more cautious. Understanding these underlying drivers is crucial for anyone trying to make sense of daily market fluctuations in the US stock market. Navigating Volatility in the US Stock Market A mixed close, while not a dramatic downturn, serves as a reminder that market volatility is a constant companion for investors. For those involved in the US stock market, particularly individuals managing their portfolios, these days underscore the importance of a well-thought-out strategy. It’s important not to react impulsively to daily movements. Instead, consider these actionable insights: Diversification: Spreading investments across different sectors and asset classes can help mitigate risk when one area underperforms. Long-Term Perspective: Focusing on long-term financial goals rather than short-term gains can help weather daily market swings. Stay Informed: Keeping abreast of economic news and company fundamentals provides context for market behavior. Consult Experts: Financial advisors can offer personalized guidance based on individual risk tolerance and objectives. Even small movements in major indexes can signal shifts that require attention, guiding future investment decisions within the dynamic US stock market. What’s Next for the US Stock Market? Looking ahead, investors will be keenly watching for further economic indicators and corporate announcements to gauge the direction of the US stock market. Upcoming inflation data, statements from the Federal Reserve, and quarterly earnings reports will likely provide more clarity. The interplay of these factors will continue to shape investor confidence and, consequently, the performance of the Dow, S&P 500, and Nasdaq. Remaining informed and adaptive will be key to understanding the market’s trajectory. Conclusion: Wednesday’s mixed close in the US stock market highlights the intricate balance of forces influencing financial markets. While the Dow showed strength, the S&P 500 and Nasdaq experienced slight declines, reflecting a nuanced economic landscape. This reminds us that understanding the ‘why’ behind these movements is as important as the movements themselves. As always, a thoughtful, informed approach remains the best strategy for navigating the complexities of the market. Frequently Asked Questions (FAQs) Q1: What does a “mixed close” mean for the US stock market? A1: A mixed close indicates that while some major stock indexes advanced, others declined. It suggests that different sectors or types of companies within the US stock market are experiencing varying influences, rather than a uniform market movement. Q2: Which major indexes were affected on Wednesday? A2: On Wednesday, the Dow Jones Industrial Average gained 0.57%, while the S&P 500 edged down 0.1%, and the Nasdaq Composite slid 0.33%, illustrating the mixed performance across the US stock market. Q3: What factors contribute to a mixed stock market performance? A3: Mixed performances in the US stock market can be influenced by various factors, including specific corporate earnings, economic data releases, shifts in interest rate expectations, and broader geopolitical events that affect different market segments uniquely. Q4: How should investors react to mixed market signals? A4: Investors are generally advised to maintain a long-term perspective, diversify their portfolios, stay informed about economic news, and avoid impulsive decisions. Consulting a financial advisor can also provide personalized guidance for navigating the US stock market. Q5: What indicators should investors watch for future US stock market trends? A5: Key indicators to watch include upcoming inflation reports, statements from the Federal Reserve regarding monetary policy, and quarterly corporate earnings reports. These will offer insights into the future direction of the US stock market. Did you find this analysis of the US stock market helpful? Share this article with your network on social media to help others understand the nuances of current financial trends! To learn more about the latest stock market trends, explore our article on key developments shaping the US stock market‘s future performance. This post Crucial US Stock Market Update: What Wednesday’s Mixed Close Reveals first appeared on BitcoinWorld.
Share
Coinstats2025/09/18 05:30