

54,470,000 LINK Bought at $16: Major Support Zone Forms
Recent data shows that Chainlink (LINK) has established strong buyer interest around the $16 level. On October 19, more than 54.47 million LINK were acquired, according to a cost basis heatmap shared by Ali Martinez.
At press time, LINK was trading at $18, with a 24-hour decline of 5% and a weekly loss of 3%. Daily trading volume stands at $1.05 billion.
$16 Identified as Heavy Accumulation Range
The cost basis heatmap highlights a dense concentration of wallet activity at $16. This level now marks a key reference zone on the chart. The visual shows a strong horizontal cluster, which reflects a high number of tokens changing hands in that range.
The accumulation suggests market participants see value at this level. A large volume of tokens held here may reduce selling pressure, especially if prices return to that zone. Ali Martinez described the area as a “strong support zone,” based on the size of the holdings.
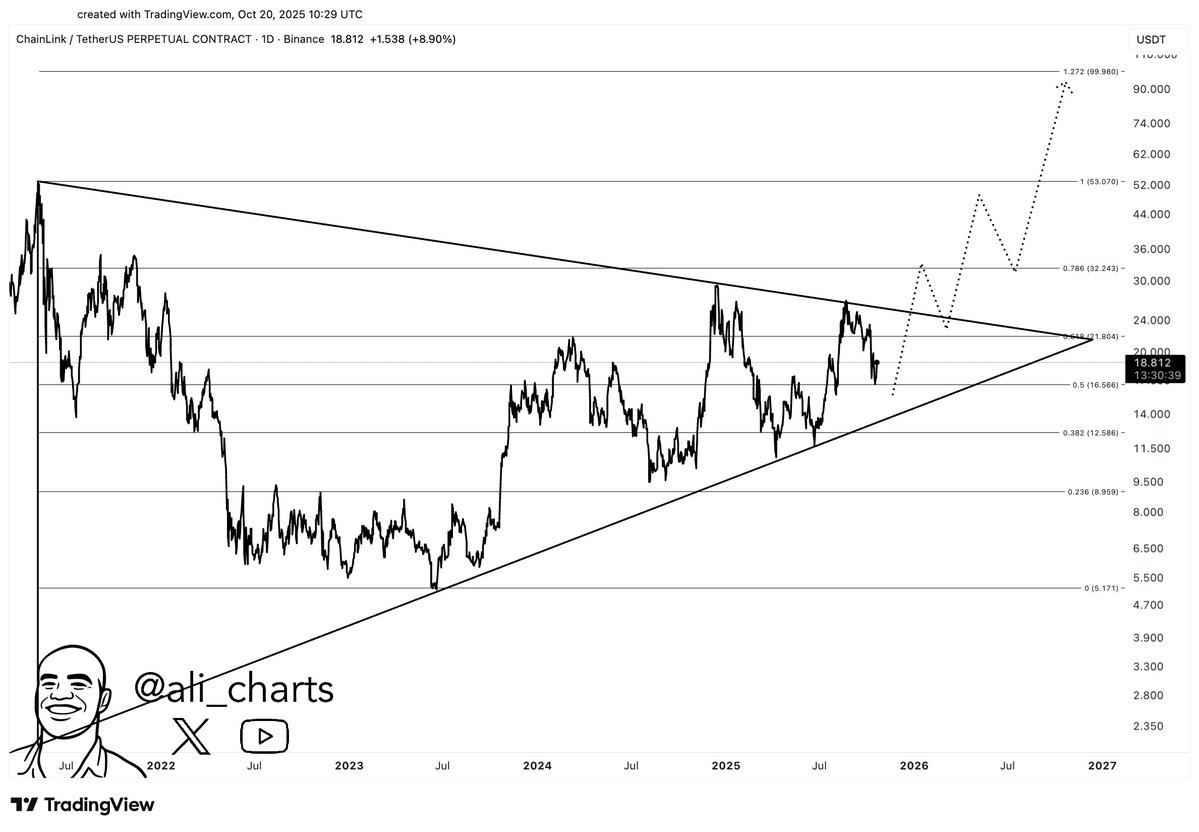
A separate chart from Ali shows a long-term triangle pattern with price squeezing between rising and falling trendlines. LINK is currently positioned around the middle of the formation.
The analyst noted:
Fibonacci projections on the chart show possible continuation levels at $32, $53, $74, and $99, if the price breaks out and holds above $25.
 Source: Ali Martinez/X
Historical Price Action and Market Response
Past market behavior shows how LINK responded to major downturns. In March 2020, during the COVID-19 crash, LINK dropped 80% in one day. Over the next 15 months, it gained more than 3,700%, reaching above $50. This data was shared by Michaël van de Poppe, who noted how sharp declines can become recovery zones.
After peaking in 2021, LINK trended lower and found a base between $5 and $8 by late 2022. Since then, the price has remained mostly stable, with recent moves pushing it back near $18.
On-Chain Activity Supports Local Strength
Recent on-chain data from Santiment adds another view. When average 30-day returns for LINK holders fall below -5%, price has often recovered shortly after. The firm noted this level was reached again on Friday, suggesting renewed accumulation.
Earlier this month, wallets holding between 100,000 and 1,000,000 LINK added 1.38 million tokens during a short pullback. The ongoing interest from larger holders adds weight to the current support zone.
The post 54,470,000 LINK Bought at $16: Major Support Zone Forms appeared first on CryptoPotato.
You May Also Like

Trump Cancels Tech, AI Trade Negotiations With The UK

Wormhole Unleashes W 2.0 Tokenomics for a Connected Blockchain Future
