Bitcoin recently climbed back above $107,000, after a brief pullback triggered by geopolitical tensions. The rebound has put majority of investors in the green, but recent data suggests little appetite for selling According to a July 1 Glassnode report, Bitcoin…Bitcoin recently climbed back above $107,000, after a brief pullback triggered by geopolitical tensions. The rebound has put majority of investors in the green, but recent data suggests little appetite for selling According to a July 1 Glassnode report, Bitcoin…

Bitcoin investors sit on $1.2 trillion in profits as HODLing dominates: Glassnode

2 min read

Bitcoin recently climbed back above $107,000, after a brief pullback triggered by geopolitical tensions. The rebound has put majority of investors in the green, but recent data suggests little appetite for selling

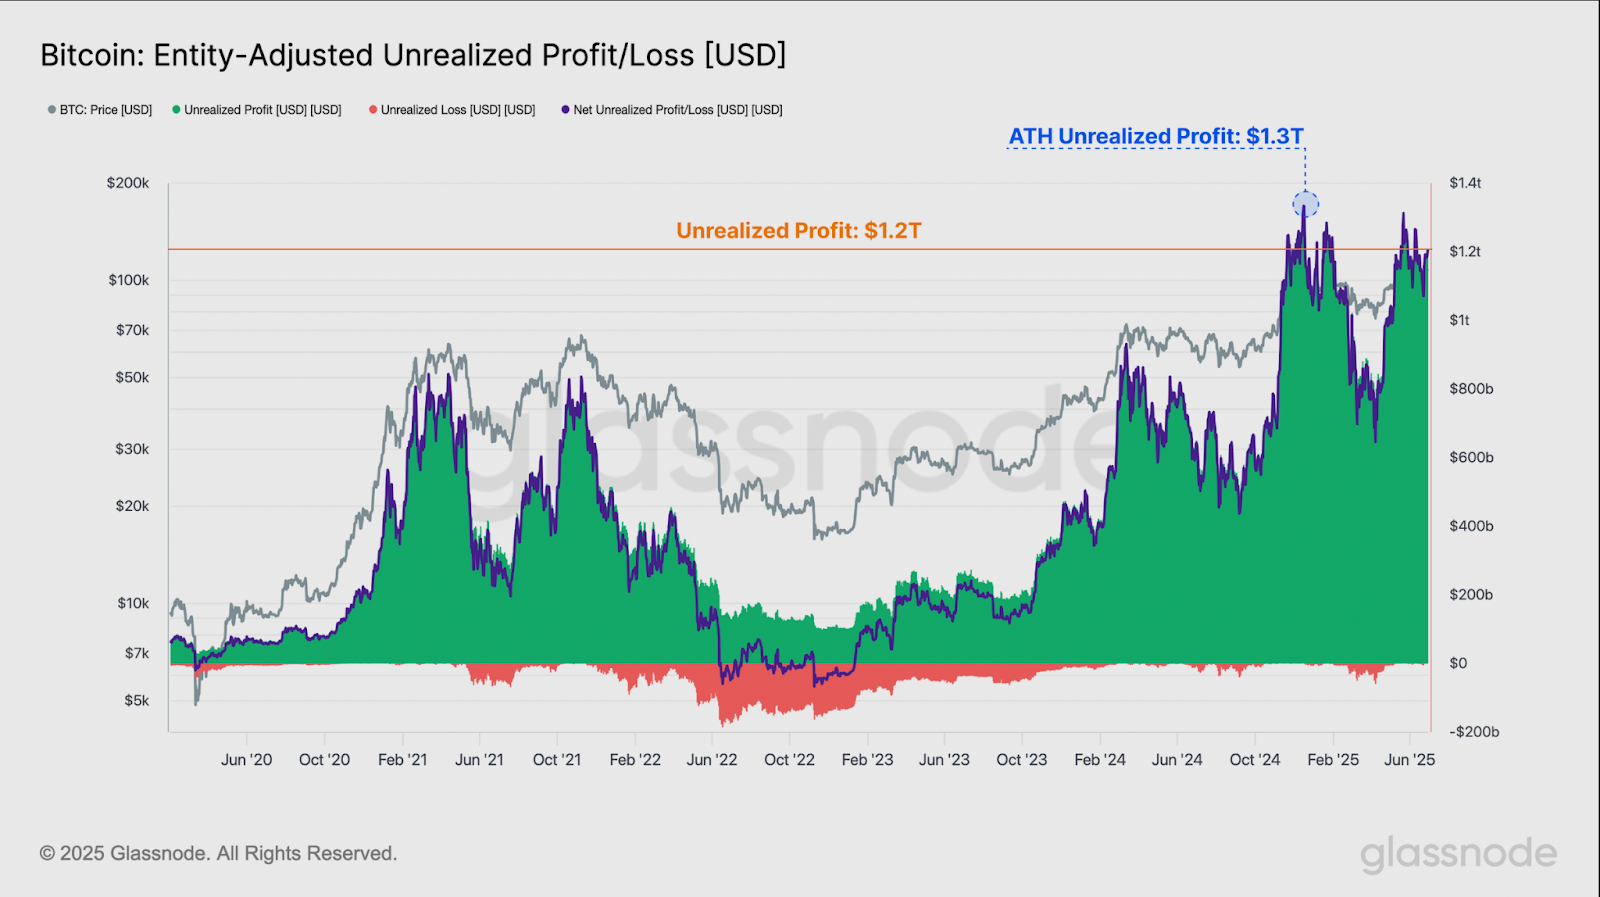
According to a July 1 Glassnode report, Bitcoin (BTC) investors are sitting on $1.2 trillion in unrealized profits. This figure comes from the gap between Bitcoin’s $2.1 trillion market cap and its $955 billion realized cap, a metric that values each coin at the last time it moved. 

The trend is largely driven by long-term holders, who now control a record 14.7 million BTC, reinforcing the idea that most investors are simply not interested in selling at current prices. Daily profit-taking among investors has also cooled to under $900 million, significantly below the $2.8 billion and $3.2 billion levels seen during previous peaks. 

Bitcoin investors sit on $1.2 trillion in profits as HODLing dominates: Glassnode - 1

Despite last weekend’s drop from $106K to $99K during the Israel-Iran tensions, positive sentiment did not shake. Bitcoin bounced off the short-term holder cost basis of $98.3K, a key support level that often signals broader market direction. The quick recovery held up the positive momentum, keeping most investors in profit.

On-chain records also support the HODLing narrative. The Liveliness metric, which compares spending to holding activity, has continued to decline, a sign that more assets are being held than moved. Similarly, the Sell-Side Risk Ratio has dropped off, showing that realized profit and loss-taking is minimal despite the high prices.

Meanwhile, stablecoin data paints a picture of a balanced market. Buying power looks steady, with no major inflows or signs of panic. Glassnode’s analysis shows that traders view the current price range as fair value, with little urgency to chase higher or dump holdings.

Institutional interest also remains strong. U.S.-listed spot Bitcoin ETFs have continued to attract consistent inflows, with a recent seven-day average of $298 million. The increasing demand adds buying pressure and acts as a tailwind for BTC’s growing $2 trillion market cap.

At the time of writing, BTC is trading just above $107,600, showing a modest uptick over the past 24 hours.

Disclaimer: The articles reposted on this site are sourced from public platforms and are provided for informational purposes only. They do not necessarily reflect the views of MEXC. All rights remain with the original authors. If you believe any content infringes on third-party rights, please contact [email protected] for removal. MEXC makes no guarantees regarding the accuracy, completeness, or timeliness of the content and is not responsible for any actions taken based on the information provided. The content does not constitute financial, legal, or other professional advice, nor should it be considered a recommendation or endorsement by MEXC.

You May Also Like

Microsoft Corp. $MSFT blue box area offers a buying opportunity

Microsoft Corp. $MSFT blue box area offers a buying opportunity

The post Microsoft Corp. $MSFT blue box area offers a buying opportunity appeared on BitcoinEthereumNews.com. In today’s article, we’ll examine the recent performance of Microsoft Corp. ($MSFT) through the lens of Elliott Wave Theory. We’ll review how the rally from the April 07, 2025 low unfolded as a 5-wave impulse followed by a 3-swing correction (ABC) and discuss our forecast for the next move. Let’s dive into the structure and expectations for this stock. Five wave impulse structure + ABC + WXY correction $MSFT 8H Elliott Wave chart 9.04.2025 In the 8-hour Elliott Wave count from Sep 04, 2025, we saw that $MSFT completed a 5-wave impulsive cycle at red III. As expected, this initial wave prompted a pullback. We anticipated this pullback to unfold in 3 swings and find buyers in the equal legs area between $497.02 and $471.06 This setup aligns with a typical Elliott Wave correction pattern (ABC), in which the market pauses briefly before resuming its primary trend. $MSFT 8H Elliott Wave chart 7.14.2025 The update, 10 days later, shows the stock finding support from the equal legs area as predicted allowing traders to get risk free. The stock is expected to bounce towards 525 – 532 before deciding if the bounce is a connector or the next leg higher. A break into new ATHs will confirm the latter and can see it trade higher towards 570 – 593 area. Until then, traders should get risk free and protect their capital in case of a WXY double correction. Conclusion In conclusion, our Elliott Wave analysis of Microsoft Corp. ($MSFT) suggested that it remains supported against April 07, 2025 lows and bounce from the blue box area. In the meantime, keep an eye out for any corrective pullbacks that may offer entry opportunities. By applying Elliott Wave Theory, traders can better anticipate the structure of upcoming moves and enhance risk management in volatile markets. Source: https://www.fxstreet.com/news/microsoft-corp-msft-blue-box-area-offers-a-buying-opportunity-202509171323
Share
BitcoinEthereumNews2025/09/18 03:50
Marathon Digital BTC Transfers Highlight Miner Stress

Marathon Digital BTC Transfers Highlight Miner Stress

The post Marathon Digital BTC Transfers Highlight Miner Stress appeared on BitcoinEthereumNews.com. In a tense week for crypto markets, marathon digital has drawn
Share
BitcoinEthereumNews2026/02/06 15:16
Fintech in a Fragmented World: Building Financial Products Across Geopolitical Lines

Fintech in a Fragmented World: Building Financial Products Across Geopolitical Lines

For most of the last ten years, the fintech growth story was one without borders. Startups made digital wallets, payment platforms, lending systems, and trading
Share
Globalfintechseries2026/02/06 15:17