

ASTER Prints New All-Time Low: Will Buybacks Save the Token?
ASTER ASTER $0.63 24h volatility: 12.8% Market cap: $1.54 B Vol. 24h: $296.56 M hit a fresh all-time low after dropping more than 12% in the past 24 hours.
The token fell to $0.55 at the low before rebounding slightly to trade near $0.684 at the time of writing, as per the daily chart below. The selloff occurred alongside the DEX’s public confirmation that buybacks are now live.
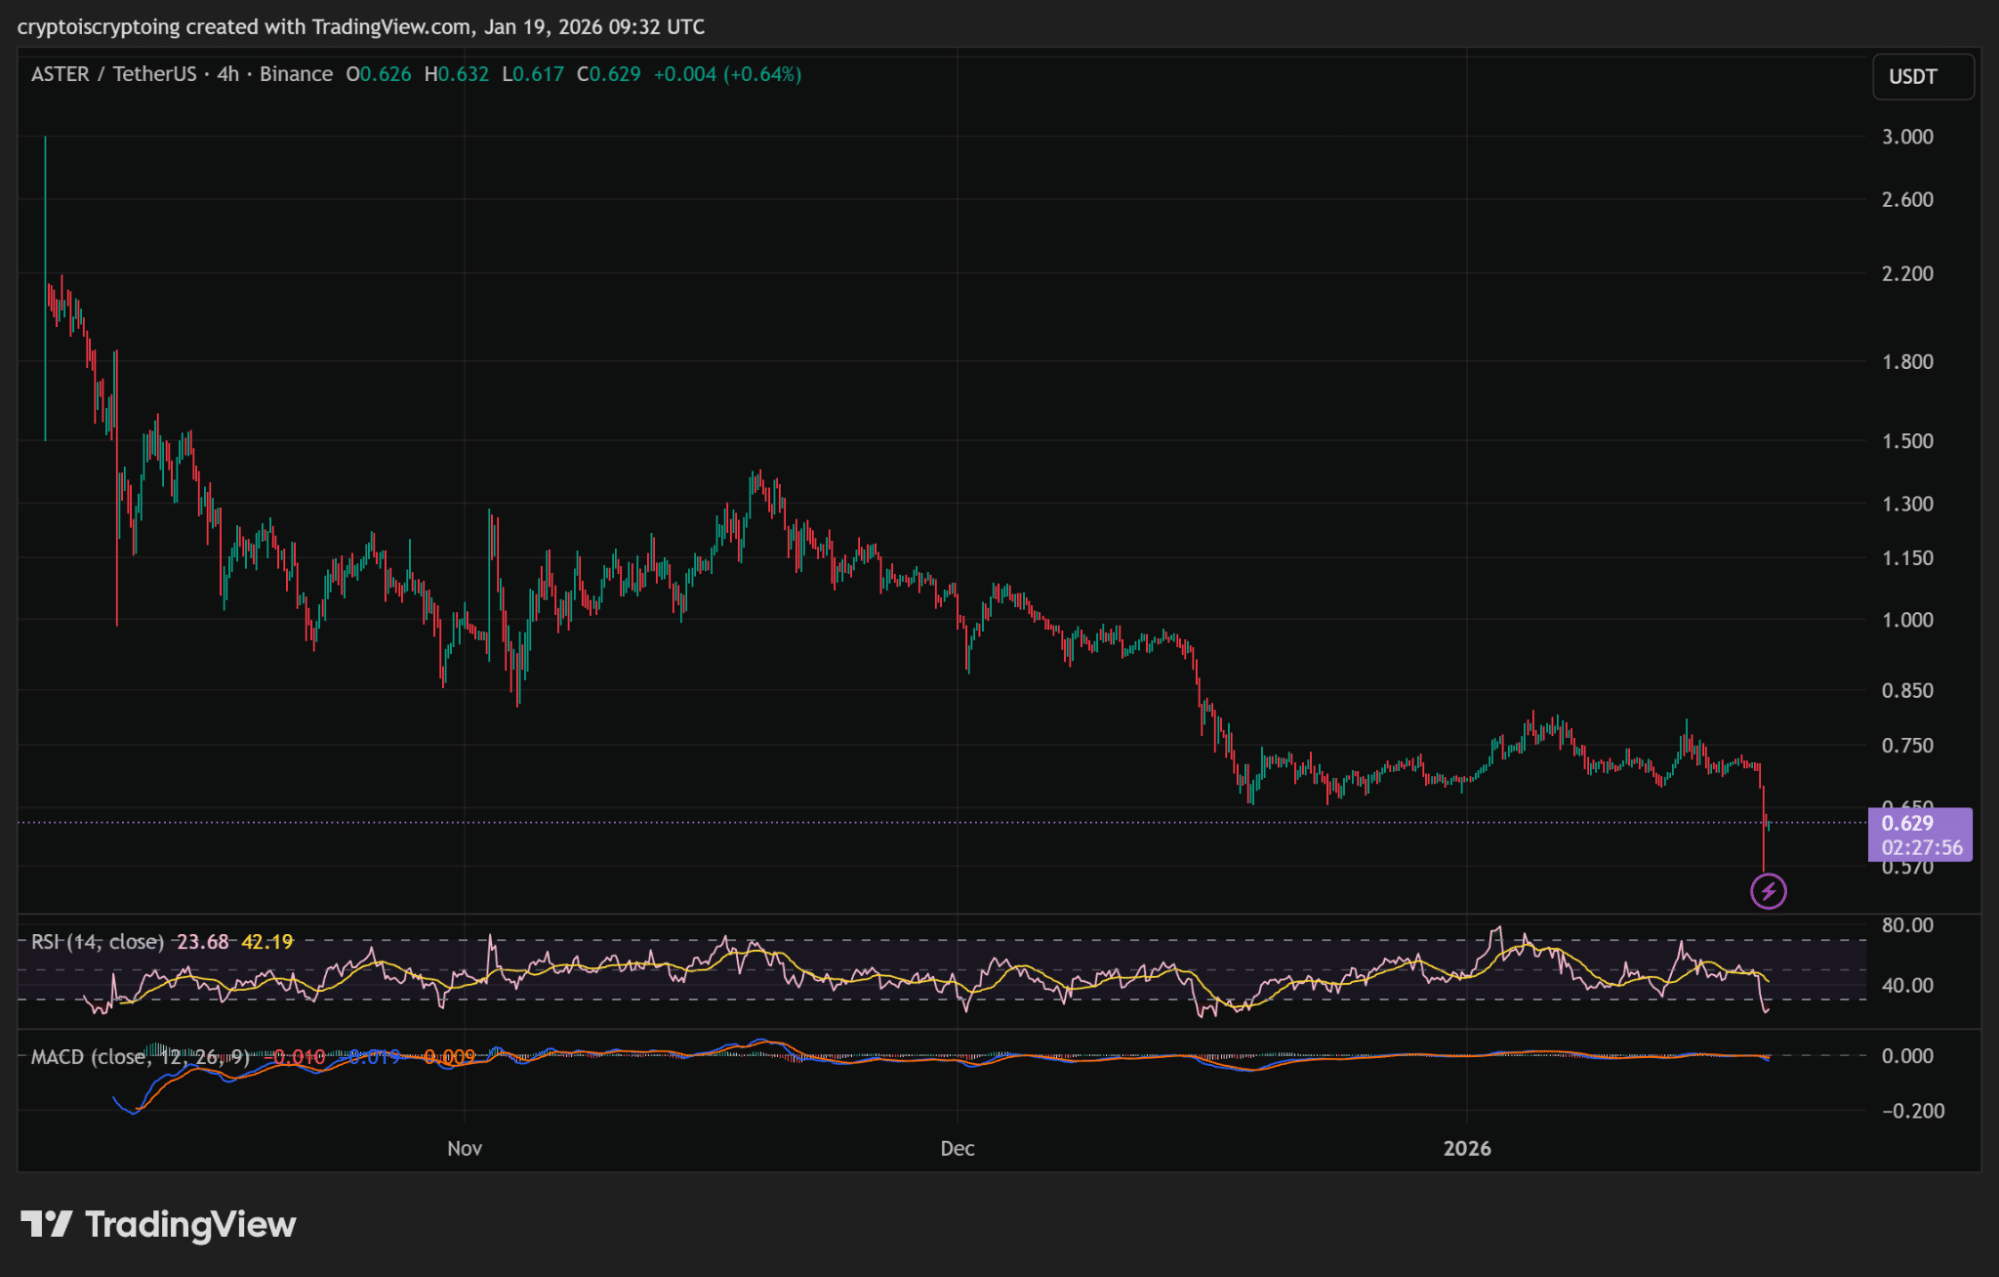
ASTER hits new all-time low. | Source: TradingView
Aster DEX announced that it has begun deploying its Strategic Buyback Reserve, allocating between 20% and 40% of daily platform fees toward automatic ASTER repurchases.
The buybacks are executed on-chain from a designated reserve wallet and adjust dynamically based on market conditions.
Buybacks Meet a Thin Market
Price action remained bearish despite the buyback announcement, with the token printing new lows even as the program went live.
It is important to note that protocol-driven buybacks can slow dilution, but they do not remove sellers.
In ASTER’s case, the repurchase flow appears small relative to available liquidity. Lighter’s LIT token rallied close to 20% after announcing a similar buyback structure. That move proved short-lived as LIT later sold off sharply.
Volume Leadership Is Slipping
Data from crypto data platform CryptoRank shows that after Lighter’s airdrop, its weekly perps volume dropped nearly threefold from peak levels. ASTER continues to post strong numbers but faces increasing competition.
Over the past seven days, DEX Hyperliquid HYPE $24.12 24h volatility: 7.0% Market cap: $5.75 B Vol. 24h: $220.79 M processed roughly $40.7 billion in volume, ahead of ASTER at $31.7 billion and Lighter at $25.3 billion.
The gap widens further in open interest. Hyperliquid holds about $9.57 billion in 24-hour open interest, while all other platforms combined sit near $7.34 billion.
It is clear that even with active users, tokens tied to smaller exchanges face weaker bid support when liquidity migrates. Buybacks can support structure over time, but they do not guarantee reversals.
Bitcoin Hyper Attracts $30.8M Amid Growing Demand
As ASTER continues to trade under pressure, investors are looking for new promising crypto projects like Bitcoin Hyper (HYPER). The project is currently running a public presale that has already raised around $30.8 million at the time of writing.
Bitcoin Hyper is built as a Layer 2 network to improve Bitcoin’s BTC $93 178 24h volatility: 2.0% Market cap: $1.86 T Vol. 24h: $41.68 B performance limits. It targets slower transaction times, higher fees, and the lack of native smart contract support on the base chain.
Transactions are first processed on the Layer 2 network, allowing faster execution and lower costs. They are then settled back onto the Bitcoin network for final confirmation.
Tokenomics of Bitcoin Hyper
-
- Current Price: $0.013605
- Amount Raised So Far: $30.8M
- Staking APY: 38%
The HYPER token is used across the network for transaction fees, staking, and access to certain network functions.
During the current presale phase, HYPER is priced at $0.013605, but the team is set to increase price within a few hours. If you’re interested in joining the presale, feel free to read our Bitcoin Hyper price prediction guide.
nextThe post ASTER Prints New All-Time Low: Will Buybacks Save the Token? appeared first on Coinspeaker.
You May Also Like

Microsoft Corp. $MSFT blue box area offers a buying opportunity

Marathon Digital BTC Transfers Highlight Miner Stress
