PANews reviewed Base’s recent data and compared it with Solana to see whether Base’s rise is an enemy at the gate or another “crying wolf”?PANews reviewed Base’s recent data and compared it with Solana to see whether Base’s rise is an enemy at the gate or another “crying wolf”?

Behind the war of words between Base: Net capital inflow in the past three months exceeded US$2.5 billion, and TVL exceeded US$14.2 billion, surpassing Solana

2025/01/13 15:16
8 min read

Author: Frank, PANews

Many public chains have always liked to label their competitors as Solana, but it seems that no one can really threaten Solana. However, recently Solana's co-founder Toly seems willing to debate with Base's co-founder. At the same time, in recent times, Base's ecological data in various aspects has experienced explosive growth. Not only are many indicators in the leading position in the L2 ranks, but TVL, capital inflow and other data have even surpassed Solana.

It seems that Base is the biggest potential rival in Solana’s mind? PANews reviewed Base’s recent data and compared it with Solana to see if Base’s rise is an enemy at the gate or another “crying wolf”?

The two co-founders are engaged in a heated argument

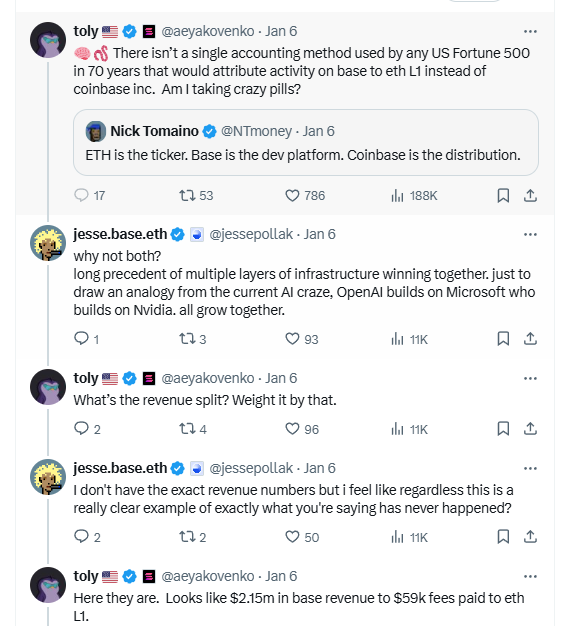
On January 6, Solana co-founder Toly commented on social media that the development of Base did not bring real growth to the Ethereum ecosystem, but Coinbase was absorbing the Ethereum ecosystem through Base. In response to this statement, Base founder Jesse responded on social media, saying that Base and Ethereum are not in a zero-sum competition. Base, like other L2s, is developing within the overall route of Ethereum. With the development of Base, Ethereum is also growing stronger.

Toly then used an analogy, just like the competition between Google and Microsoft, both have contributed to Linux, but in terms of value capture, this is separate. Therefore, no Fortune 500 company in the United States uses a single accounting method to attribute Base's activities to Ethereum, but all are accounted for in Coinbase. And the $2.15 million in revenue generated by Base only paid $59,000 to the Ethereum mainnet.

Behind the war of words between Base: Net capital inflow in the past three months exceeded US$2.5 billion, and TVL exceeded US$14.2 billion, surpassing Solana

It seems that Toly is speaking up for ETH for not capturing value from Base. In fact, the debate may not be about the competition between Base and Ethereum, but about the competition between Solana and Base. Although there are many competitors of Solana in the market, such as Sui, Aptos or Hyperliquid, they all position themselves as competitors of Solana. But judging from the statement of the Solana team, the biggest competitor in their eyes may be Base.

As early as December, Pudgy Penguins announced the issuance of tokens on Solana, and after going online, the Solana network created a record high of 66.9 million transactions per day. During this process, Jesse also publicly said: "I and the Base community will welcome Pudgy Penguin and its token PENGU with open arms." This move was also considered by the community to be an open attempt to steal business from Solana.

In addition, the two have also exchanged views in many discussions. For example, Yuga Labs co-founder Garga.eth complained about the Ethereum ecosystem, which was met with dissatisfaction from Jesse, and Toly added fuel to the fire in the following comment: "Bridge ETH to Solana, I absolutely have no objection to ETH becoming the best currency on Solana." Previously, Jesse has also made many comments comparing Base and Solana.

BaseTVL and capital inflow surpass Solana

Behind the verbal battle between the two, there is an undercurrent of data between Base and Solana. PANews compared several data indicators of Base and Solana in the past year. It can be seen that Base's current overall data is still not as good as Solana, but Base's growth rate is leading Solana in all aspects. If it continues to develop at this rate, Base will likely surpass Solana in terms of data within 1 to 2 years.

PANews selected several commonly used indicators for public chain comparison, such as the number of daily active addresses, number of transactions, TVL, etc. The data selected is the data changes from one year ago to January 10, 2025.

First, let’s look at the changes in Base. One year ago, Base had about 338,000 daily transactions, 61,200 daily active addresses, and a TVL of about $830 million. These figures were equivalent to 1.48%, 11.29%, and 63.85% of Solana at the time.

As of January 10, 2025, Base's data changes are about 11.1 million transactions per day, about 811,200 daily active addresses, and about $14.2 billion in TVL. The current ratios of these three data to Solana are: 17.59%, 12.88%, and 167.06%.

Behind the war of words between Base: Net capital inflow in the past three months exceeded US$2.5 billion, and TVL exceeded US$14.2 billion, surpassing Solana

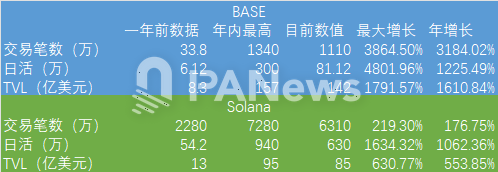
The annual growth rates of these three indicators of Base were 3184.02%, 1225.49%, and 1610.84%, respectively. During the same period, the growth rates of these three indicators of Solana were 176.75%, 1062.36%, and 553.85%, respectively.

It can be seen that after a year of development, Base's transaction volume and daily activity data are still far behind Solana. In terms of TVL, Base has surpassed Solana. Interestingly, Jesse and other key team members shaved their heads on a live broadcast on January 9 to celebrate this data.

Behind the war of words between Base: Net capital inflow in the past three months exceeded US$2.5 billion, and TVL exceeded US$14.2 billion, surpassing Solana

In terms of the growth rate of other data, Base's growth momentum is also more aggressive than Solana. If both parties maintain their current growth efficiency, Base may surpass Solana in terms of the number of transactions in a year.

In addition to these data, a more important indicator is also quietly changing. For most of the past year, Solana has been the network with the most inflow of funds among public chains. Data from the last three months shows that Base has become the public chain with the highest net inflow of $2.5 billion, while Solana ranks second with a net inflow of $900 million.

Behind the war of words between Base: Net capital inflow in the past three months exceeded US$2.5 billion, and TVL exceeded US$14.2 billion, surpassing Solana

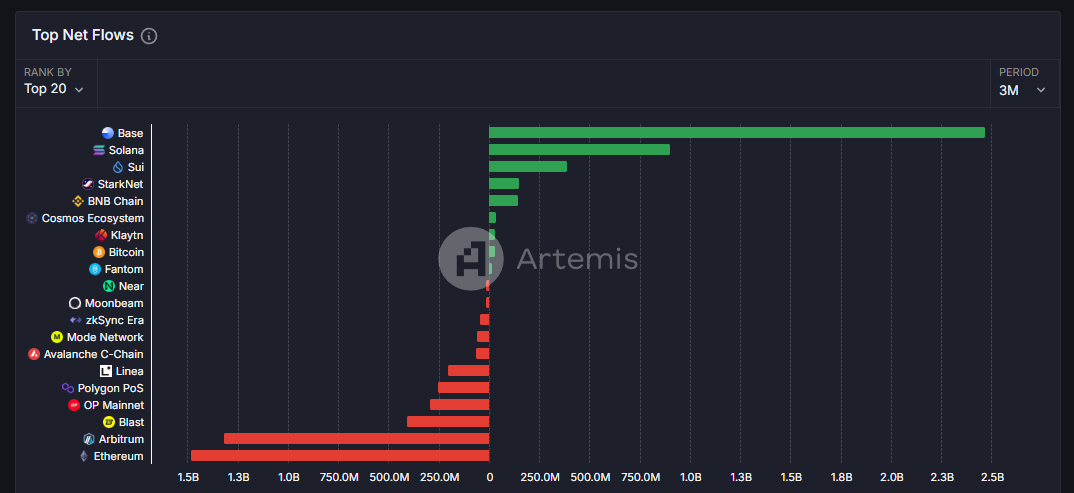
The main changes in this data may have occurred in the near future. The total net inflow in the past year was about US$3.8 billion, which means that the net inflow in the past three months (2.5 billion) accounted for 65% of the whole year.

From the election to Virtuals, Base is getting closer with AI

Judging from the changes in details, this is indeed the case. Base's TVL seems to have seen a significant increase since November 3. However, this is not an isolated case for Base, as Arbitrum also experienced a wave of rapid development during the same period.

Behind the war of words between Base: Net capital inflow in the past three months exceeded US$2.5 billion, and TVL exceeded US$14.2 billion, surpassing Solana

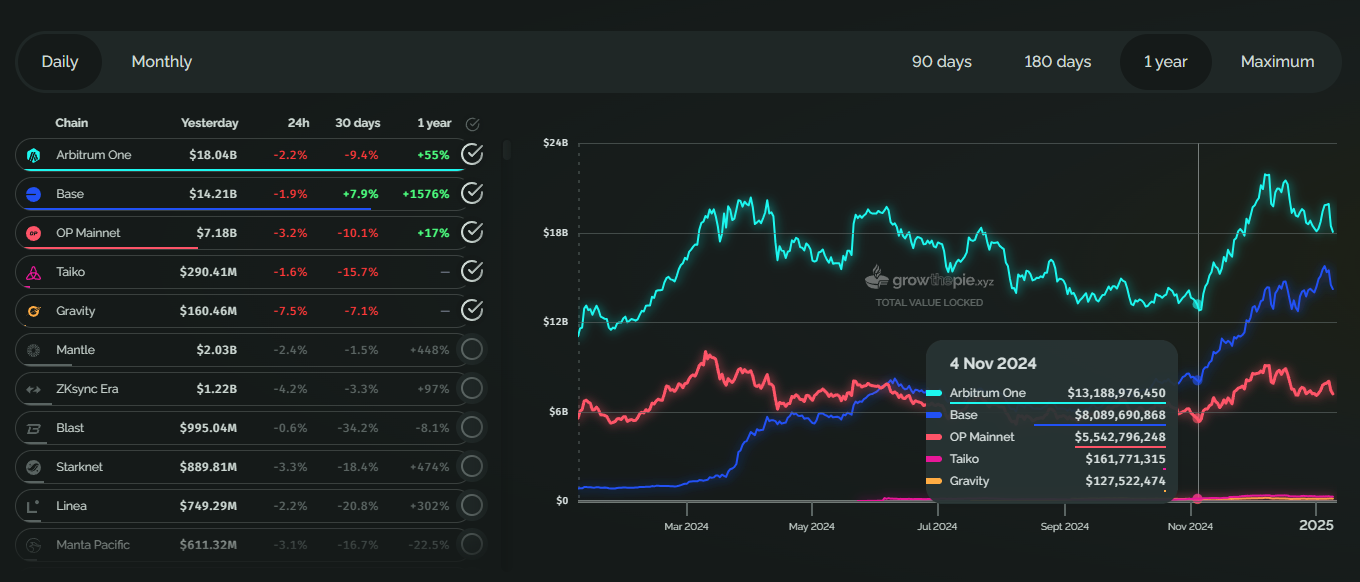
The reason behind this wave of growth may mainly come from the overall market growth brought about by Trump’s election after the US election. In the past month, the main reason why Base has attracted attention is that in the MEME track that has long competed with Solana, a product that can compete with it, Virtuals Protocol, has finally appeared.

After various networks launched Pump.fun imitations, they basically disappeared quietly. However, Virtuals Protocol finally caught the trend of AI Agent and became the most popular AI Agent one-click publishing platform. It gave birth to several AI Agent tokens with market value exceeding 100 million, such as aixbt and GAME.

According to the data from Dexscreener, on January 11, the DEX transaction volume on Solana was $6.88 billion, with 5,324 new trading pools created in 24 hours, while the transaction volume on Base was $2.12 billion, with 2,673 new trading pairs launched in 24 hours. The gap between the two in the MEME field is narrowing step by step, and Base seems to be the only public chain network that can approach Solana's popularity in MEME.

However, Sui had a short-lived boom before, but after the popularity declined, it inevitably fell into silence again. The relative advantage of Base is that its fund sedimentation effect is much stronger than Sui, so as long as the TVL volume does not drop drastically, perhaps this popularity can still be maintained.

By comparing the data, we can find that Base is becoming Solana's strongest competitor, but the problem is that Base has always lacked its own governance token, which makes it difficult to be priced by the market. The lack of public chain tokens also allows Virtuals protocol to obtain more capital spillover effects on the Base public chain. Perhaps in order to solve this problem, on January 4, Base developer Jesse Pollak tweeted that Coinbase is considering providing tokenized COIN stocks to US users of its Base network.

If this goal can be achieved, perhaps the biggest significance is not that there is another important asset in the field of RWA, but that the value brought by the development of Base can finally be more directly reflected in the stock price of Coinbase, and for investors who can only participate in cryptocurrency transactions, it can also be regarded as a disguised way to participate in the governance of Base and enjoy dividends. Judging from the current data performance of Base, the market value converted into tokens should be above 10 billion US dollars. On January 11, the market value of Coinbase was about 64.7 billion US dollars. This market value is placed after BNB and SOL in the cryptocurrency. I wonder if Coinbase's market value can surpass BNB and SOL once the on-chain funds of Base are added.

Disclaimer: The articles reposted on this site are sourced from public platforms and are provided for informational purposes only. They do not necessarily reflect the views of MEXC. All rights remain with the original authors. If you believe any content infringes on third-party rights, please contact [email protected] for removal. MEXC makes no guarantees regarding the accuracy, completeness, or timeliness of the content and is not responsible for any actions taken based on the information provided. The content does not constitute financial, legal, or other professional advice, nor should it be considered a recommendation or endorsement by MEXC.

You May Also Like

Over 60% of crypto press releases linked to high-risk or scam projects: Report

Over 60% of crypto press releases linked to high-risk or scam projects: Report

A data analysis shows crypto press release wires are dominated by scam-linked projects, hype-driven content and low-impact announcements, raising concerns about
Share
Crypto.news2026/02/04 22:02
ArtGis Finance Partners with MetaXR to Expand its DeFi Offerings in the Metaverse

ArtGis Finance Partners with MetaXR to Expand its DeFi Offerings in the Metaverse

By using this collaboration, ArtGis utilizes MetaXR’s infrastructure to widen access to its assets and enable its customers to interact with the metaverse.
Share
Blockchainreporter2025/09/18 00:07
Crucial US Stock Market Update: What Wednesday’s Mixed Close Reveals

Crucial US Stock Market Update: What Wednesday’s Mixed Close Reveals

BitcoinWorld Crucial US Stock Market Update: What Wednesday’s Mixed Close Reveals The financial world often keeps us on our toes, and Wednesday was no exception. Investors watched closely as the US stock market concluded the day with a mixed performance across its major indexes. This snapshot offers a crucial glimpse into current investor sentiment and economic undercurrents, prompting many to ask: what exactly happened? Understanding the Latest US Stock Market Movements On Wednesday, the closing bell brought a varied picture for the US stock market. While some indexes celebrated gains, others registered slight declines, creating a truly mixed bag for investors. The Dow Jones Industrial Average showed resilience, climbing by a notable 0.57%. This positive movement suggests strength in some of the larger, more established companies. Conversely, the S&P 500, a broader benchmark often seen as a barometer for the overall market, experienced a modest dip of 0.1%. The technology-heavy Nasdaq Composite also saw a slight retreat, sliding by 0.33%. This particular index often reflects investor sentiment towards growth stocks and the tech sector. These divergent outcomes highlight the complex dynamics currently at play within the American economy. It’s not simply a matter of “up” or “down” for the entire US stock market; rather, it’s a nuanced landscape where different sectors and company types are responding to unique pressures and opportunities. Why Did the US Stock Market See Mixed Results? When the US stock market delivers a mixed performance, it often points to a tug-of-war between various economic factors. Several elements could have contributed to Wednesday’s varied closings. For instance, positive corporate earnings reports from certain industries might have bolstered the Dow. At the same time, concerns over inflation, interest rate policies by the Federal Reserve, or even global economic uncertainties could have pressured growth stocks, affecting the S&P 500 and Nasdaq. Key considerations often include: Economic Data: Recent reports on employment, manufacturing, or consumer spending can sway market sentiment. Corporate Announcements: Strong or weak earnings forecasts from influential companies can significantly impact their respective sectors. Interest Rate Expectations: The prospect of higher or lower interest rates directly influences borrowing costs for businesses and consumer spending, affecting future profitability. Geopolitical Events: Global tensions or trade policies can introduce uncertainty, causing investors to become more cautious. Understanding these underlying drivers is crucial for anyone trying to make sense of daily market fluctuations in the US stock market. Navigating Volatility in the US Stock Market A mixed close, while not a dramatic downturn, serves as a reminder that market volatility is a constant companion for investors. For those involved in the US stock market, particularly individuals managing their portfolios, these days underscore the importance of a well-thought-out strategy. It’s important not to react impulsively to daily movements. Instead, consider these actionable insights: Diversification: Spreading investments across different sectors and asset classes can help mitigate risk when one area underperforms. Long-Term Perspective: Focusing on long-term financial goals rather than short-term gains can help weather daily market swings. Stay Informed: Keeping abreast of economic news and company fundamentals provides context for market behavior. Consult Experts: Financial advisors can offer personalized guidance based on individual risk tolerance and objectives. Even small movements in major indexes can signal shifts that require attention, guiding future investment decisions within the dynamic US stock market. What’s Next for the US Stock Market? Looking ahead, investors will be keenly watching for further economic indicators and corporate announcements to gauge the direction of the US stock market. Upcoming inflation data, statements from the Federal Reserve, and quarterly earnings reports will likely provide more clarity. The interplay of these factors will continue to shape investor confidence and, consequently, the performance of the Dow, S&P 500, and Nasdaq. Remaining informed and adaptive will be key to understanding the market’s trajectory. Conclusion: Wednesday’s mixed close in the US stock market highlights the intricate balance of forces influencing financial markets. While the Dow showed strength, the S&P 500 and Nasdaq experienced slight declines, reflecting a nuanced economic landscape. This reminds us that understanding the ‘why’ behind these movements is as important as the movements themselves. As always, a thoughtful, informed approach remains the best strategy for navigating the complexities of the market. Frequently Asked Questions (FAQs) Q1: What does a “mixed close” mean for the US stock market? A1: A mixed close indicates that while some major stock indexes advanced, others declined. It suggests that different sectors or types of companies within the US stock market are experiencing varying influences, rather than a uniform market movement. Q2: Which major indexes were affected on Wednesday? A2: On Wednesday, the Dow Jones Industrial Average gained 0.57%, while the S&P 500 edged down 0.1%, and the Nasdaq Composite slid 0.33%, illustrating the mixed performance across the US stock market. Q3: What factors contribute to a mixed stock market performance? A3: Mixed performances in the US stock market can be influenced by various factors, including specific corporate earnings, economic data releases, shifts in interest rate expectations, and broader geopolitical events that affect different market segments uniquely. Q4: How should investors react to mixed market signals? A4: Investors are generally advised to maintain a long-term perspective, diversify their portfolios, stay informed about economic news, and avoid impulsive decisions. Consulting a financial advisor can also provide personalized guidance for navigating the US stock market. Q5: What indicators should investors watch for future US stock market trends? A5: Key indicators to watch include upcoming inflation reports, statements from the Federal Reserve regarding monetary policy, and quarterly corporate earnings reports. These will offer insights into the future direction of the US stock market. Did you find this analysis of the US stock market helpful? Share this article with your network on social media to help others understand the nuances of current financial trends! To learn more about the latest stock market trends, explore our article on key developments shaping the US stock market‘s future performance. This post Crucial US Stock Market Update: What Wednesday’s Mixed Close Reveals first appeared on BitcoinWorld.
Share
Coinstats2025/09/18 05:30