The post Hyperliquid (HYPE) and Jupiter (JUP) Price Rally Today: Why are These Tokens Outperforming? appeared first on Coinpedia Fintech News While the broader The post Hyperliquid (HYPE) and Jupiter (JUP) Price Rally Today: Why are These Tokens Outperforming? appeared first on Coinpedia Fintech News While the broader

Hyperliquid (HYPE) and Jupiter (JUP) Price Rally Today: Why are These Tokens Outperforming?

4 min read
Hyperliquid Momentum Builds as HIP-3 Open Interest Hits $790M—Can HYPE Price Test $50 in February

The post Hyperliquid (HYPE) and Jupiter (JUP) Price Rally Today: Why are These Tokens Outperforming? appeared first on Coinpedia Fintech News

While the broader crypto market remains weighed down by macro uncertainty and defensive positioning, Hyperliquid (HYPE) and Jupiter (JUP) are emerging as clear outliers. Both tokens advanced close to 7%, signaling selective capital rotation into assets where supply dynamics, participation metrics, and price structure are aligning constructively.

Rather than tracking the market lower, HYPE and JUP are attracting attention for very specific reasons that are measurable, visible on-chain, and reflected directly in price behavior.

Hyperliquid Token Supply Update Draws Fresh Market Attention

Hyperliquid’s rally is anchored in a tangible shift in its near-term supply profile. The project recently revised its February token unlock schedule, cutting the amount of HYPE set to enter circulation from roughly 1.2 million tokens to about 140,000, a reduction of nearly 90%. In a market that has grown increasingly sensitive to unlock-driven sell pressure, this change materially alters how traders assess downside risk.

The supply adjustment quickly fed into market behavior. HYPE’s daily trading volume expanded beyond $50 million, a notable increase compared with the sub-$30 million averages observed earlier in the month. This rise in activity suggests that the unlock revision did more than ease fear, it actively encouraged new positioning. Importantly, this demand appeared as the broader market remained fragile, reinforcing the view that HYPE’s move is being driven by asset-specific conviction rather than broad risk appetite.

HYPE Price Holds Bullish Structure After Recent Pullback

HYPE price action continues to reflect accumulation. After breaking out of the falling channel pattern, Hyperliquid token price has managed to stay above the short-term moving averages. The recent pullback from the breakout region has made a long-legged hammer candlestick and a sharp rebound, confirming the bulls dominance.

HYPE price

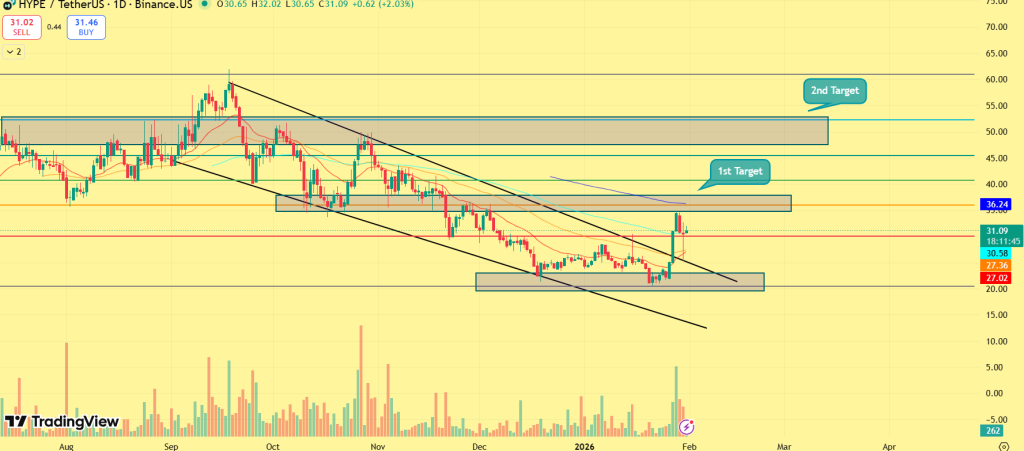
HYPE token is now rotating higher toward the immediate supply cluster of $36-$40, where it faced rejection this week. In case of surpassing the zone, a continuation move toward the next resistance zone of $50 could be seen ahead. A sustained push above the $50 mark could permit the bulls to skyrocket toward the $60 hurdle. On the downside, a clean break below the channel support of $25 would invalidate the bullish structure and shift bias back to consolidation.

JUP Ecosystem Activity Lifts Market Interest

Jupiter’s strength is underpinned by expanding ecosystem engagement rather than speculative excess. The project’s announcement of a 200 million token airdrop initiative has acted as a participation catalyst, drawing increased attention from users and liquidity providers across the Solana ecosystem. Wallet activity and participation metrics show a 15–20% increase over the past week, indicating that the rally is being accompanied by real usage rather than fleeting interest. 

Moreover, social engagement around JUP has also accelerated, reaching levels that place it among the most discussed tokens in the market during the same period. This combination of participation growth and sustained attention has helped JUP maintain bid support even as broader market sentiment remains cautious.

Jupiter (JUP) Maintain Gains as Selling Pressure Fades

Jupiter (JUP) price chart reflects this fundamental momentum clearly. After breaking above a well-defined resistance zone of $0.2000, JUP price pushed higher, rallied over 7% today. For the past few sessions, JUP token has continued to hover between $0.1800-$0.2000 and made a double bottom pattern near the support zone.

JUP price

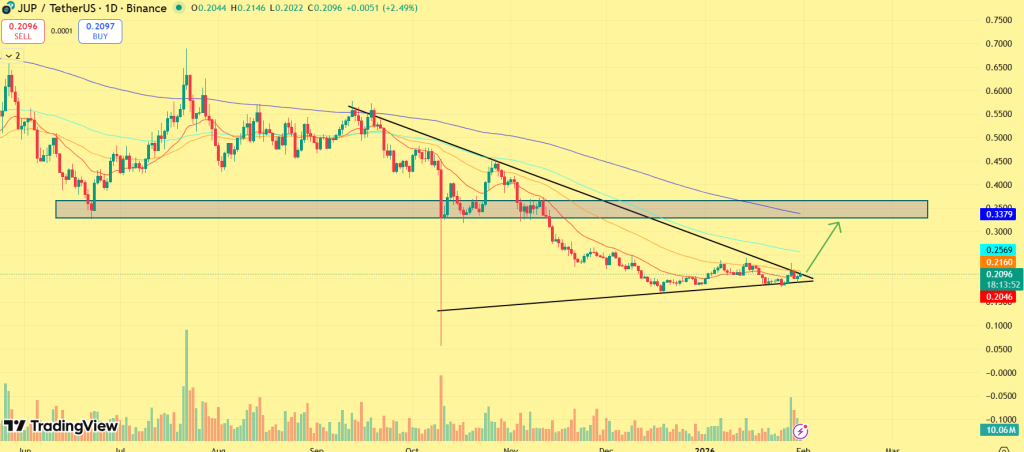
With a fresh ecosystem update, buyers stepped in and the token moved out of the sellers control, resulting in a breakout. At press time, JUP price was trading at $0.2099 and is set for a bullish leg up. If JUP price continues to hold bullish momentum, it may reach the supply zone of $0.3300 in the short term. On the other hand, a slip below $0.1800 would invalidate the bullish thesis.

Market Outlook

With February approaching, HYPE and JUP tokens are positioned as relative-strength players in an otherwise uneven market. With supply easing, ecosystem engagement, these two tokens are demonstrating that measured fundamentals combined with clean structure can still command capital, even when sentiment elsewhere remains fragile.

Disclaimer: The articles reposted on this site are sourced from public platforms and are provided for informational purposes only. They do not necessarily reflect the views of MEXC. All rights remain with the original authors. If you believe any content infringes on third-party rights, please contact [email protected] for removal. MEXC makes no guarantees regarding the accuracy, completeness, or timeliness of the content and is not responsible for any actions taken based on the information provided. The content does not constitute financial, legal, or other professional advice, nor should it be considered a recommendation or endorsement by MEXC.

You May Also Like

Over 60% of crypto press releases linked to high-risk or scam projects: Report

Over 60% of crypto press releases linked to high-risk or scam projects: Report

A data analysis shows crypto press release wires are dominated by scam-linked projects, hype-driven content and low-impact announcements, raising concerns about
Share
Crypto.news2026/02/04 22:02
ArtGis Finance Partners with MetaXR to Expand its DeFi Offerings in the Metaverse

ArtGis Finance Partners with MetaXR to Expand its DeFi Offerings in the Metaverse

By using this collaboration, ArtGis utilizes MetaXR’s infrastructure to widen access to its assets and enable its customers to interact with the metaverse.
Share
Blockchainreporter2025/09/18 00:07
Crucial US Stock Market Update: What Wednesday’s Mixed Close Reveals

Crucial US Stock Market Update: What Wednesday’s Mixed Close Reveals

BitcoinWorld Crucial US Stock Market Update: What Wednesday’s Mixed Close Reveals The financial world often keeps us on our toes, and Wednesday was no exception. Investors watched closely as the US stock market concluded the day with a mixed performance across its major indexes. This snapshot offers a crucial glimpse into current investor sentiment and economic undercurrents, prompting many to ask: what exactly happened? Understanding the Latest US Stock Market Movements On Wednesday, the closing bell brought a varied picture for the US stock market. While some indexes celebrated gains, others registered slight declines, creating a truly mixed bag for investors. The Dow Jones Industrial Average showed resilience, climbing by a notable 0.57%. This positive movement suggests strength in some of the larger, more established companies. Conversely, the S&P 500, a broader benchmark often seen as a barometer for the overall market, experienced a modest dip of 0.1%. The technology-heavy Nasdaq Composite also saw a slight retreat, sliding by 0.33%. This particular index often reflects investor sentiment towards growth stocks and the tech sector. These divergent outcomes highlight the complex dynamics currently at play within the American economy. It’s not simply a matter of “up” or “down” for the entire US stock market; rather, it’s a nuanced landscape where different sectors and company types are responding to unique pressures and opportunities. Why Did the US Stock Market See Mixed Results? When the US stock market delivers a mixed performance, it often points to a tug-of-war between various economic factors. Several elements could have contributed to Wednesday’s varied closings. For instance, positive corporate earnings reports from certain industries might have bolstered the Dow. At the same time, concerns over inflation, interest rate policies by the Federal Reserve, or even global economic uncertainties could have pressured growth stocks, affecting the S&P 500 and Nasdaq. Key considerations often include: Economic Data: Recent reports on employment, manufacturing, or consumer spending can sway market sentiment. Corporate Announcements: Strong or weak earnings forecasts from influential companies can significantly impact their respective sectors. Interest Rate Expectations: The prospect of higher or lower interest rates directly influences borrowing costs for businesses and consumer spending, affecting future profitability. Geopolitical Events: Global tensions or trade policies can introduce uncertainty, causing investors to become more cautious. Understanding these underlying drivers is crucial for anyone trying to make sense of daily market fluctuations in the US stock market. Navigating Volatility in the US Stock Market A mixed close, while not a dramatic downturn, serves as a reminder that market volatility is a constant companion for investors. For those involved in the US stock market, particularly individuals managing their portfolios, these days underscore the importance of a well-thought-out strategy. It’s important not to react impulsively to daily movements. Instead, consider these actionable insights: Diversification: Spreading investments across different sectors and asset classes can help mitigate risk when one area underperforms. Long-Term Perspective: Focusing on long-term financial goals rather than short-term gains can help weather daily market swings. Stay Informed: Keeping abreast of economic news and company fundamentals provides context for market behavior. Consult Experts: Financial advisors can offer personalized guidance based on individual risk tolerance and objectives. Even small movements in major indexes can signal shifts that require attention, guiding future investment decisions within the dynamic US stock market. What’s Next for the US Stock Market? Looking ahead, investors will be keenly watching for further economic indicators and corporate announcements to gauge the direction of the US stock market. Upcoming inflation data, statements from the Federal Reserve, and quarterly earnings reports will likely provide more clarity. The interplay of these factors will continue to shape investor confidence and, consequently, the performance of the Dow, S&P 500, and Nasdaq. Remaining informed and adaptive will be key to understanding the market’s trajectory. Conclusion: Wednesday’s mixed close in the US stock market highlights the intricate balance of forces influencing financial markets. While the Dow showed strength, the S&P 500 and Nasdaq experienced slight declines, reflecting a nuanced economic landscape. This reminds us that understanding the ‘why’ behind these movements is as important as the movements themselves. As always, a thoughtful, informed approach remains the best strategy for navigating the complexities of the market. Frequently Asked Questions (FAQs) Q1: What does a “mixed close” mean for the US stock market? A1: A mixed close indicates that while some major stock indexes advanced, others declined. It suggests that different sectors or types of companies within the US stock market are experiencing varying influences, rather than a uniform market movement. Q2: Which major indexes were affected on Wednesday? A2: On Wednesday, the Dow Jones Industrial Average gained 0.57%, while the S&P 500 edged down 0.1%, and the Nasdaq Composite slid 0.33%, illustrating the mixed performance across the US stock market. Q3: What factors contribute to a mixed stock market performance? A3: Mixed performances in the US stock market can be influenced by various factors, including specific corporate earnings, economic data releases, shifts in interest rate expectations, and broader geopolitical events that affect different market segments uniquely. Q4: How should investors react to mixed market signals? A4: Investors are generally advised to maintain a long-term perspective, diversify their portfolios, stay informed about economic news, and avoid impulsive decisions. Consulting a financial advisor can also provide personalized guidance for navigating the US stock market. Q5: What indicators should investors watch for future US stock market trends? A5: Key indicators to watch include upcoming inflation reports, statements from the Federal Reserve regarding monetary policy, and quarterly corporate earnings reports. These will offer insights into the future direction of the US stock market. Did you find this analysis of the US stock market helpful? Share this article with your network on social media to help others understand the nuances of current financial trends! To learn more about the latest stock market trends, explore our article on key developments shaping the US stock market‘s future performance. This post Crucial US Stock Market Update: What Wednesday’s Mixed Close Reveals first appeared on BitcoinWorld.
Share
Coinstats2025/09/18 05:30