

Cardano (ADA) Price: Whales Dump Millions of Tokens as Bears Take Control
TLDR
- Cardano (ADA) price dropped below $0.28 on Monday after losing over 15% the previous week
- Whales holding between 100,000 and 100 million ADA tokens sold 160 million tokens since Thursday
- RSI indicator shows oversold conditions at around 28, suggesting potential for a short-term bounce
- Bears are targeting the October 21, 2023 low of $0.24 if the downward trend continues
- First resistance level sits at $0.32, with support at $0.27 and strong support at $0.25
Cardano price fell below $0.28 on Monday, extending its correction after a 15% drop the previous week. The decline comes as the broader crypto market faces pressure, with Bitcoin slipping under $75,000.
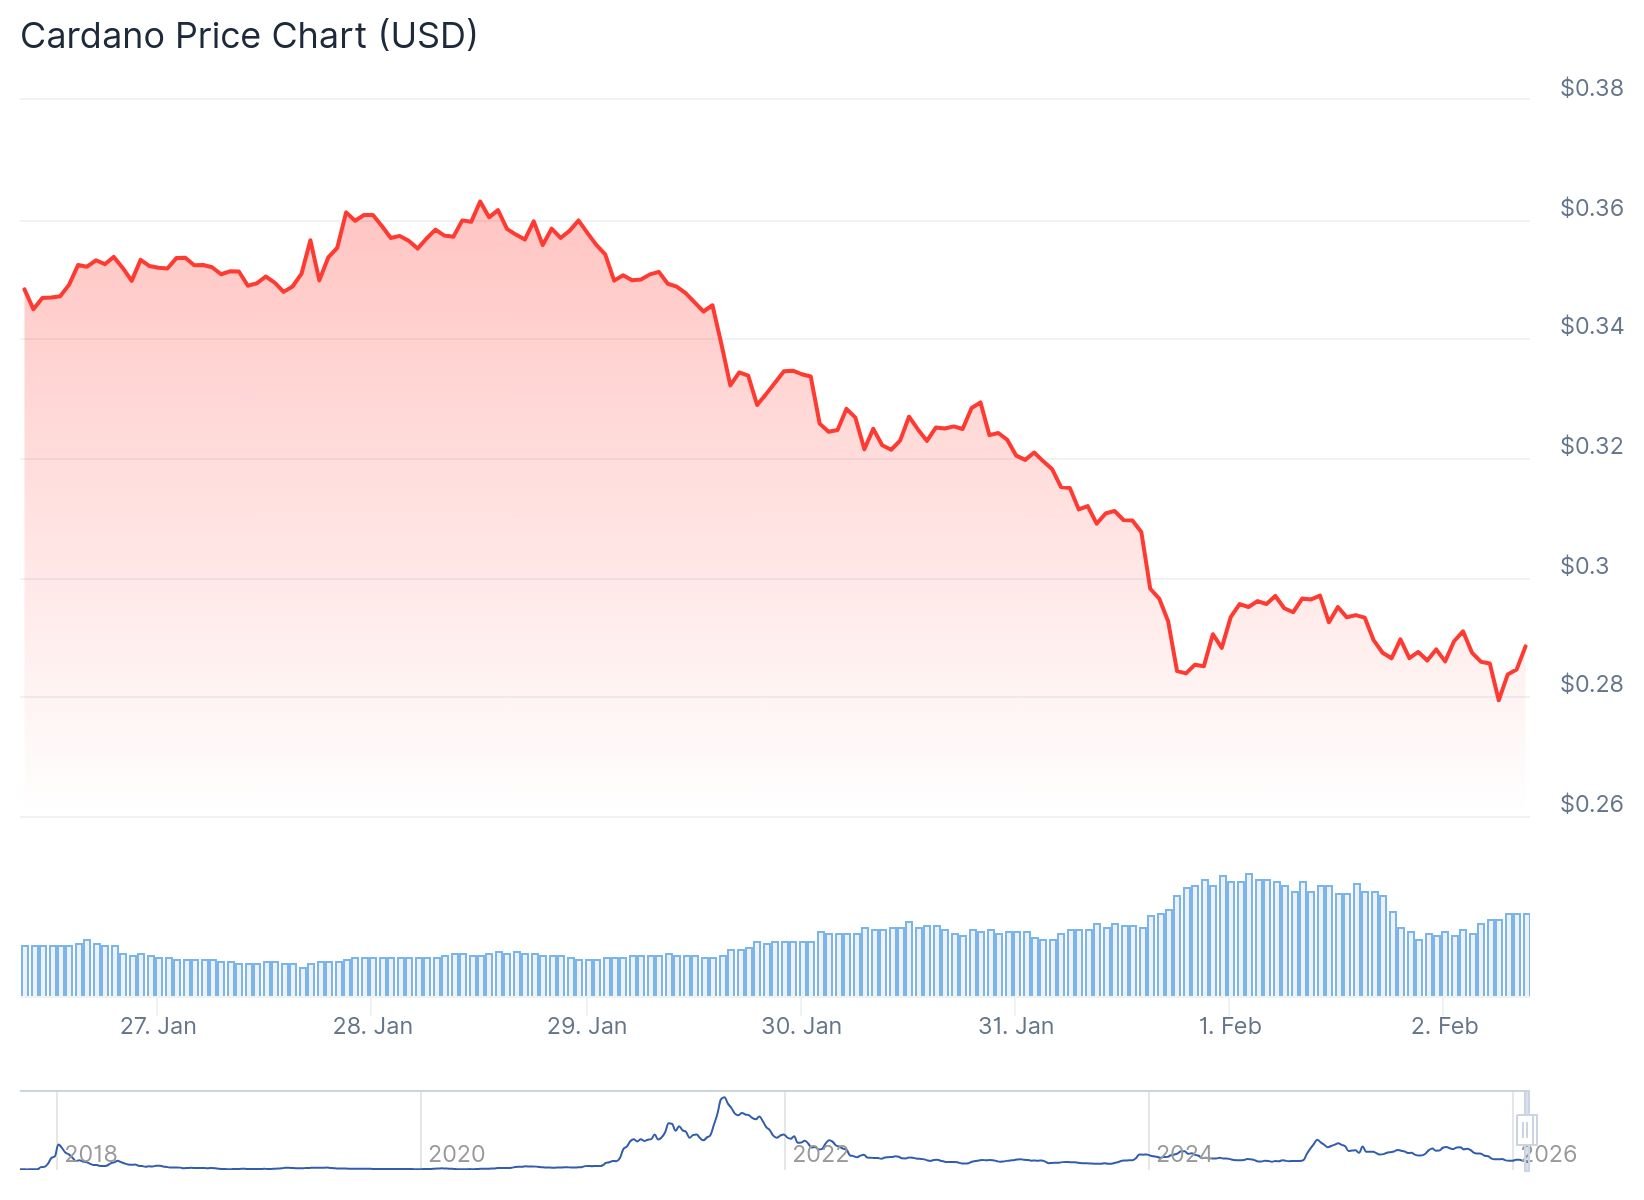 Cardano (ADA) Price
ADA traded around $0.29 at the time of reporting. The token retested the October 10 low of $0.27 on Saturday.
Whale Activity Signals Selling Pressure
Data from Santiment shows large wallet holders are reducing their positions. Whales holding between 100,000 and 1 million ADA tokens decreased their holdings. The same pattern appeared for addresses holding 1 million to 10 million tokens and 10 million to 100 million tokens.
 Source; Santiment
These whale addresses sold a combined 160 million ADA tokens since Thursday. The selling activity from large holders increases downward pressure on the price.
Early January forecasts predicted ADA would trade between $0.40 and $0.45 during this period. The BTCC Research Team projected an average price around $0.43. CoinStats shared similar expectations for the $0.40 to $0.45 range.
Current prices sit well below these projections. ADA trades roughly 35% lower than the forecasted levels.
Technical Indicators Show Oversold Conditions
The Relative Strength Index on the daily chart reads near 28. This level indicates oversold conditions and strong bearish momentum.
The Moving Average Convergence Divergence indicator crossed bearish on January 18. The MACD histogram sits at zero with both the MACD and signal line in negative territory at around -0.02.
Bollinger Bands analysis places ADA near the lower band at $0.29. The middle band sits at $0.36.
Cardano trades below all major moving averages. The 7-day simple moving average stands at $0.33. The 200-day simple moving average reaches $0.62.
If the downward trend continues, bears are targeting $0.24. This level matches the October 21, 2023 low. ADA has not traded at this price point in over 15 months.
The immediate support level appears at $0.27. Strong support exists at $0.25.
For a recovery scenario, ADA needs to reclaim $0.29 with volume. The first resistance level sits at $0.31. A stronger resistance zone exists at $0.32.
Breaking above $0.32 would target the 7-day moving average at $0.33. This would signal a reversal of the current downward trend.
The average true range shows $0.02 in daily volatility. This suggests ADA could move two cents in either direction on any given day.
Trading volume during any bounce attempt will determine if buying interest is genuine or simply technical relief from oversold conditions. The pivot point sits at $0.29.
The post Cardano (ADA) Price: Whales Dump Millions of Tokens as Bears Take Control appeared first on CoinCentral.
You May Also Like

Over 60% of crypto press releases linked to high-risk or scam projects: Report

ArtGis Finance Partners with MetaXR to Expand its DeFi Offerings in the Metaverse

