How to discover the next Virtuals AI agent token with 100x potential?How to discover the next Virtuals AI agent token with 100x potential?

AI Token Trading 100x Profit Guide: Virtuals Ecosystem Token Screening Strategy

2025/01/03 12:51
2 min read

AI Token Trading 100x Profit Guide: Virtuals Ecosystem Token Screening Strategy

Original article: hitesh.eth , Crypto KOL

Compiled by: Yuliya, PANews

How to discover the next Virtuals AI agent token with 100x potential? Here is a professional investment guide:

When the market value of AI agent tokens on the Virtuals platform exceeds $1 million, they will "graduate" from the initial bonding curve mechanism. After graduation, these tokens will create liquidity pools on decentralized exchanges (DEX) such as Uniswap, thereby obtaining better trading liquidity.

Early intervention strategy

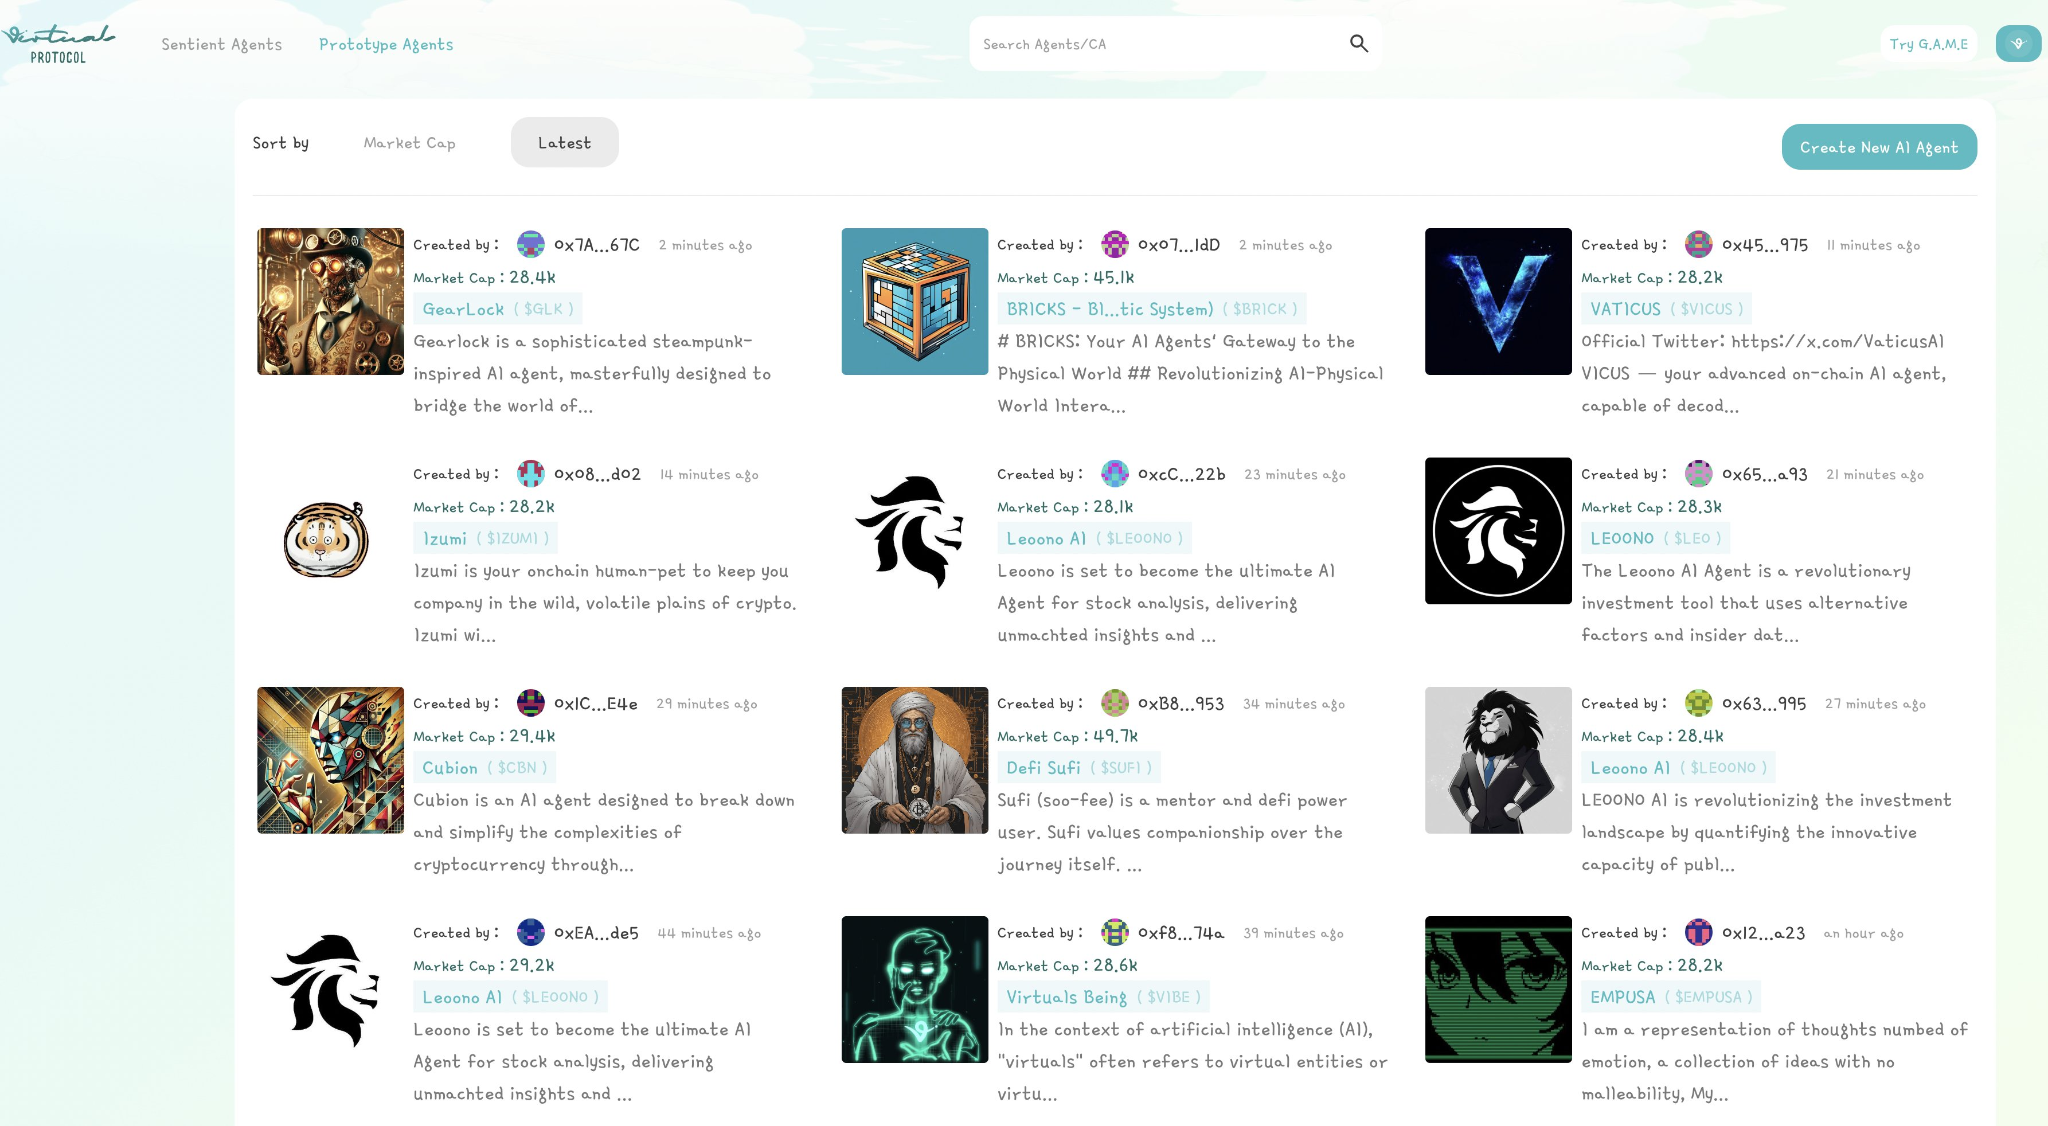
To discover potential 100x opportunities early, the best time is right after the token has "graduated". Investors can pay attention to the "Prototype Agents" section of the Virtuals platform, where about 150-200 new tokens are issued every day. Tokens that quickly reach graduation conditions usually indicate that the market has a high interest in them .

AI Token Trading 100x Profit Guide: Virtuals Ecosystem Token Screening Strategy

Research Methods

  • When you find that a token is rapidly approaching the bonding curve, immediately search for relevant alpha information
  • Search Twitter for related discussions using the token code
  • Gather insights and conduct in-depth secondary validation research using ChatGPT
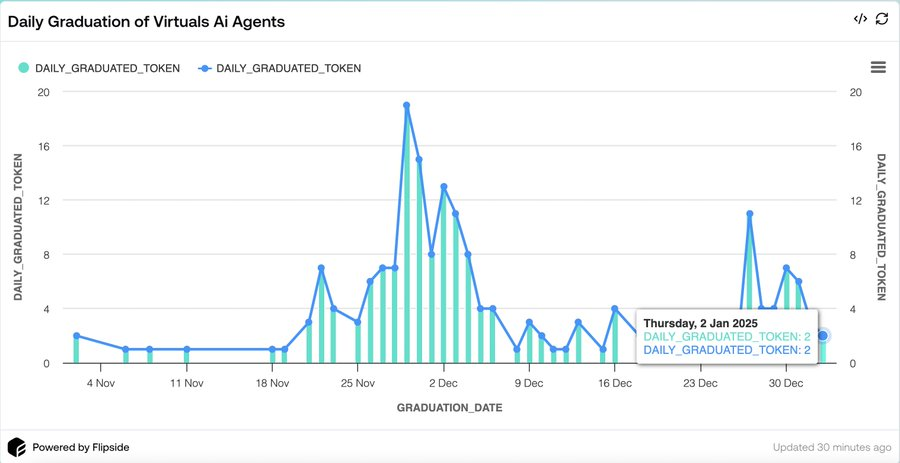
  • Track graduated tokens via the Flipside dashboard (about 2-3 per day)

    AI Token Trading 100x Profit Guide: Virtuals Ecosystem Token Screening Strategy

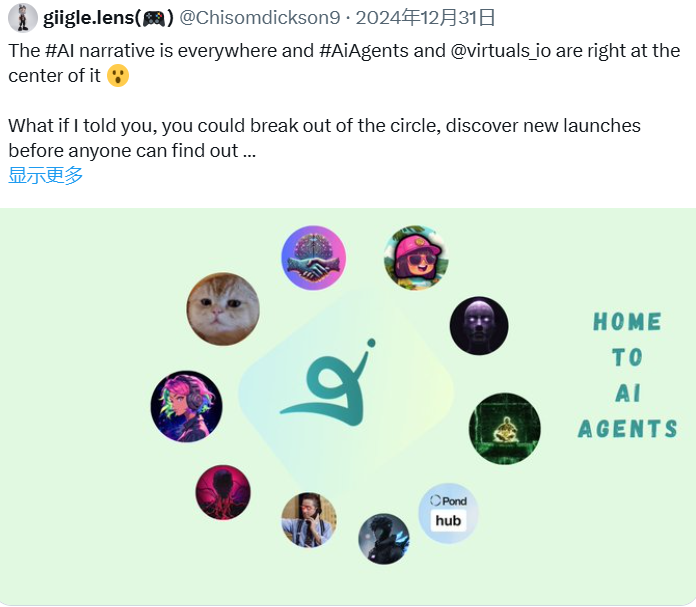
  • Using Virtual AI Agent Token Screener tool developed by @Chisomdickson9

AI Token Trading 100x Profit Guide: Virtuals Ecosystem Token Screening Strategy

Screening Criteria

  • Filter by token creation time, focusing on tokens issued within 3-4 days and their growth

    AI Token Trading 100x Profit Guide: Virtuals Ecosystem Token Screening Strategy

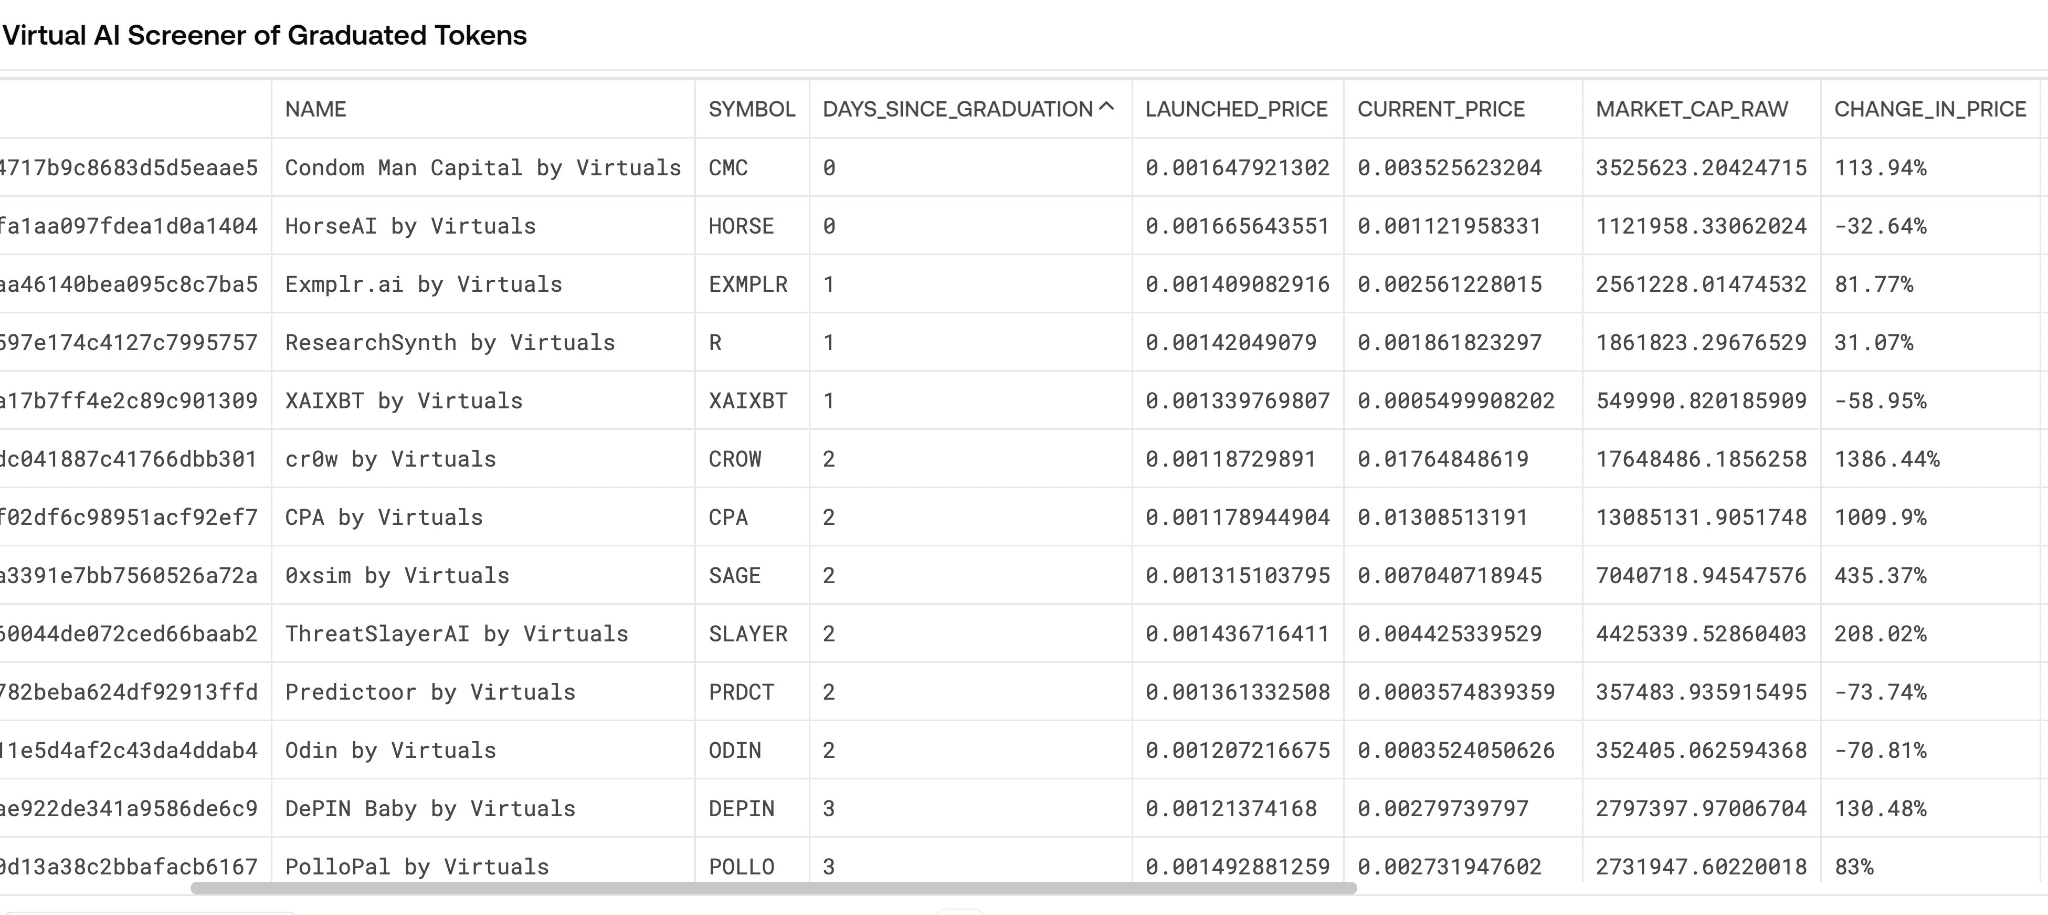
  • View price trends, social media performance such as Twitter, and project websites through Dexscreener
  • Evaluate the actual application scenarios of the token and avoid pure meme tokens, but if the token has practical value or innovative functions and the chart shows a bullish trend, it can be included in the watch list
  • Track 24-hour earnings data and filter by creation time again to find the most popular tokens after graduation

AI Token Trading 100x Profit Guide: Virtuals Ecosystem Token Screening Strategy

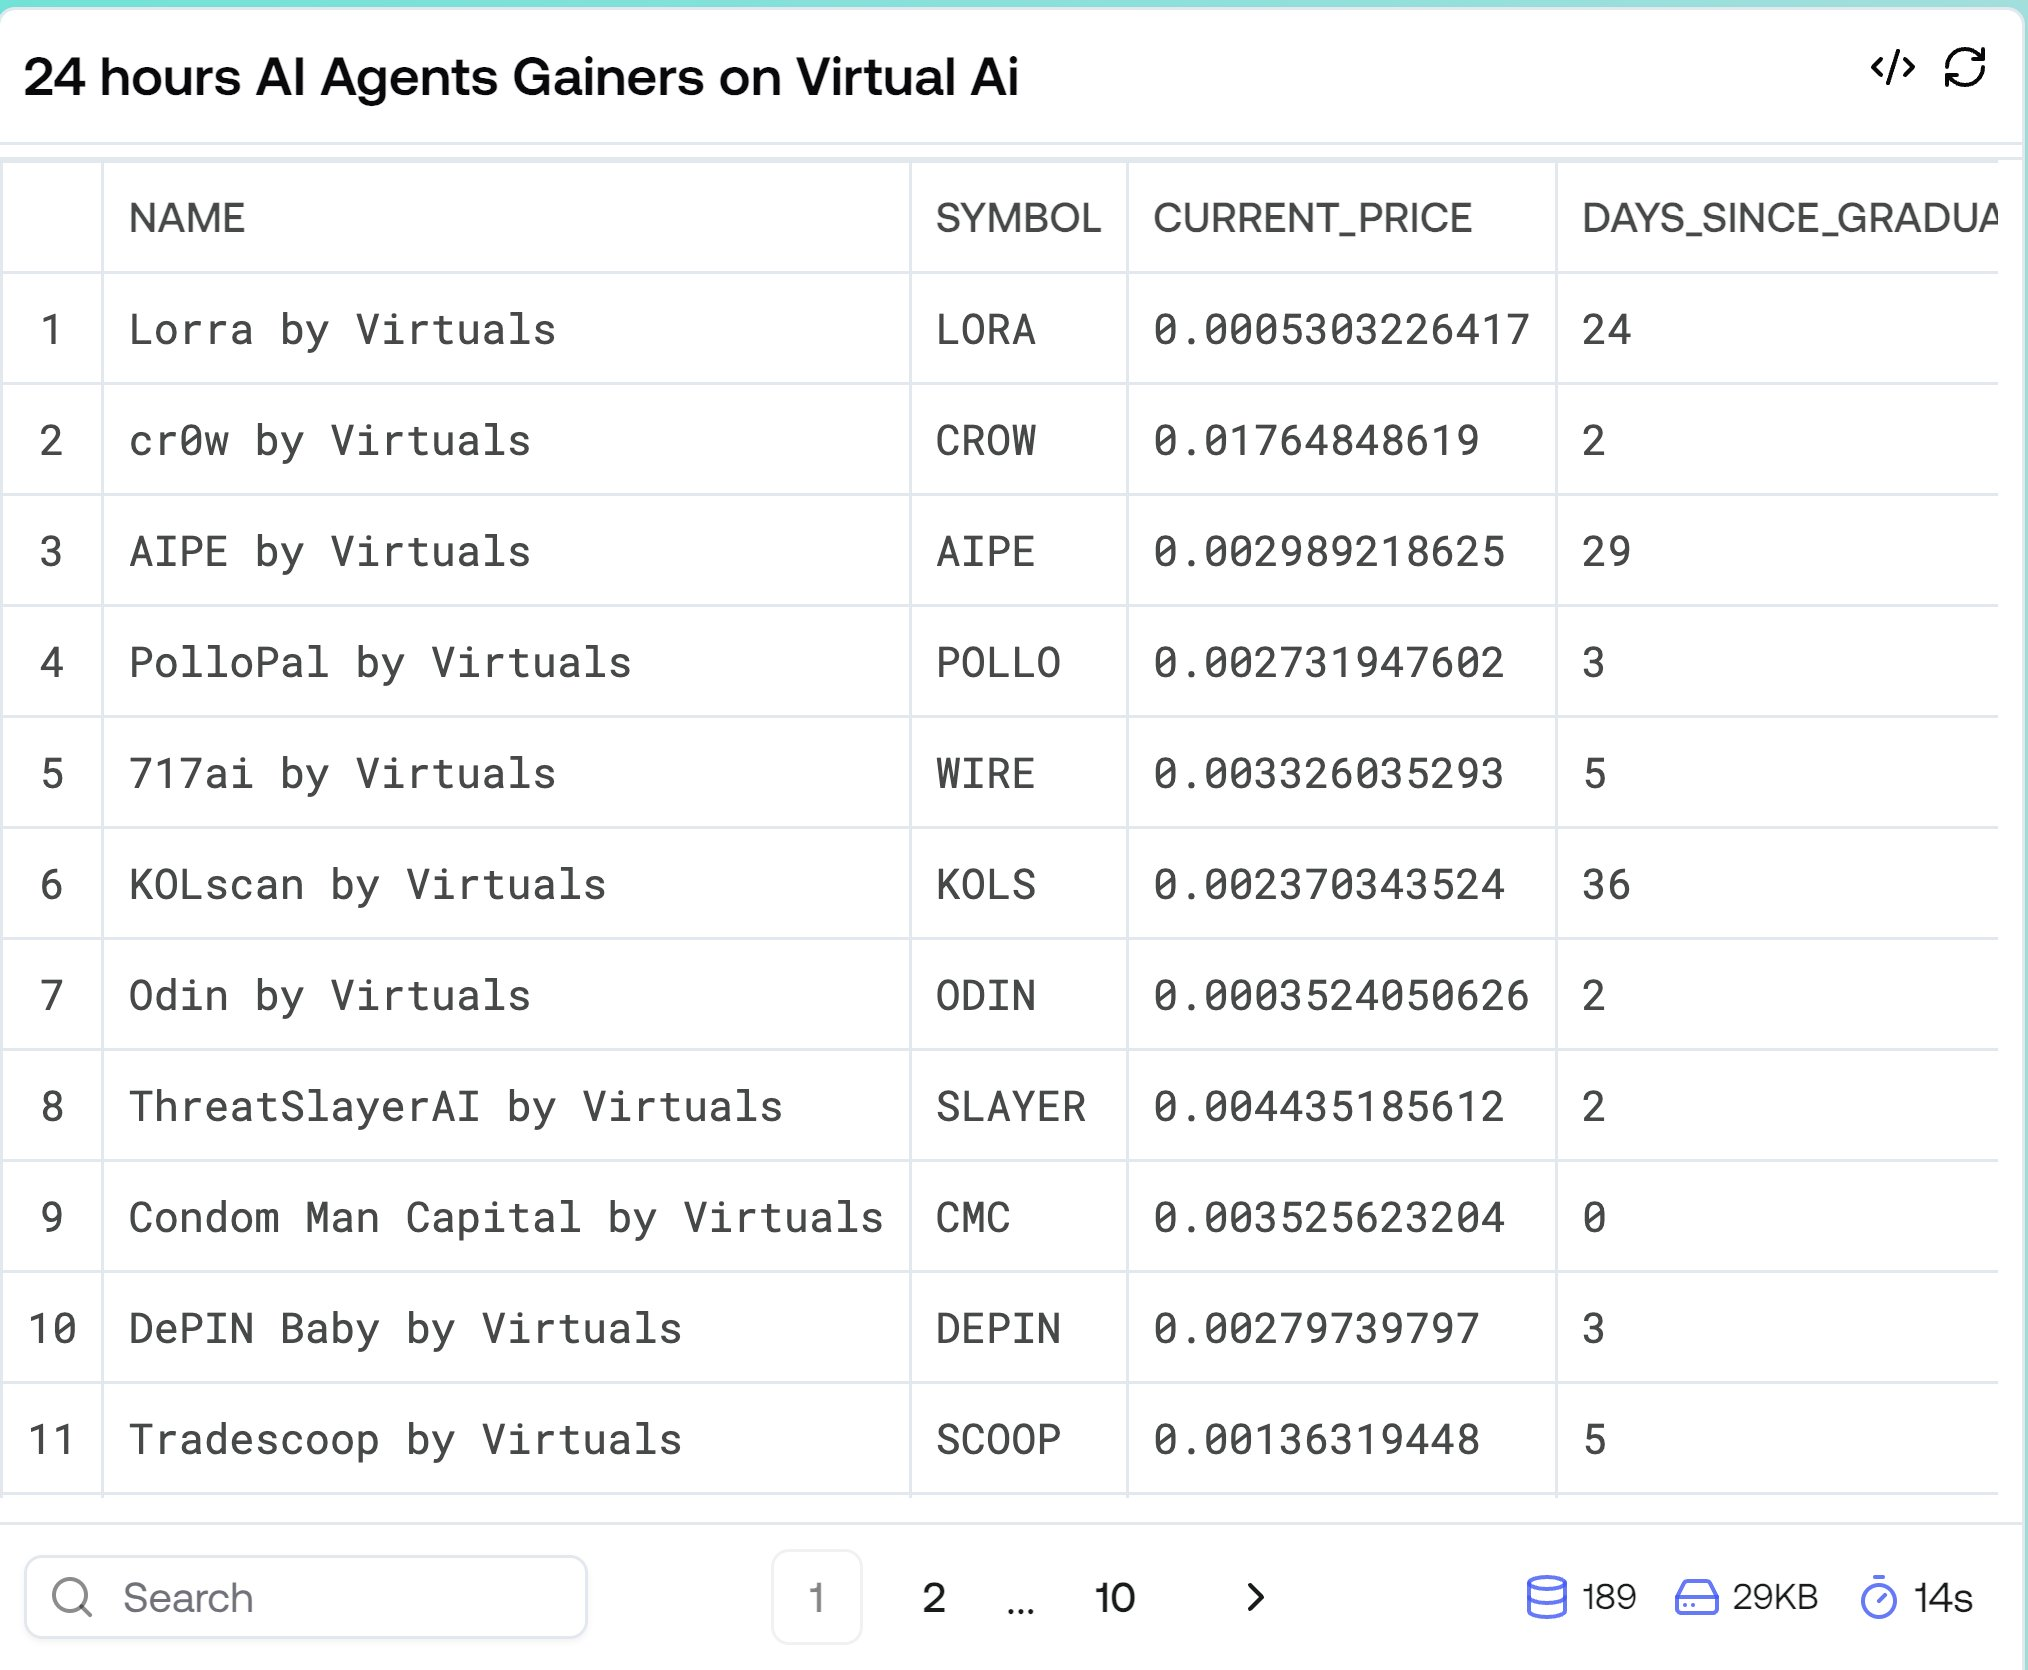
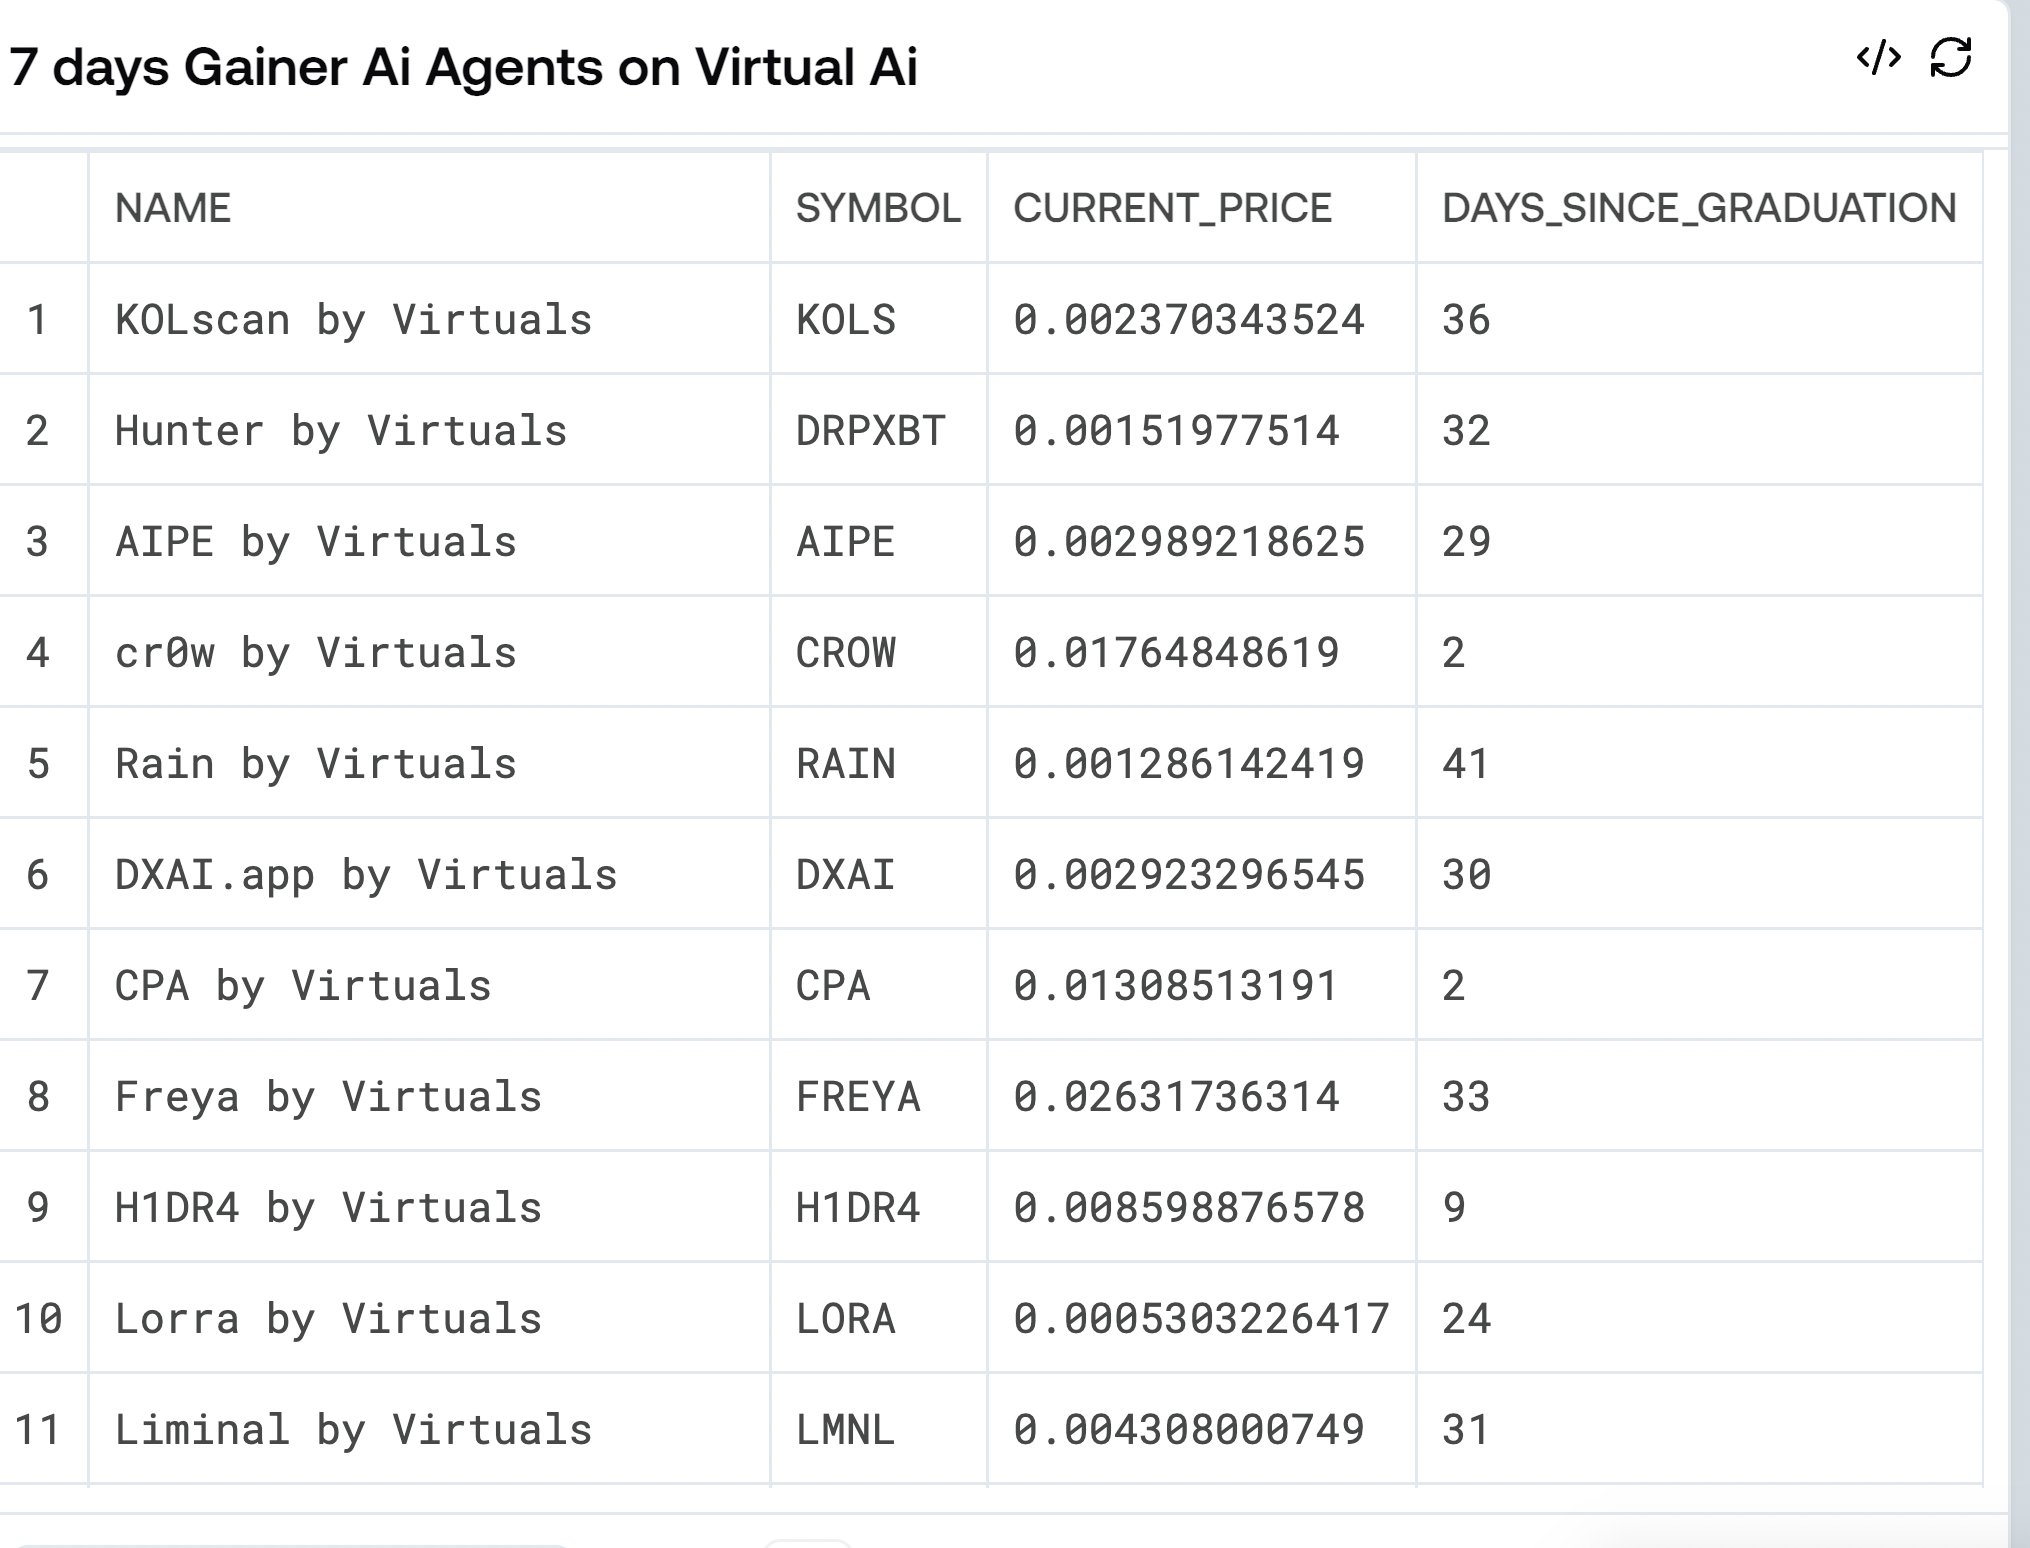
  • Pay attention to the tokens that continue to rise. Those tokens that continue to attract attention after graduation often have more potential for growth. In addition, track strong tokens through the 7-day growth table to find the agents with the strongest market momentum.

AI Token Trading 100x Profit Guide: Virtuals Ecosystem Token Screening Strategy

It is recommended to focus on the cross-application of AI agents in the following areas:

  • Decentralized Science (DeSci)
  • Prediction Market
  • game
  • Decentralized Finance (DeFi)

Investment decisions need to be based on in-depth research of project papers, tracking of social media trends, and understanding of usage scenarios. Through systematic research and screening, a high-quality investment target observation list can be established.

Market Opportunity
TokenFi Logo
TokenFi Price(TOKEN)
$0.003958
$0.003958$0.003958
-2.46%
USD
TokenFi (TOKEN) Live Price Chart
Disclaimer: The articles reposted on this site are sourced from public platforms and are provided for informational purposes only. They do not necessarily reflect the views of MEXC. All rights remain with the original authors. If you believe any content infringes on third-party rights, please contact [email protected] for removal. MEXC makes no guarantees regarding the accuracy, completeness, or timeliness of the content and is not responsible for any actions taken based on the information provided. The content does not constitute financial, legal, or other professional advice, nor should it be considered a recommendation or endorsement by MEXC.

You May Also Like

Over 60% of crypto press releases linked to high-risk or scam projects: Report

Over 60% of crypto press releases linked to high-risk or scam projects: Report

A data analysis shows crypto press release wires are dominated by scam-linked projects, hype-driven content and low-impact announcements, raising concerns about
Share
Crypto.news2026/02/04 22:02
ArtGis Finance Partners with MetaXR to Expand its DeFi Offerings in the Metaverse

ArtGis Finance Partners with MetaXR to Expand its DeFi Offerings in the Metaverse

By using this collaboration, ArtGis utilizes MetaXR’s infrastructure to widen access to its assets and enable its customers to interact with the metaverse.
Share
Blockchainreporter2025/09/18 00:07
Crucial US Stock Market Update: What Wednesday’s Mixed Close Reveals

Crucial US Stock Market Update: What Wednesday’s Mixed Close Reveals

BitcoinWorld Crucial US Stock Market Update: What Wednesday’s Mixed Close Reveals The financial world often keeps us on our toes, and Wednesday was no exception. Investors watched closely as the US stock market concluded the day with a mixed performance across its major indexes. This snapshot offers a crucial glimpse into current investor sentiment and economic undercurrents, prompting many to ask: what exactly happened? Understanding the Latest US Stock Market Movements On Wednesday, the closing bell brought a varied picture for the US stock market. While some indexes celebrated gains, others registered slight declines, creating a truly mixed bag for investors. The Dow Jones Industrial Average showed resilience, climbing by a notable 0.57%. This positive movement suggests strength in some of the larger, more established companies. Conversely, the S&P 500, a broader benchmark often seen as a barometer for the overall market, experienced a modest dip of 0.1%. The technology-heavy Nasdaq Composite also saw a slight retreat, sliding by 0.33%. This particular index often reflects investor sentiment towards growth stocks and the tech sector. These divergent outcomes highlight the complex dynamics currently at play within the American economy. It’s not simply a matter of “up” or “down” for the entire US stock market; rather, it’s a nuanced landscape where different sectors and company types are responding to unique pressures and opportunities. Why Did the US Stock Market See Mixed Results? When the US stock market delivers a mixed performance, it often points to a tug-of-war between various economic factors. Several elements could have contributed to Wednesday’s varied closings. For instance, positive corporate earnings reports from certain industries might have bolstered the Dow. At the same time, concerns over inflation, interest rate policies by the Federal Reserve, or even global economic uncertainties could have pressured growth stocks, affecting the S&P 500 and Nasdaq. Key considerations often include: Economic Data: Recent reports on employment, manufacturing, or consumer spending can sway market sentiment. Corporate Announcements: Strong or weak earnings forecasts from influential companies can significantly impact their respective sectors. Interest Rate Expectations: The prospect of higher or lower interest rates directly influences borrowing costs for businesses and consumer spending, affecting future profitability. Geopolitical Events: Global tensions or trade policies can introduce uncertainty, causing investors to become more cautious. Understanding these underlying drivers is crucial for anyone trying to make sense of daily market fluctuations in the US stock market. Navigating Volatility in the US Stock Market A mixed close, while not a dramatic downturn, serves as a reminder that market volatility is a constant companion for investors. For those involved in the US stock market, particularly individuals managing their portfolios, these days underscore the importance of a well-thought-out strategy. It’s important not to react impulsively to daily movements. Instead, consider these actionable insights: Diversification: Spreading investments across different sectors and asset classes can help mitigate risk when one area underperforms. Long-Term Perspective: Focusing on long-term financial goals rather than short-term gains can help weather daily market swings. Stay Informed: Keeping abreast of economic news and company fundamentals provides context for market behavior. Consult Experts: Financial advisors can offer personalized guidance based on individual risk tolerance and objectives. Even small movements in major indexes can signal shifts that require attention, guiding future investment decisions within the dynamic US stock market. What’s Next for the US Stock Market? Looking ahead, investors will be keenly watching for further economic indicators and corporate announcements to gauge the direction of the US stock market. Upcoming inflation data, statements from the Federal Reserve, and quarterly earnings reports will likely provide more clarity. The interplay of these factors will continue to shape investor confidence and, consequently, the performance of the Dow, S&P 500, and Nasdaq. Remaining informed and adaptive will be key to understanding the market’s trajectory. Conclusion: Wednesday’s mixed close in the US stock market highlights the intricate balance of forces influencing financial markets. While the Dow showed strength, the S&P 500 and Nasdaq experienced slight declines, reflecting a nuanced economic landscape. This reminds us that understanding the ‘why’ behind these movements is as important as the movements themselves. As always, a thoughtful, informed approach remains the best strategy for navigating the complexities of the market. Frequently Asked Questions (FAQs) Q1: What does a “mixed close” mean for the US stock market? A1: A mixed close indicates that while some major stock indexes advanced, others declined. It suggests that different sectors or types of companies within the US stock market are experiencing varying influences, rather than a uniform market movement. Q2: Which major indexes were affected on Wednesday? A2: On Wednesday, the Dow Jones Industrial Average gained 0.57%, while the S&P 500 edged down 0.1%, and the Nasdaq Composite slid 0.33%, illustrating the mixed performance across the US stock market. Q3: What factors contribute to a mixed stock market performance? A3: Mixed performances in the US stock market can be influenced by various factors, including specific corporate earnings, economic data releases, shifts in interest rate expectations, and broader geopolitical events that affect different market segments uniquely. Q4: How should investors react to mixed market signals? A4: Investors are generally advised to maintain a long-term perspective, diversify their portfolios, stay informed about economic news, and avoid impulsive decisions. Consulting a financial advisor can also provide personalized guidance for navigating the US stock market. Q5: What indicators should investors watch for future US stock market trends? A5: Key indicators to watch include upcoming inflation reports, statements from the Federal Reserve regarding monetary policy, and quarterly corporate earnings reports. These will offer insights into the future direction of the US stock market. Did you find this analysis of the US stock market helpful? Share this article with your network on social media to help others understand the nuances of current financial trends! To learn more about the latest stock market trends, explore our article on key developments shaping the US stock market‘s future performance. This post Crucial US Stock Market Update: What Wednesday’s Mixed Close Reveals first appeared on BitcoinWorld.
Share
Coinstats2025/09/18 05:30