Ethereum (ETH) declined on Wednesday, February 4. The token is trading at $2,254. This represents a decline of 1.08% in the past 24 hours. The trading volume increasedEthereum (ETH) declined on Wednesday, February 4. The token is trading at $2,254. This represents a decline of 1.08% in the past 24 hours. The trading volume increased

Ethereum (ETH) Faces Critical Breakdown: Can Bulls Hold $2,000?

3 min read

Ethereum (ETH) declined on Wednesday, February 4. The token is trading at $2,254. This represents a decline of 1.08% in the past 24 hours. The trading volume increased by 32.58%, reaching $46.32 billion. The asset has declined by 25.75% over the last week, according to CoinMarketCap.

Source: CoinMarketCap

Ethereum Nears Critical Zones With Risk of Further Drops

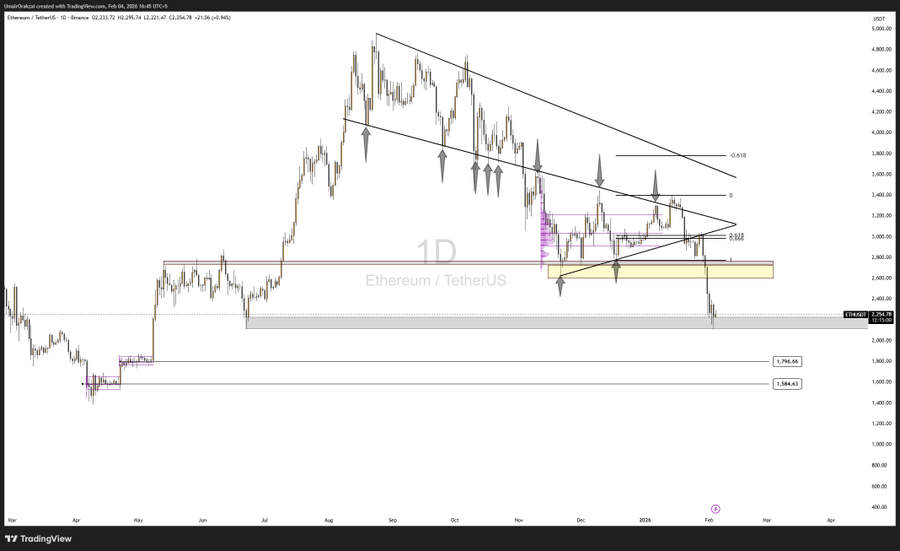
Analyst Umair Crypto highlighted that the drop below $2,600 happened faster than expected. ETH has declined by 15–20% from the $2,600 zone. The analyst noted that the decline from the $3,000 mark has reached almost 30%.

According to Umair Crypto, the asset is currently resting on the last soft spot before weaker support levels. There is a lack of structural support below $2,100 except for the $2,000 psychological mark. The technical support appears again only around $1,800.

Source: X

The failure of the current zone might result in further declines for the token. According to Umair Crypto, the continuation of the price might result in a decline toward $1,800. The analyst noted that a further dip below $1,600 is also possible.

In addition, another analyst, Ted Pillows, mentioned that ETH continued trading above $2,000 in Tuesday’s trading session. According to Ted, for cryptocurrency to start rallying, it has to overcome resistance at $2,400. However, the current price strength appears limited.

Source: X

Also Read: Litecoin (LTC) Eyes $64 Breakout as Market Volatility Fuels Altcoin Momentum

ETH Sees Fresh ETF Inflows and Higher Trading Volume

According to SoSoValue data, $14.06 million in net inflows has been recorded in Ethereum spot ETFs on February 3. The market records these inflows following a series of outflows. 

CoinGlass data shows that volumes increased by 44.51% to $101.95 billion. Open Interest declined by 1.57% to $26.90 billion, while the OI-Weighted Funding Rate stood at 0.0049%.

Source: CoinGlass

RSI and MACD Show Strong Downward Momentum

The RSI indicators show that the coin has declined significantly. The Relative Strength Index (RSI) stands at 26.48. This indicates that the coin has been oversold. However, the signal line stands at 34.90, also confirming that the token has declined significantly.

The Moving Average Convergence Divergence (MACD) line stands at -212.2. The MACD signal line stands at -131.8. However, the histogram stands at -80.4, highlighting continued negative momentum.

Source: TradingView

The market conditions for the price of the token are still volatile. Analysts are looking at the support levels for the asset. The upcoming sessions will show whether the asset will stabilize or move to the lower zones.

Also Read: Ethereum Technical Setup Points to $2,400 Target Amid Market Volatility

Market Opportunity
Ethereum Logo
Ethereum Price(ETH)
$2,152.45
$2,152.45$2,152.45
+0.02%
USD
Ethereum (ETH) Live Price Chart
Disclaimer: The articles reposted on this site are sourced from public platforms and are provided for informational purposes only. They do not necessarily reflect the views of MEXC. All rights remain with the original authors. If you believe any content infringes on third-party rights, please contact [email protected] for removal. MEXC makes no guarantees regarding the accuracy, completeness, or timeliness of the content and is not responsible for any actions taken based on the information provided. The content does not constitute financial, legal, or other professional advice, nor should it be considered a recommendation or endorsement by MEXC.

You May Also Like

Over 60% of crypto press releases linked to high-risk or scam projects: Report

Over 60% of crypto press releases linked to high-risk or scam projects: Report

A data analysis shows crypto press release wires are dominated by scam-linked projects, hype-driven content and low-impact announcements, raising concerns about
Share
Crypto.news2026/02/04 22:02
ArtGis Finance Partners with MetaXR to Expand its DeFi Offerings in the Metaverse

ArtGis Finance Partners with MetaXR to Expand its DeFi Offerings in the Metaverse

By using this collaboration, ArtGis utilizes MetaXR’s infrastructure to widen access to its assets and enable its customers to interact with the metaverse.
Share
Blockchainreporter2025/09/18 00:07
Crucial US Stock Market Update: What Wednesday’s Mixed Close Reveals

Crucial US Stock Market Update: What Wednesday’s Mixed Close Reveals

BitcoinWorld Crucial US Stock Market Update: What Wednesday’s Mixed Close Reveals The financial world often keeps us on our toes, and Wednesday was no exception. Investors watched closely as the US stock market concluded the day with a mixed performance across its major indexes. This snapshot offers a crucial glimpse into current investor sentiment and economic undercurrents, prompting many to ask: what exactly happened? Understanding the Latest US Stock Market Movements On Wednesday, the closing bell brought a varied picture for the US stock market. While some indexes celebrated gains, others registered slight declines, creating a truly mixed bag for investors. The Dow Jones Industrial Average showed resilience, climbing by a notable 0.57%. This positive movement suggests strength in some of the larger, more established companies. Conversely, the S&P 500, a broader benchmark often seen as a barometer for the overall market, experienced a modest dip of 0.1%. The technology-heavy Nasdaq Composite also saw a slight retreat, sliding by 0.33%. This particular index often reflects investor sentiment towards growth stocks and the tech sector. These divergent outcomes highlight the complex dynamics currently at play within the American economy. It’s not simply a matter of “up” or “down” for the entire US stock market; rather, it’s a nuanced landscape where different sectors and company types are responding to unique pressures and opportunities. Why Did the US Stock Market See Mixed Results? When the US stock market delivers a mixed performance, it often points to a tug-of-war between various economic factors. Several elements could have contributed to Wednesday’s varied closings. For instance, positive corporate earnings reports from certain industries might have bolstered the Dow. At the same time, concerns over inflation, interest rate policies by the Federal Reserve, or even global economic uncertainties could have pressured growth stocks, affecting the S&P 500 and Nasdaq. Key considerations often include: Economic Data: Recent reports on employment, manufacturing, or consumer spending can sway market sentiment. Corporate Announcements: Strong or weak earnings forecasts from influential companies can significantly impact their respective sectors. Interest Rate Expectations: The prospect of higher or lower interest rates directly influences borrowing costs for businesses and consumer spending, affecting future profitability. Geopolitical Events: Global tensions or trade policies can introduce uncertainty, causing investors to become more cautious. Understanding these underlying drivers is crucial for anyone trying to make sense of daily market fluctuations in the US stock market. Navigating Volatility in the US Stock Market A mixed close, while not a dramatic downturn, serves as a reminder that market volatility is a constant companion for investors. For those involved in the US stock market, particularly individuals managing their portfolios, these days underscore the importance of a well-thought-out strategy. It’s important not to react impulsively to daily movements. Instead, consider these actionable insights: Diversification: Spreading investments across different sectors and asset classes can help mitigate risk when one area underperforms. Long-Term Perspective: Focusing on long-term financial goals rather than short-term gains can help weather daily market swings. Stay Informed: Keeping abreast of economic news and company fundamentals provides context for market behavior. Consult Experts: Financial advisors can offer personalized guidance based on individual risk tolerance and objectives. Even small movements in major indexes can signal shifts that require attention, guiding future investment decisions within the dynamic US stock market. What’s Next for the US Stock Market? Looking ahead, investors will be keenly watching for further economic indicators and corporate announcements to gauge the direction of the US stock market. Upcoming inflation data, statements from the Federal Reserve, and quarterly earnings reports will likely provide more clarity. The interplay of these factors will continue to shape investor confidence and, consequently, the performance of the Dow, S&P 500, and Nasdaq. Remaining informed and adaptive will be key to understanding the market’s trajectory. Conclusion: Wednesday’s mixed close in the US stock market highlights the intricate balance of forces influencing financial markets. While the Dow showed strength, the S&P 500 and Nasdaq experienced slight declines, reflecting a nuanced economic landscape. This reminds us that understanding the ‘why’ behind these movements is as important as the movements themselves. As always, a thoughtful, informed approach remains the best strategy for navigating the complexities of the market. Frequently Asked Questions (FAQs) Q1: What does a “mixed close” mean for the US stock market? A1: A mixed close indicates that while some major stock indexes advanced, others declined. It suggests that different sectors or types of companies within the US stock market are experiencing varying influences, rather than a uniform market movement. Q2: Which major indexes were affected on Wednesday? A2: On Wednesday, the Dow Jones Industrial Average gained 0.57%, while the S&P 500 edged down 0.1%, and the Nasdaq Composite slid 0.33%, illustrating the mixed performance across the US stock market. Q3: What factors contribute to a mixed stock market performance? A3: Mixed performances in the US stock market can be influenced by various factors, including specific corporate earnings, economic data releases, shifts in interest rate expectations, and broader geopolitical events that affect different market segments uniquely. Q4: How should investors react to mixed market signals? A4: Investors are generally advised to maintain a long-term perspective, diversify their portfolios, stay informed about economic news, and avoid impulsive decisions. Consulting a financial advisor can also provide personalized guidance for navigating the US stock market. Q5: What indicators should investors watch for future US stock market trends? A5: Key indicators to watch include upcoming inflation reports, statements from the Federal Reserve regarding monetary policy, and quarterly corporate earnings reports. These will offer insights into the future direction of the US stock market. Did you find this analysis of the US stock market helpful? Share this article with your network on social media to help others understand the nuances of current financial trends! To learn more about the latest stock market trends, explore our article on key developments shaping the US stock market‘s future performance. This post Crucial US Stock Market Update: What Wednesday’s Mixed Close Reveals first appeared on BitcoinWorld.
Share
Coinstats2025/09/18 05:30