

Big Demand Zone Below $2K Signals ETH’s Next Move
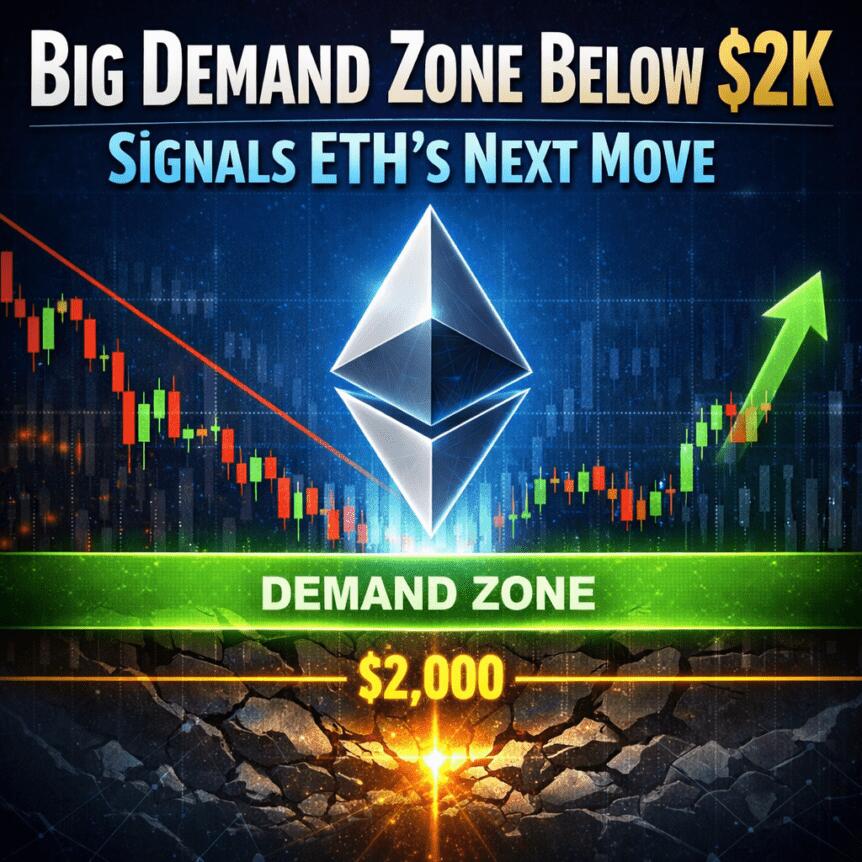
Ether faced resistance to hold above $2,000 on Tuesday as market sentiment cooled, and a 31% drop in 2026 has drawn comparisons to price fractals seen in prior bull markets. The slide to roughly $1,736 underscored a broader consolidation, with traders weighing the risk of further draws versus the potential of a patient, bottoming process. On-chain watchers have repeatedly highlighted a defined demand zone spanning approximately $1,300 to $2,000, a band that could attract buyers if price action continues to meander lower. The narrative here centers on whether Ether can form a durable base or slip into a protracted period of range-bound trading that delays a meaningful breakout. For context, market participants continue to monitor liquidity flows, derivative risk, and evolving network fundamentals that often foreshadow macro moves.
Key takeaways
-
ETH’s drop to about $1,736 may mark the initial low in a broader consolidation phase rather than a final bottom.
-
On-chain cost-basis data clusters between $1,300 and $2,000, reinforcing this range as a potential demand zone.
-
A fractal comparison of the 2021–2022 cycle with 2024–2025 suggests a pattern where an early bottom is followed by retests to lower levels before a durable base forms.
-
UTXO Realized Price Distribution (URPD) points to meaningful overhead resistance near $2,822 and $3,119, concentrations that could cap rallies unless substantial demand emerges below current levels.
-
Derivatives data show concentrated long-liquidation risk around $1,455 from $1,700, while more than $12 billion in short liquidity sits up to $3,000, implying a potential shift in momentum once downside liquidity is absorbed.
Tickers mentioned: $ETH
Sentiment: Neutral
Price impact: Neutral. Near-term risk remains balanced by base-building signals and a defined demand zone.
Market context: The broader crypto backdrop continues to digest on-chain signals alongside macro risks. Ethereum withdrawals from exchanges have spiked to the highest levels since October 2025, with net outflows exceeding 220,000 ETH, and Binance alone recording roughly 158,000 ETH in daily net outflows—the largest since August 2025. These flows coincided with ETH trading in a $1,800–$2,000 range, suggesting a combination of accumulation and risk-off repositioning. Meanwhile, stablecoin activity on Ethereum has risen markedly, with stablecoin transaction volume up about 200% over the past 18 months even as the price has lagged. This divergence can foreshadow a re-rating if network fundamentals and liquidity conditions align with price action.
Why it matters
The unfolding pattern matters because it frames Ether’s potential trajectory in the context of a longer base-building phase rather than a quick recovery. If the fractal framework holds, the asset could spend more time coiling within a defined band, testing lower supports before a durable upside breakout emerges. This matters for traders and risk managers who must gauge how much exposure to maintain during a broad consolidation while tracking evolving on-chain activity and derivatives signals that historically precede major moves.
From a broader market perspective, the interaction between on-chain demand zones and subtle shifts in exchange flows could signal how liquidity is reallocated as institutions and retail participants reassess risk. The observed uptick in stablecoin settlements and the outflows from centralized venues imply a transfer of risk away from exchanges in favor of self-custody and potentially longer-duration holding patterns. If this trend persists, it could set the stage for a renewed bid when price action tests critical levels in the $1,500s or higher.
Additionally, the ongoing dialogue around whether Ether is capitulating or merely consolidating highlights the nuanced nature of market cycles. The fractal approach, which aligns current action with prior periods of broad basing, suggests that patience and disciplined risk management may be more prudent than chasing short-term rallies during uncertain liquidity regimes. Independent observers are watching for confirmations from on-chain metrics and derivatives markets that could either reinforce a gradual re-rating or expose the market to sharper, faster moves once liquidity conditions flip.
What to watch next
-
Price tests of the $1,500–$1,600 zone and whether buyers re-emerge at the lower end of the demand band.
-
Verification of key URPD levels around $1,237 and $1,881 as potential cycle floors and pockets of demand if price retraces further.
-
Monitoring long versus short liquidity dynamics, including long-liquidation risks around $1,455 from the $1,700 area and substantial short liquidity up to $3,000, which could shape the slope of any ensuing rally.
-
Trends in exchange withdrawals and stablecoin turnover on Ethereum, which may presage shifts in market participation and risk tolerance.
-
Derivative market signals, including any evolving bias after absorption of near-term liquidity pressures, to gauge whether the market transitions from distribution to accumulation.
Sources & verification
- Ether UTXO Realized Price Distribution (URPD) data and interpretations from Glassnode.
- Rising Ethereum withdrawals from exchanges and related net flows, with Binance’s outflows highlighted as a notable datapoint from CryptoQuant.
- Derivatives risk indicators, including the Cuingood-style liquidation heat map from Coinglass, detailing long-liquidation risk levels and short liquidity concentrations to $3,000.
- Weekly chart framing and fractal comparisons published with reference to ETHUSDT data on TradingView (Cointelegraph/TradingView).
- Ethereum Foundation SEAL collaboration articles on wallet security and related efforts to curb drainers.
Ether fractal signals an extended base-building phase
Ether (CRYPTO: ETH) has again drawn analysts to a familiar price-action pattern where a pronounced dip is followed by a prolonged period of range-bound activity rather than an immediate leg higher. On the weekly chart, a move toward the $1,730 area resembles a “first low” rather than a definitive market floor, echoing structures seen during the 2021–2022 period when ETH spent roughly a year consolidating near a first low of approximately $1,730 and a broader support band around $885. These historical touchpoints, when viewed through a fractal lens, suggest the current cycle may unfold similarly: a first phase of downside risk that yields to a more extended base-building phase before demand returns with greater resilience. The weekly framing in this narrative is anchored by the ETHUSDT pair on TradingView, which has provided the visual reference for these comparisons. The fractal interpretation is not a guarantee, but it offers a framework for interpreting the sequence of on-chain activity and price movements against the backdrop of a market still digesting liquidity and macro cues.
In the near term, the market’s focus shifts to whether Ether can sustain a bid above the immediate support around $1,500–$1,600 or if price testing compounds the pressure toward the $1,237 level, a region that previous analyses identify as a potential cycle floor. The on-chain support is reinforced by URPD observations, which show substantial realized price concentration at higher levels, underscoring a stubborn overhead that could keep rallies in check unless fresh demand emerges. At the same time, the index of supply concentration at $2,822 and $3,119 constitutes a ceiling that traders must clear to generate meaningful upside momentum. These resistance pillars remind investors that any attempt to re-rate Ether will require a combination of technical durability and sustained capital inflows.
Meanwhile, market participants should monitor the interplay between on-chain signals and derivatives dynamics. The heat map of long liquidations suggests a risk horizon near $1,455 when price drifts from $1,700, while a large pool of short liquidity up to $3,000 implies a potential upside framework once sellers exhaust liquidity pressure. The balance between these forces—realized price levels, withdrawal trends, and the evolving derivative landscape—will shape whether Ether can complete a longer, steadier base or remains vulnerable to periodic risk-off episodes that push the price toward the lower bound of the current range.
As observers parse these signals, one constant remains: the market’s attention to demand zones and supply barriers. The convergence of on-chain data with macro risk sentiment can either reinforce a patient, base-building narrative or catalyze a more decisive move if new catalysts emerge. The evolving ecosystem continues to attract attention from developers and investors who watch for signs of renewed network activity, institutional participation, and regulatory clarity that could shift the risk calculus in Ether’s favor.
This article was originally published as Big Demand Zone Below $2K Signals ETH’s Next Move on Crypto Breaking News – your trusted source for crypto news, Bitcoin news, and blockchain updates.
You May Also Like
Forward Industries zet $4 miljard in om Solana bezit uit te breiden

Crucial Fed Rate Cut: October Probability Surges to 94%
