Short term price prediction for YZY coin launched by rapper Kanye West on August 21st.Short term price prediction for YZY coin launched by rapper Kanye West on August 21st.

YZY price prediction: Can hype sustain YZY above $1?

2025/08/21 19:02
3 min read

Controversial rapper Kanye West launched YZY token earlier today, with market frenzy pushing the coin to a +$400 million valuation just hours after launch. The Solana-based meme coin has collapsed over 50% in price since launch but still boasts a market cap of over $140 million.

What’s next for the YZY price prediction? Let’s take a look at the forecast for this newly launched coin.

Summary
  • YZY coin launched on August 21st, seeing a $410 million market cap before tanking to $140 million, now trading above $1.
  • The murky distribution of the coin and media scandals around rapper Kanye West do not lend credence to the long-term viability of the coin, but short-term hype may fuel further trading activity.
  • YZY coin may fluctuate between $1.00 to $1.50 in the immediate future, but downside risk dominates the outlook for the coin.

Table of Contents

  • Current YZY price scenario
  • YZY forecast: Key Signs YZY may struggle to hold value
  • Short term YZY price prediction

Current YZY price scenario

YZY has had a rocky introduction to the market with major selloffs and high volatility thus far for the brand new token. On-chain data shows that early buyers cashed out major profits upon launch, leading to concerns about the distribution of the token.

YZY price prediction: Can hype sustain YZY above $1? - 1

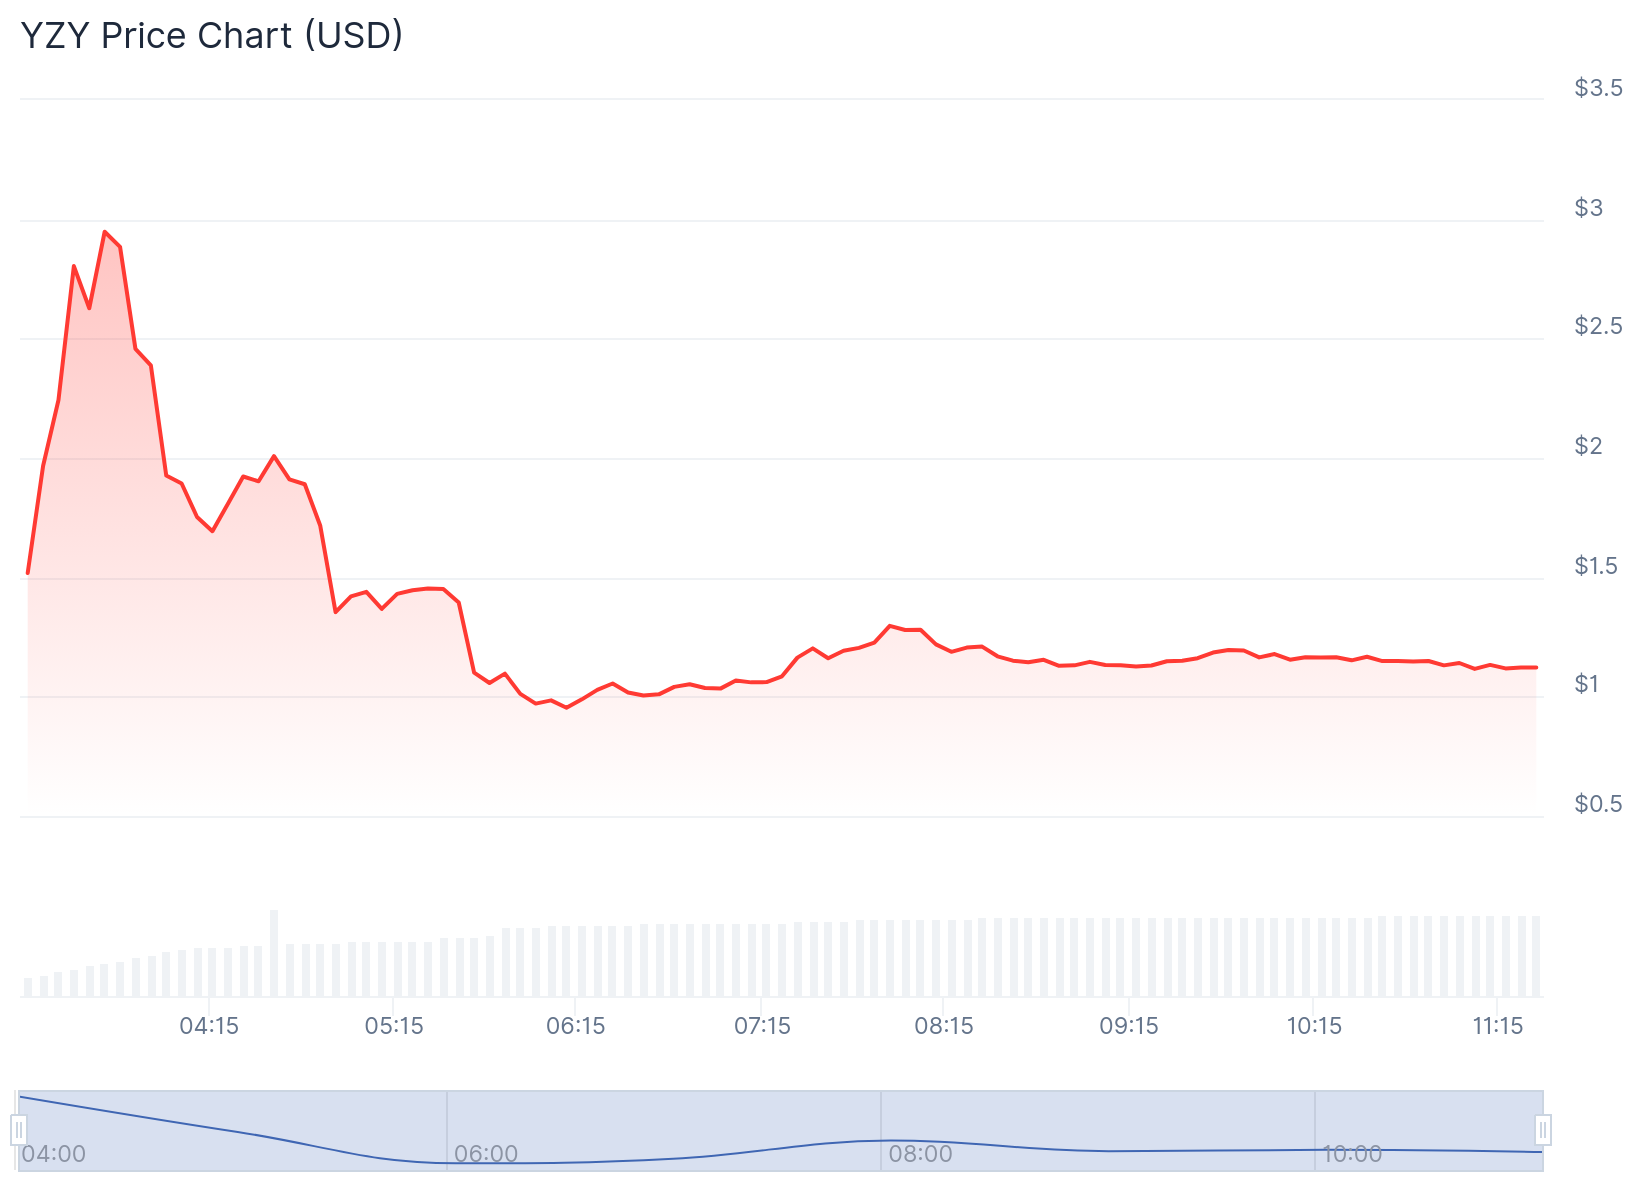
The current price of YZY (YZY) is $1.12, as of Aug 21, 2025. Over the last 24 hours, the price has moved by -26.53%, with a change of -4.25% in the past hour. A YZY coin price prediction will be tricky due to the nascent status of the coin, but the early volatility and shaky tokenomics of the coin does not inspire confidence long-term.

YZY forecast: Key Signs YZY may struggle to hold value

Sign 1 – Insider selling pressures price

Early buyers and insider wallets have already realized heavy profits, creating sustained selling pressure. This dynamic makes it harder for new buyers to find confidence in YZY’s long-term viability.

Sign 2 – Bearish technical signals

Indicators such as MACD and RSI suggest the token is locked in a short-term downtrend. With limited support levels established, price action remains vulnerable to sharper dips.

Sign 3 – Reliance on hype and sentiment

YZY has no clear utility or roadmap. Its only driver is celebrity branding and social media attention. While this can spark short-term rallies, it also leaves the token exposed to sudden collapses when momentum fades.

Short term YZY price prediction

The outlook for YZY coin is a rocky one as the hype-fuelled meme coin could swing in either direction at this early stage. In the near term, YZY is expected to fluctuate between $1.00 and $1.50, with speculative bursts possibly pushing toward $2.00.

However, unless new demand emerges beyond hype, downside risk dominates. The probability of YZY sliding back under the $1 threshold remains high, especially if insider selling continues to weigh on sentiment.

Disclosure: This article does not represent investment advice. The content and materials featured on this page are for educational purposes only.

Market Opportunity
Hyperliquid Logo
Hyperliquid Price(HYPE)
$32.43
$32.43$32.43
+2.59%
USD
Hyperliquid (HYPE) Live Price Chart
Disclaimer: The articles reposted on this site are sourced from public platforms and are provided for informational purposes only. They do not necessarily reflect the views of MEXC. All rights remain with the original authors. If you believe any content infringes on third-party rights, please contact [email protected] for removal. MEXC makes no guarantees regarding the accuracy, completeness, or timeliness of the content and is not responsible for any actions taken based on the information provided. The content does not constitute financial, legal, or other professional advice, nor should it be considered a recommendation or endorsement by MEXC.

You May Also Like

Ethereum unveils roadmap focusing on scaling, interoperability, and security at Japan Dev Conference

Ethereum unveils roadmap focusing on scaling, interoperability, and security at Japan Dev Conference

The post Ethereum unveils roadmap focusing on scaling, interoperability, and security at Japan Dev Conference appeared on BitcoinEthereumNews.com. Key Takeaways Ethereum’s new roadmap was presented by Vitalik Buterin at the Japan Dev Conference. Short-term priorities include Layer 1 scaling and raising gas limits to enhance transaction throughput. Vitalik Buterin presented Ethereum’s development roadmap at the Japan Dev Conference today, outlining the blockchain platform’s priorities across multiple timeframes. The short-term goals focus on scaling solutions and increasing Layer 1 gas limits to improve transaction capacity. Mid-term objectives target enhanced cross-Layer 2 interoperability and faster network responsiveness to create a more seamless user experience across different scaling solutions. The long-term vision emphasizes building a secure, simple, quantum-resistant, and formally verified minimalist Ethereum network. This approach aims to future-proof the platform against emerging technological threats while maintaining its core functionality. The roadmap presentation comes as Ethereum continues to compete with other blockchain platforms for market share in the smart contract and decentralized application space. Source: https://cryptobriefing.com/ethereum-roadmap-scaling-interoperability-security-japan/
Share
BitcoinEthereumNews2025/09/18 00:25
Microsoft Corp. $MSFT blue box area offers a buying opportunity

Microsoft Corp. $MSFT blue box area offers a buying opportunity

The post Microsoft Corp. $MSFT blue box area offers a buying opportunity appeared on BitcoinEthereumNews.com. In today’s article, we’ll examine the recent performance of Microsoft Corp. ($MSFT) through the lens of Elliott Wave Theory. We’ll review how the rally from the April 07, 2025 low unfolded as a 5-wave impulse followed by a 3-swing correction (ABC) and discuss our forecast for the next move. Let’s dive into the structure and expectations for this stock. Five wave impulse structure + ABC + WXY correction $MSFT 8H Elliott Wave chart 9.04.2025 In the 8-hour Elliott Wave count from Sep 04, 2025, we saw that $MSFT completed a 5-wave impulsive cycle at red III. As expected, this initial wave prompted a pullback. We anticipated this pullback to unfold in 3 swings and find buyers in the equal legs area between $497.02 and $471.06 This setup aligns with a typical Elliott Wave correction pattern (ABC), in which the market pauses briefly before resuming its primary trend. $MSFT 8H Elliott Wave chart 7.14.2025 The update, 10 days later, shows the stock finding support from the equal legs area as predicted allowing traders to get risk free. The stock is expected to bounce towards 525 – 532 before deciding if the bounce is a connector or the next leg higher. A break into new ATHs will confirm the latter and can see it trade higher towards 570 – 593 area. Until then, traders should get risk free and protect their capital in case of a WXY double correction. Conclusion In conclusion, our Elliott Wave analysis of Microsoft Corp. ($MSFT) suggested that it remains supported against April 07, 2025 lows and bounce from the blue box area. In the meantime, keep an eye out for any corrective pullbacks that may offer entry opportunities. By applying Elliott Wave Theory, traders can better anticipate the structure of upcoming moves and enhance risk management in volatile markets. Source: https://www.fxstreet.com/news/microsoft-corp-msft-blue-box-area-offers-a-buying-opportunity-202509171323
Share
BitcoinEthereumNews2025/09/18 03:50
SHIB Price Analysis for February 8

SHIB Price Analysis for February 8

The post SHIB Price Analysis for February 8 appeared on BitcoinEthereumNews.com. Original U.Today article Can traders expect SHIB to test the $0.0000070 range soon
Share
BitcoinEthereumNews2026/02/09 00:26