This article analyzes a record 902 million code commits in 1.7 million repositories. Experienced developers grew 27%; India surpassed the United States to become the country with the most new developers.This article analyzes a record 902 million code commits in 1.7 million repositories. Experienced developers grew 27%; India surpassed the United States to become the country with the most new developers.

Electric Capital's annual developer report: 39,000 new developers joined, more than half of Ethereum developers are committed to L2

2024/12/13 15:49
9 min read

Author: Electric Capital

Compiled by: Felix, PANews
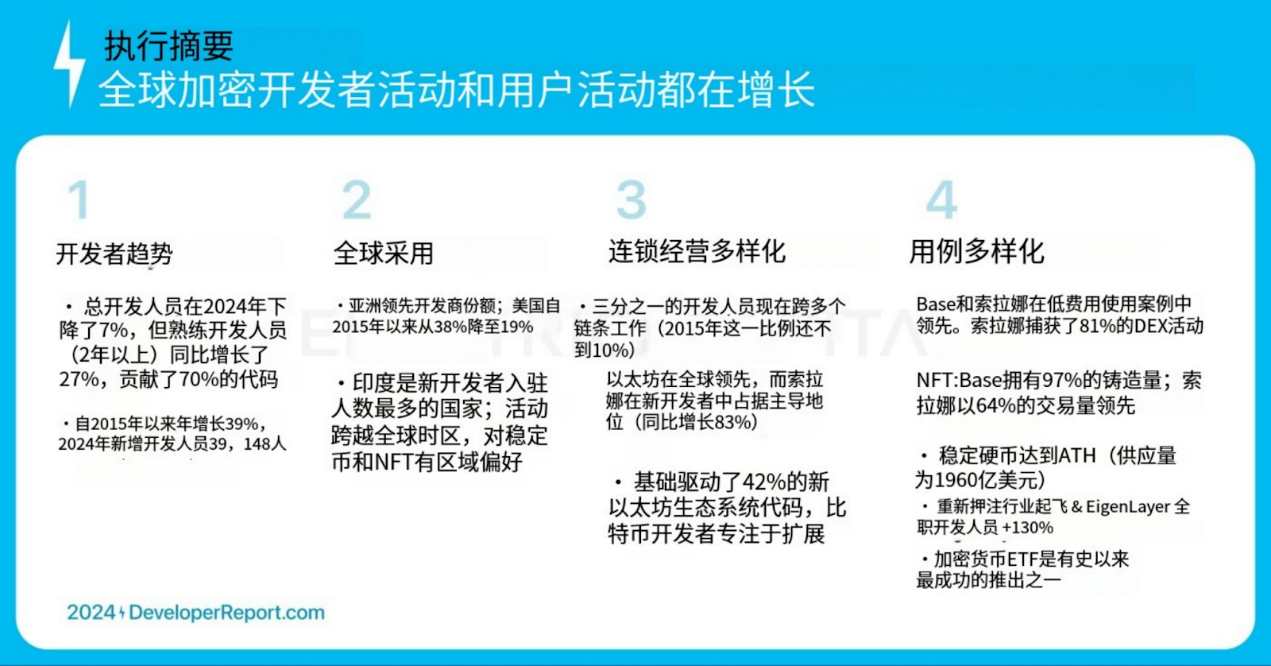
Key points:

  • Cryptocurrency is global, and development momentum has shifted outside of North America
  • Developers and use cases are diverse in the ecosystem
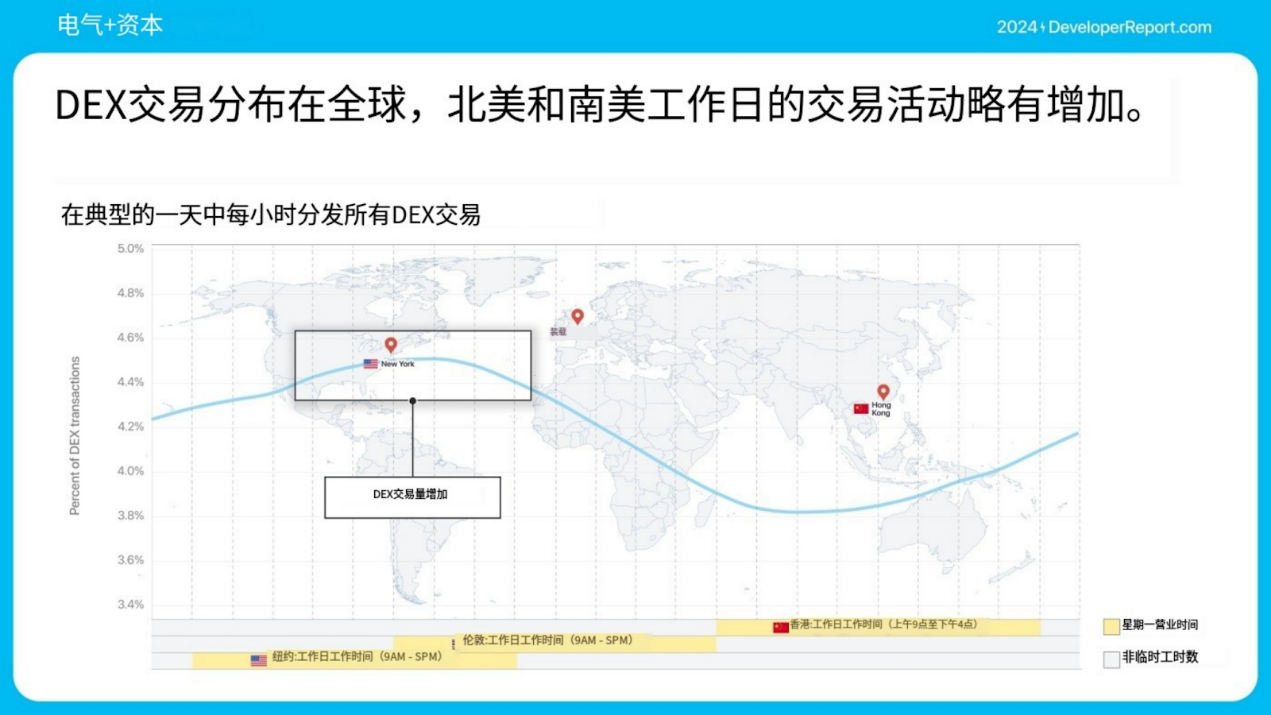
  • The usage range spans all time zones, indicating global usage

This paper analyzes a record 902 million code commits across 1.7 million repositories.

Electric Capital's annual developer report: 39,000 new developers joined, more than half of Ethereum developers are committed to L2

Overall Trend

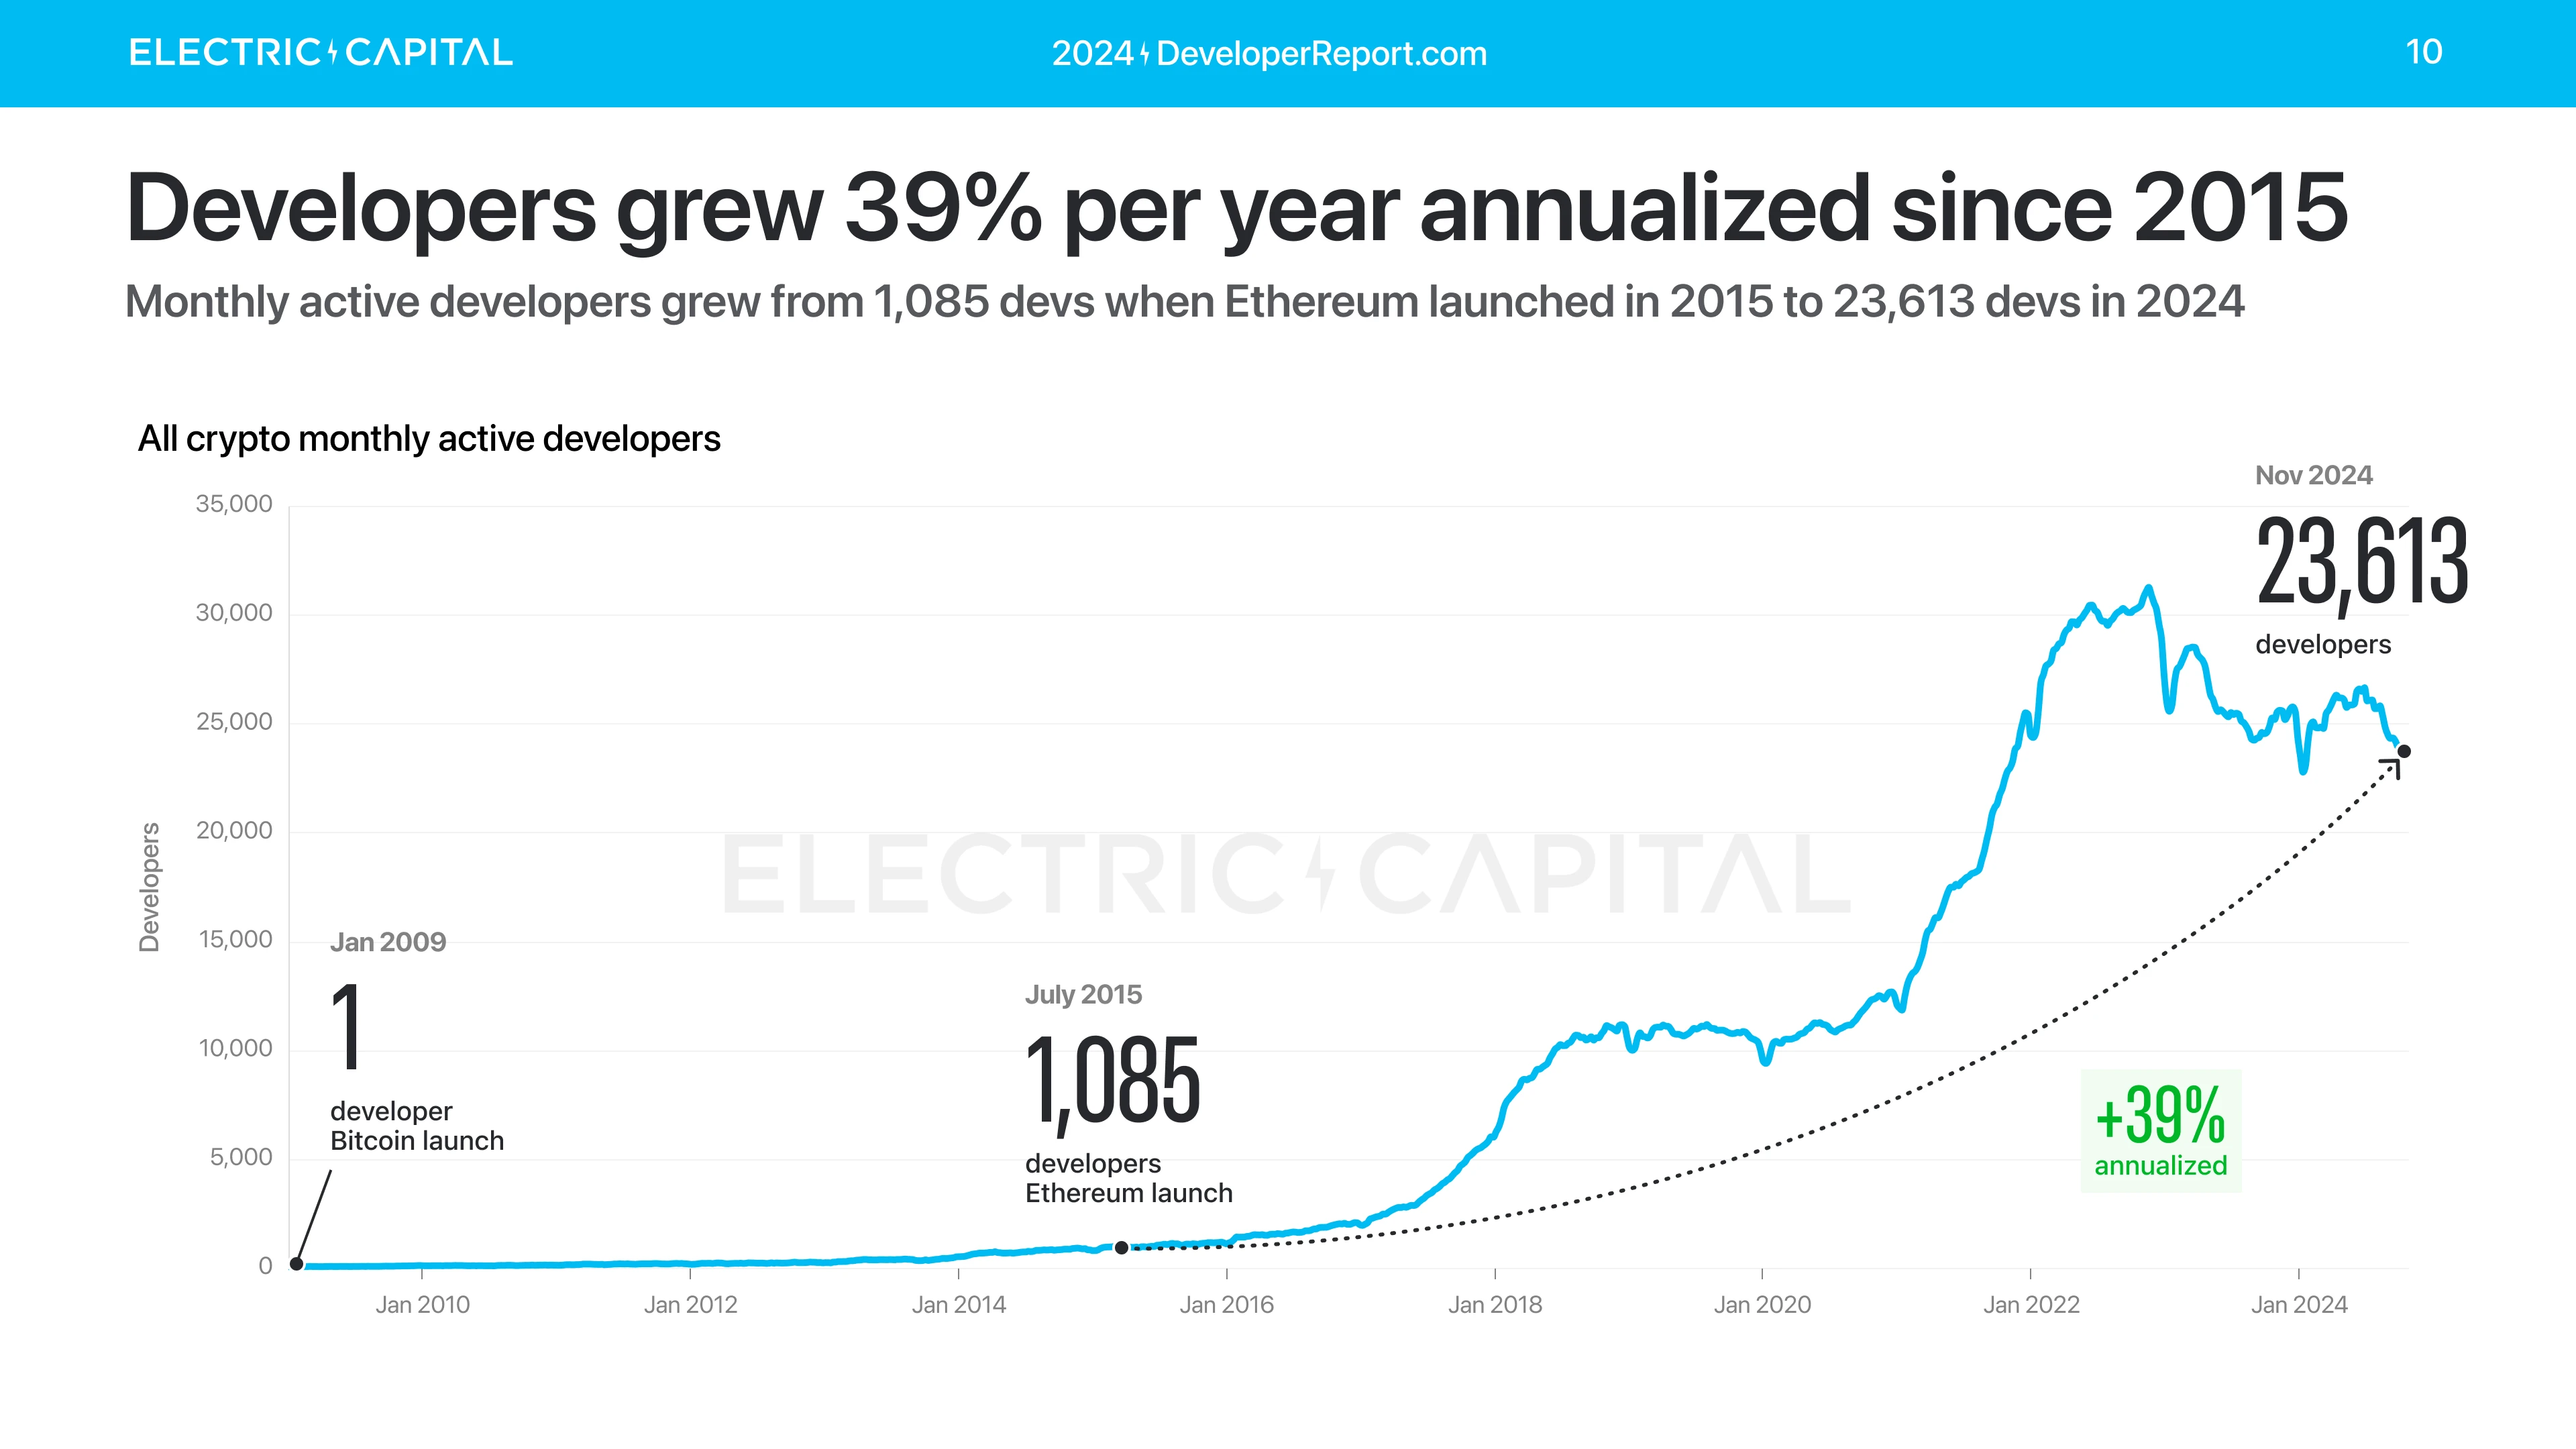
The number of crypto developers has grown 39% annually since Ethereum launched in 2015. There were about 1,000 monthly active developers in 2015. Today, there are 23,613 monthly active developers working on cryptocurrency.

Electric Capital's annual developer report: 39,000 new developers joined, more than half of Ethereum developers are committed to L2

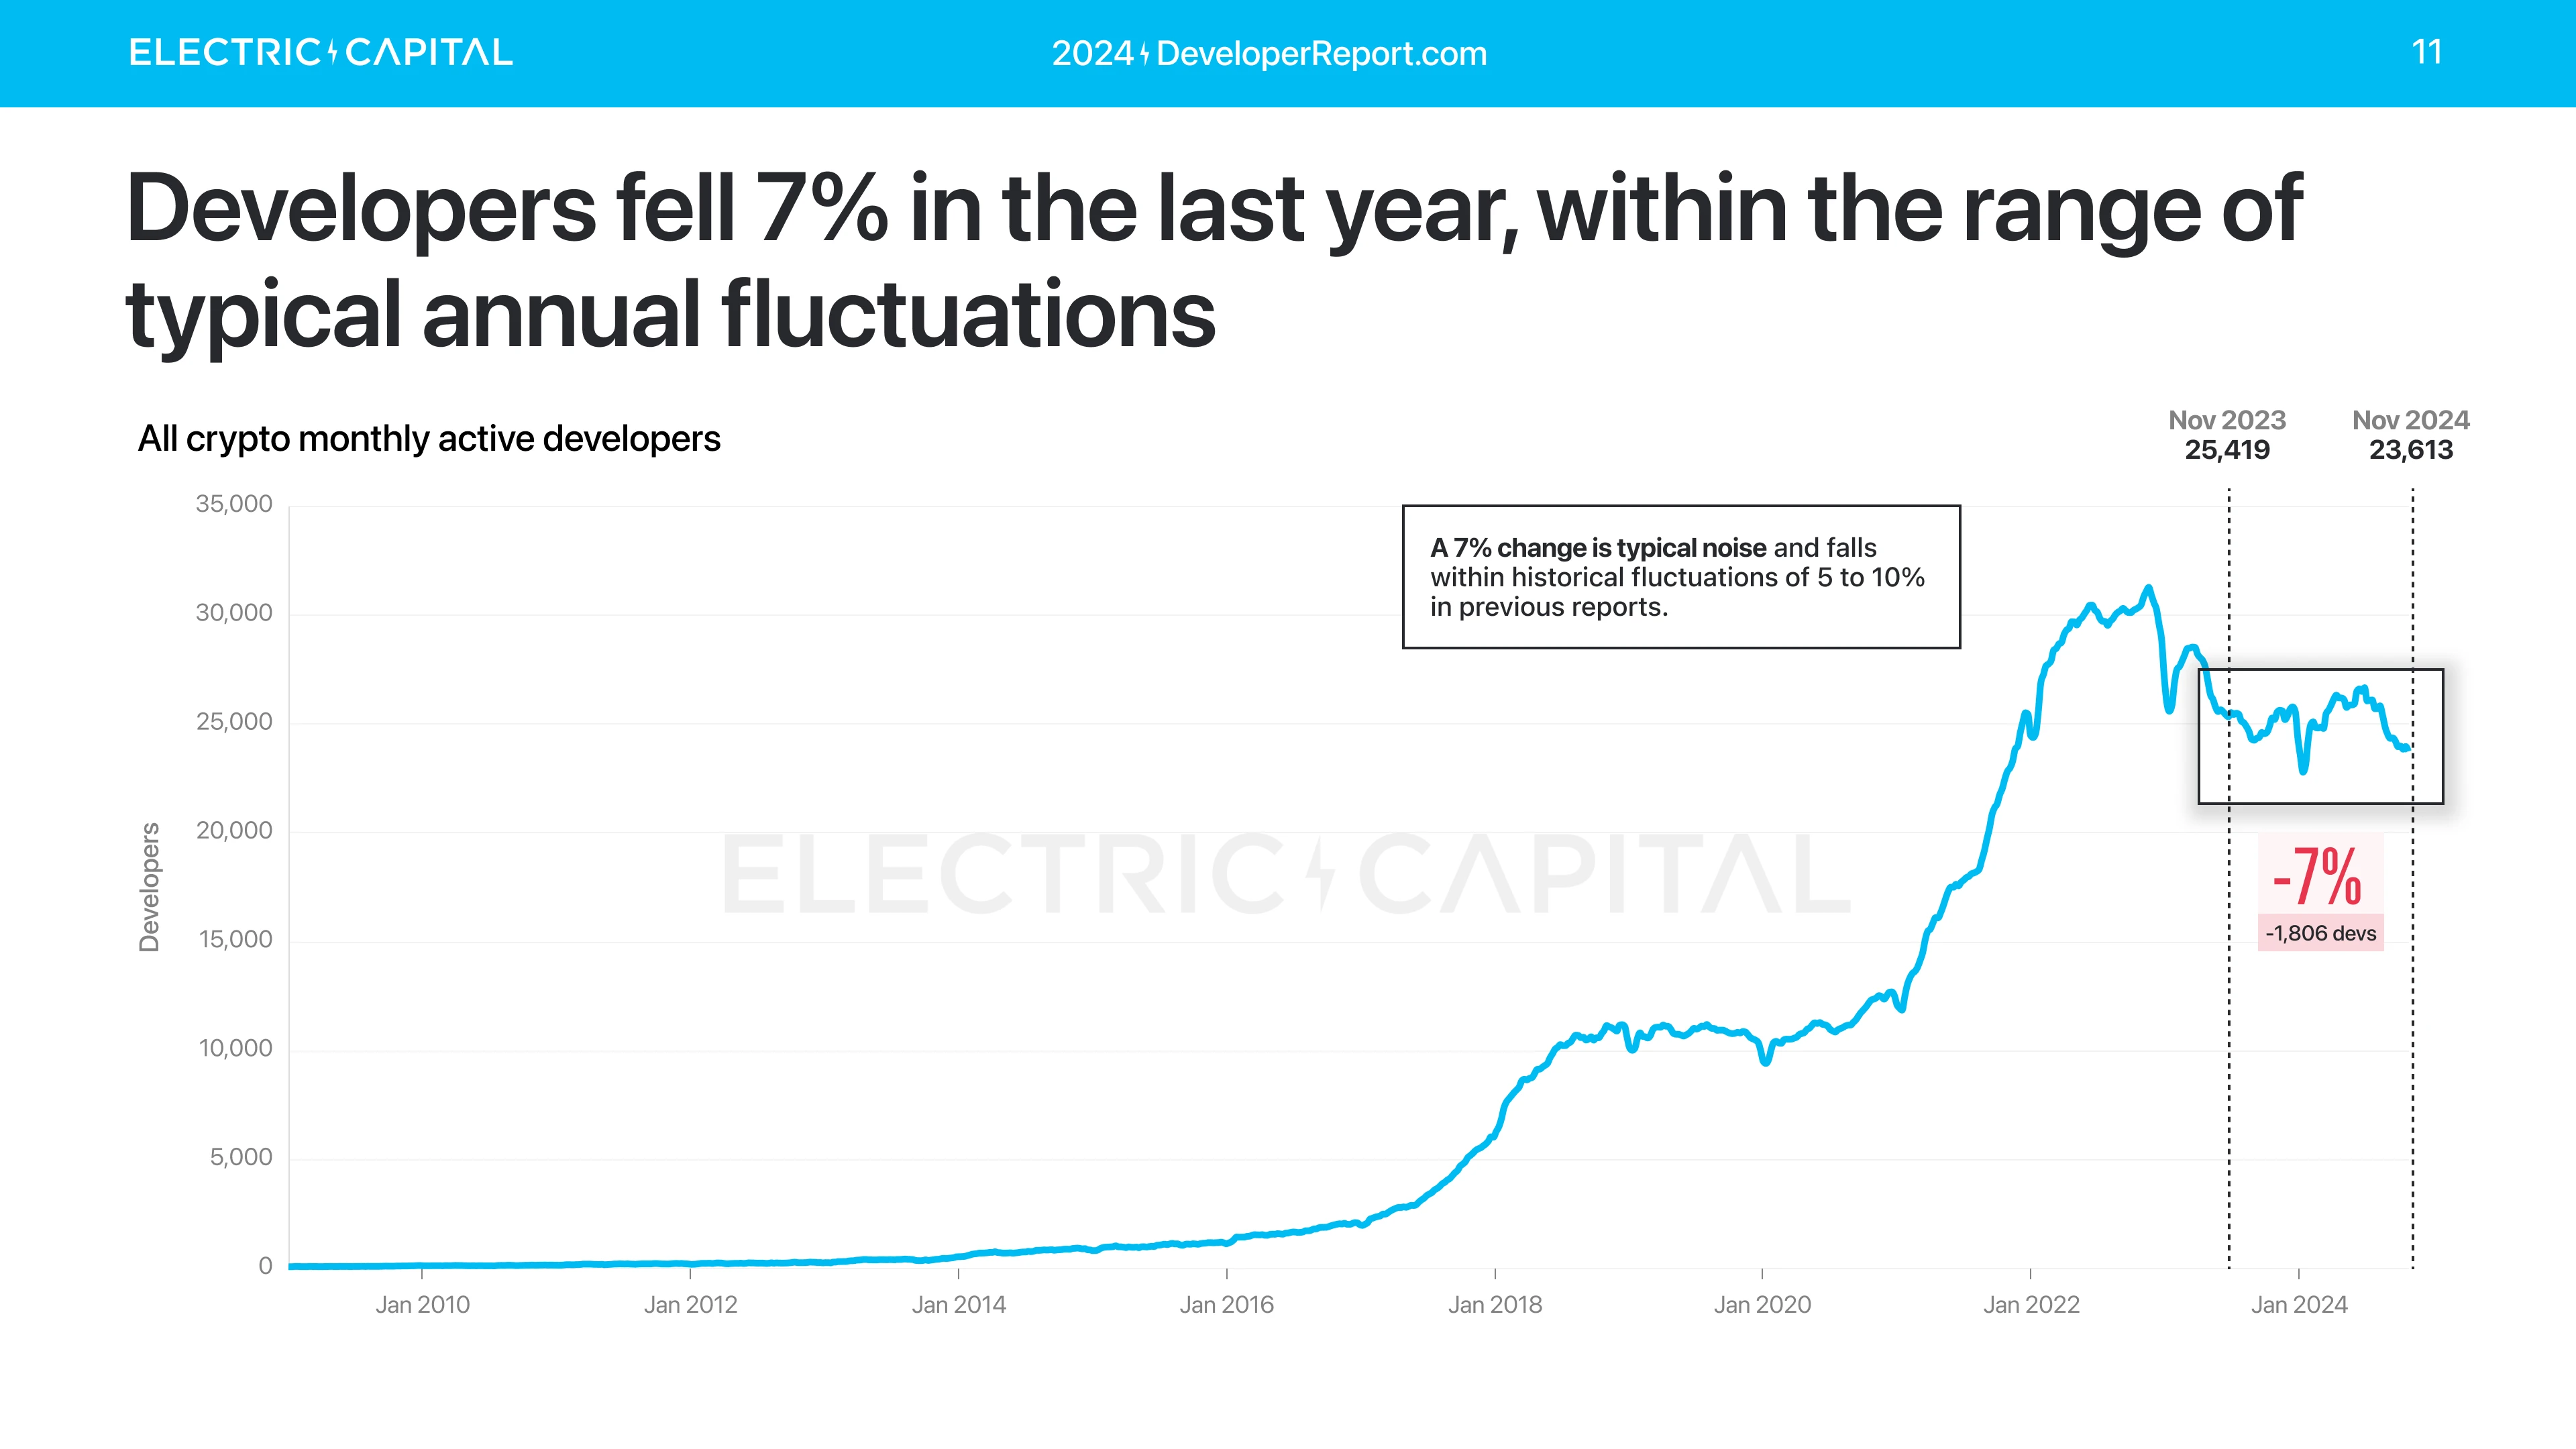
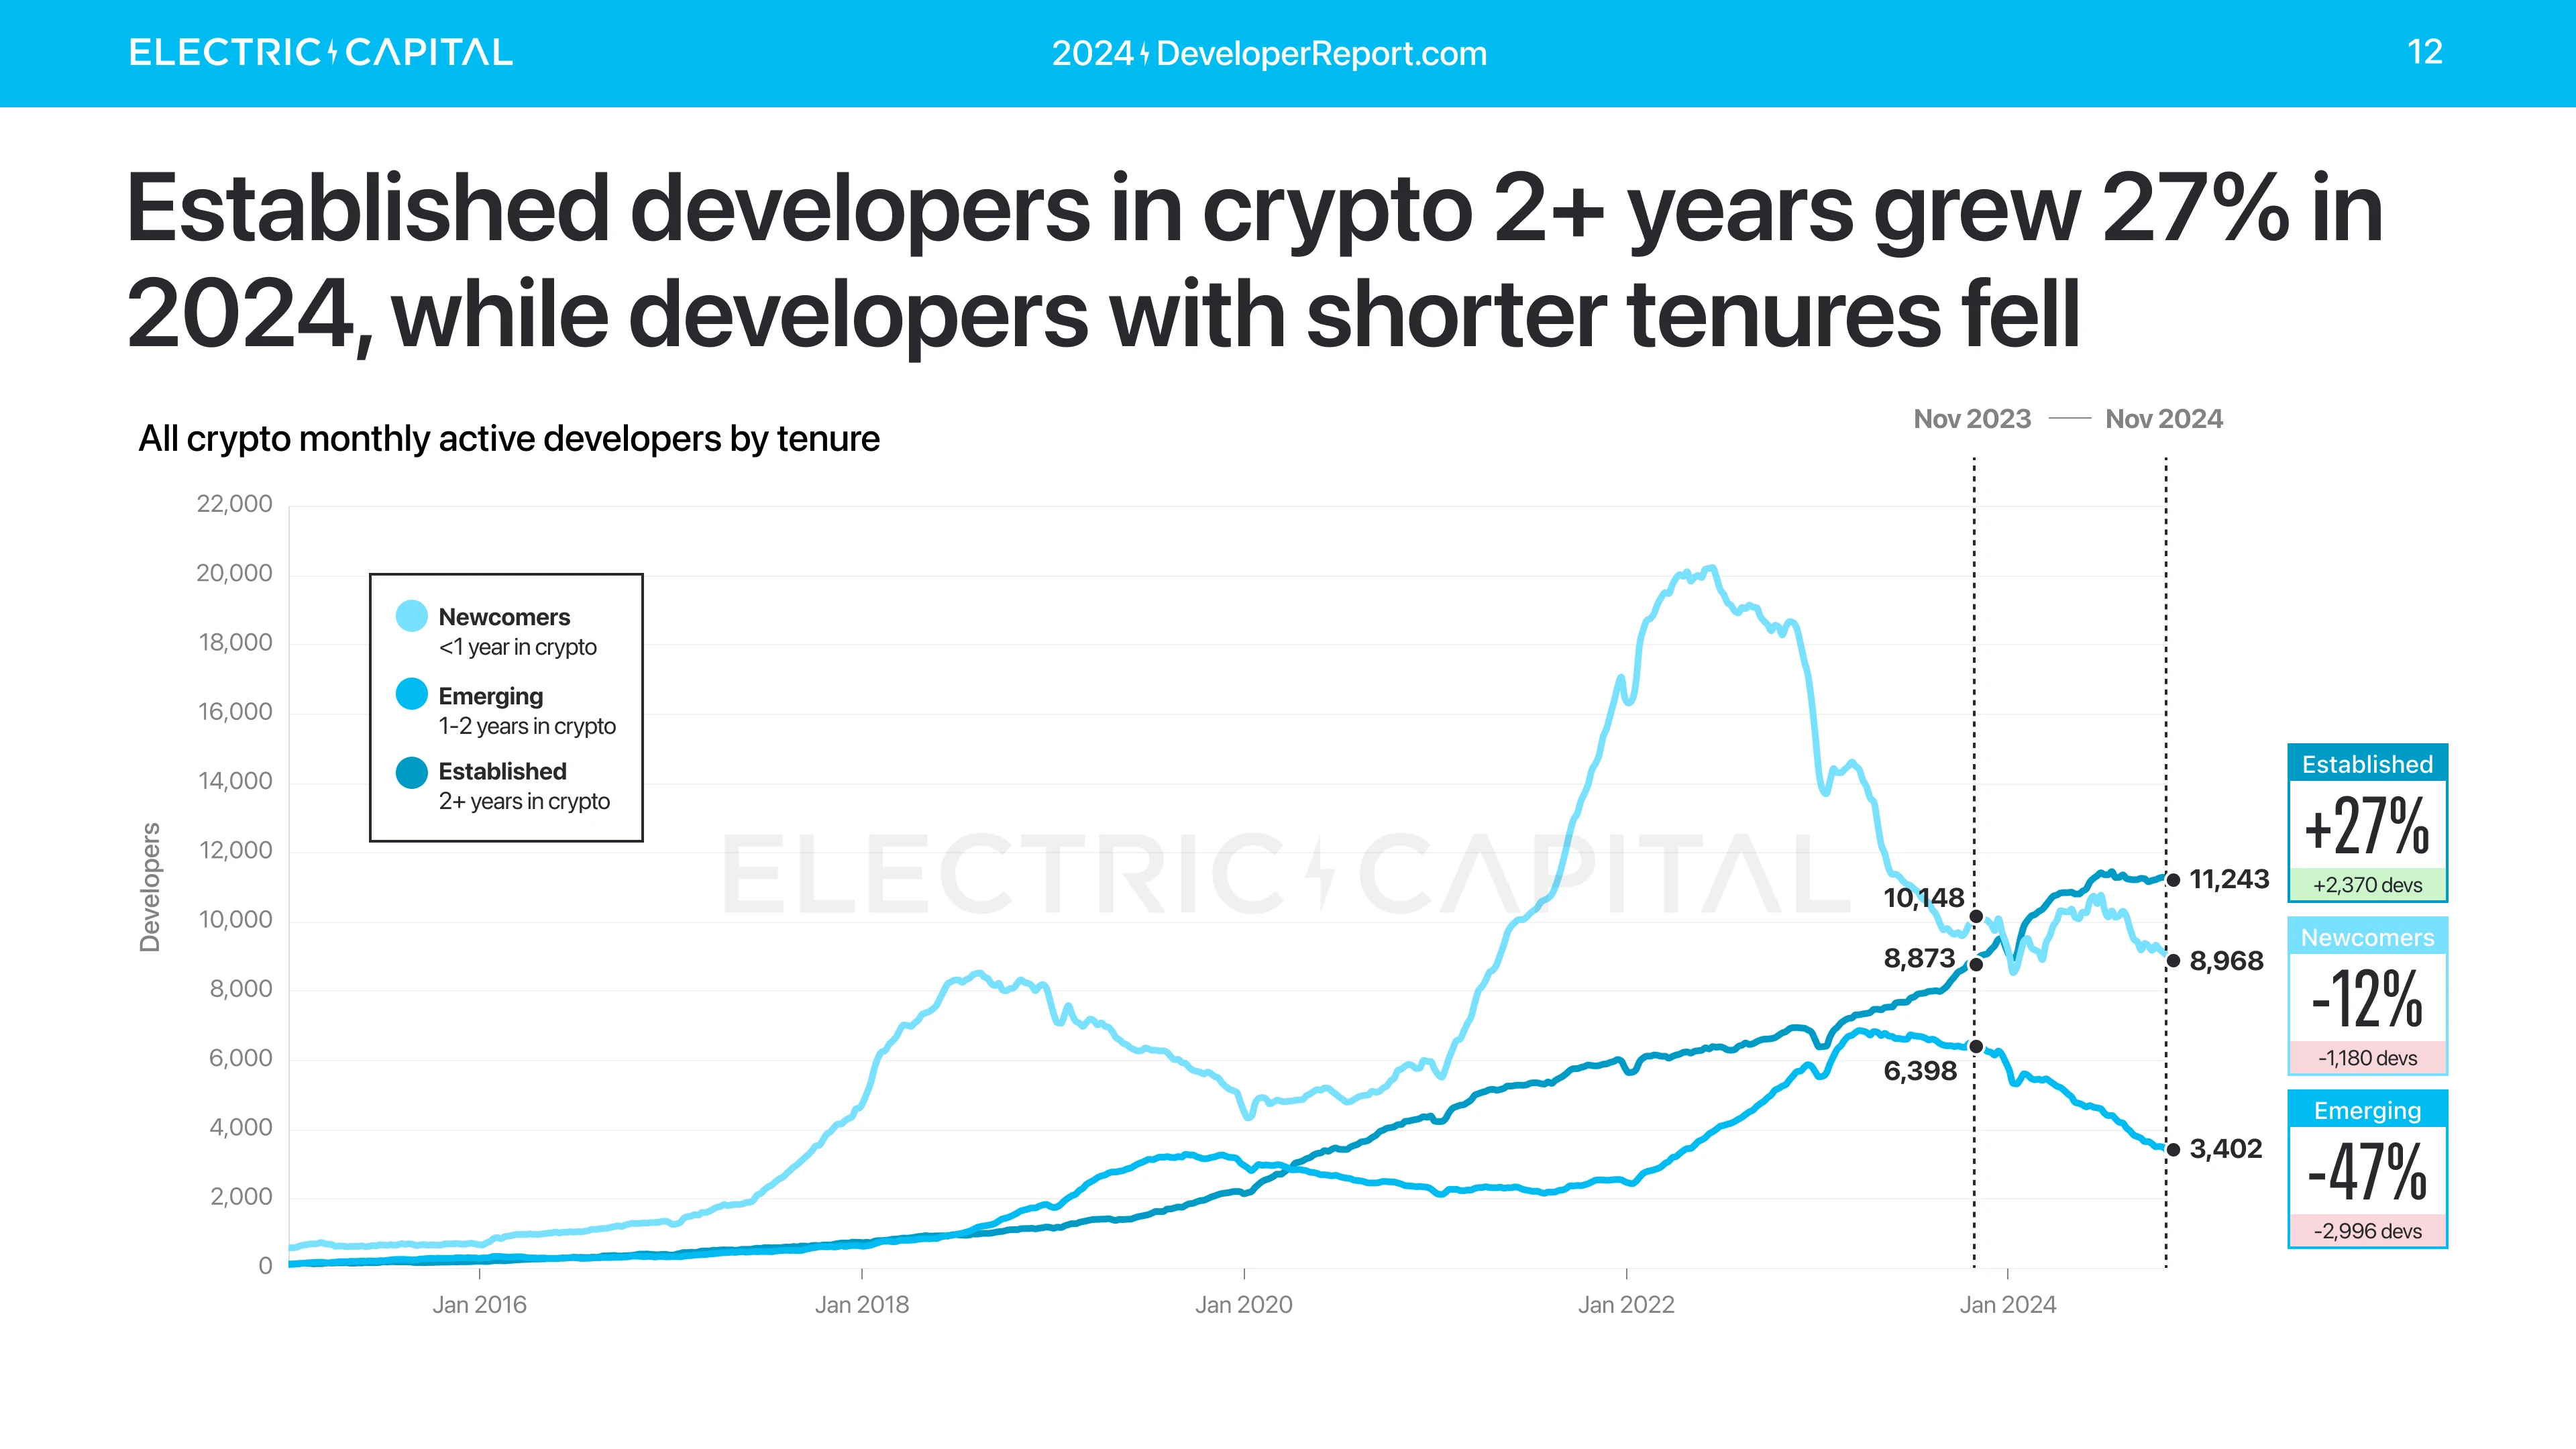
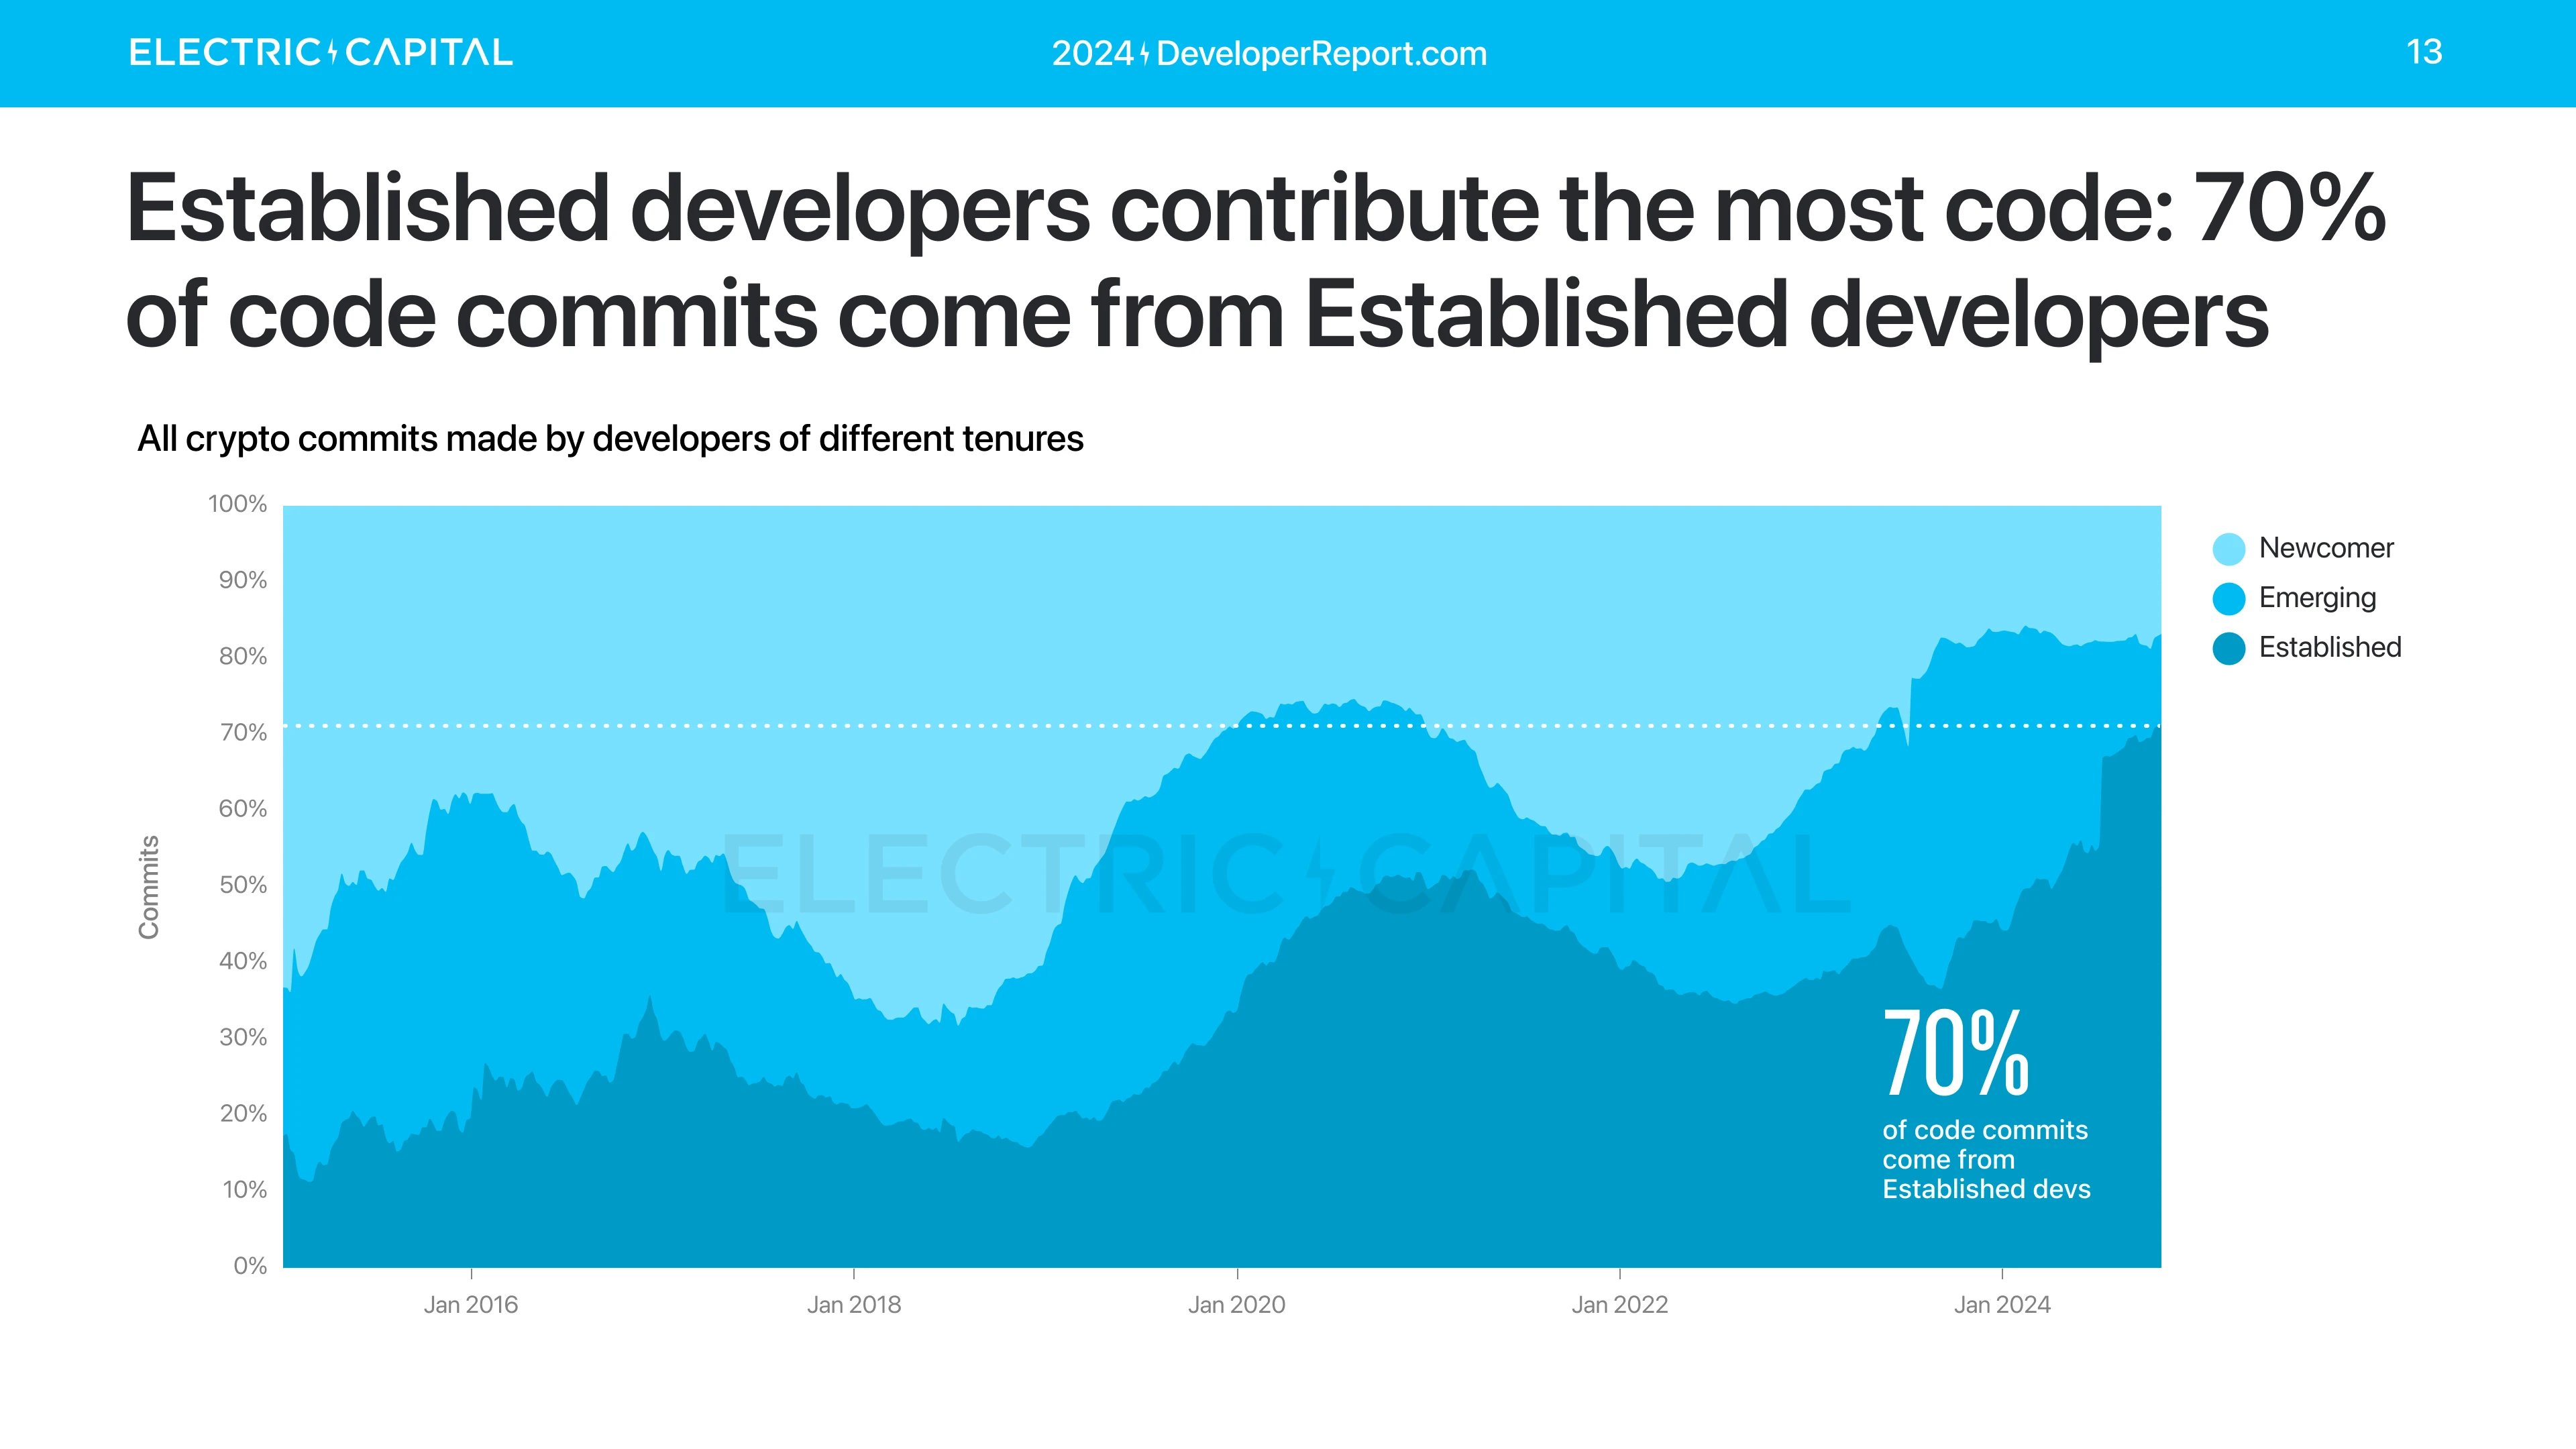
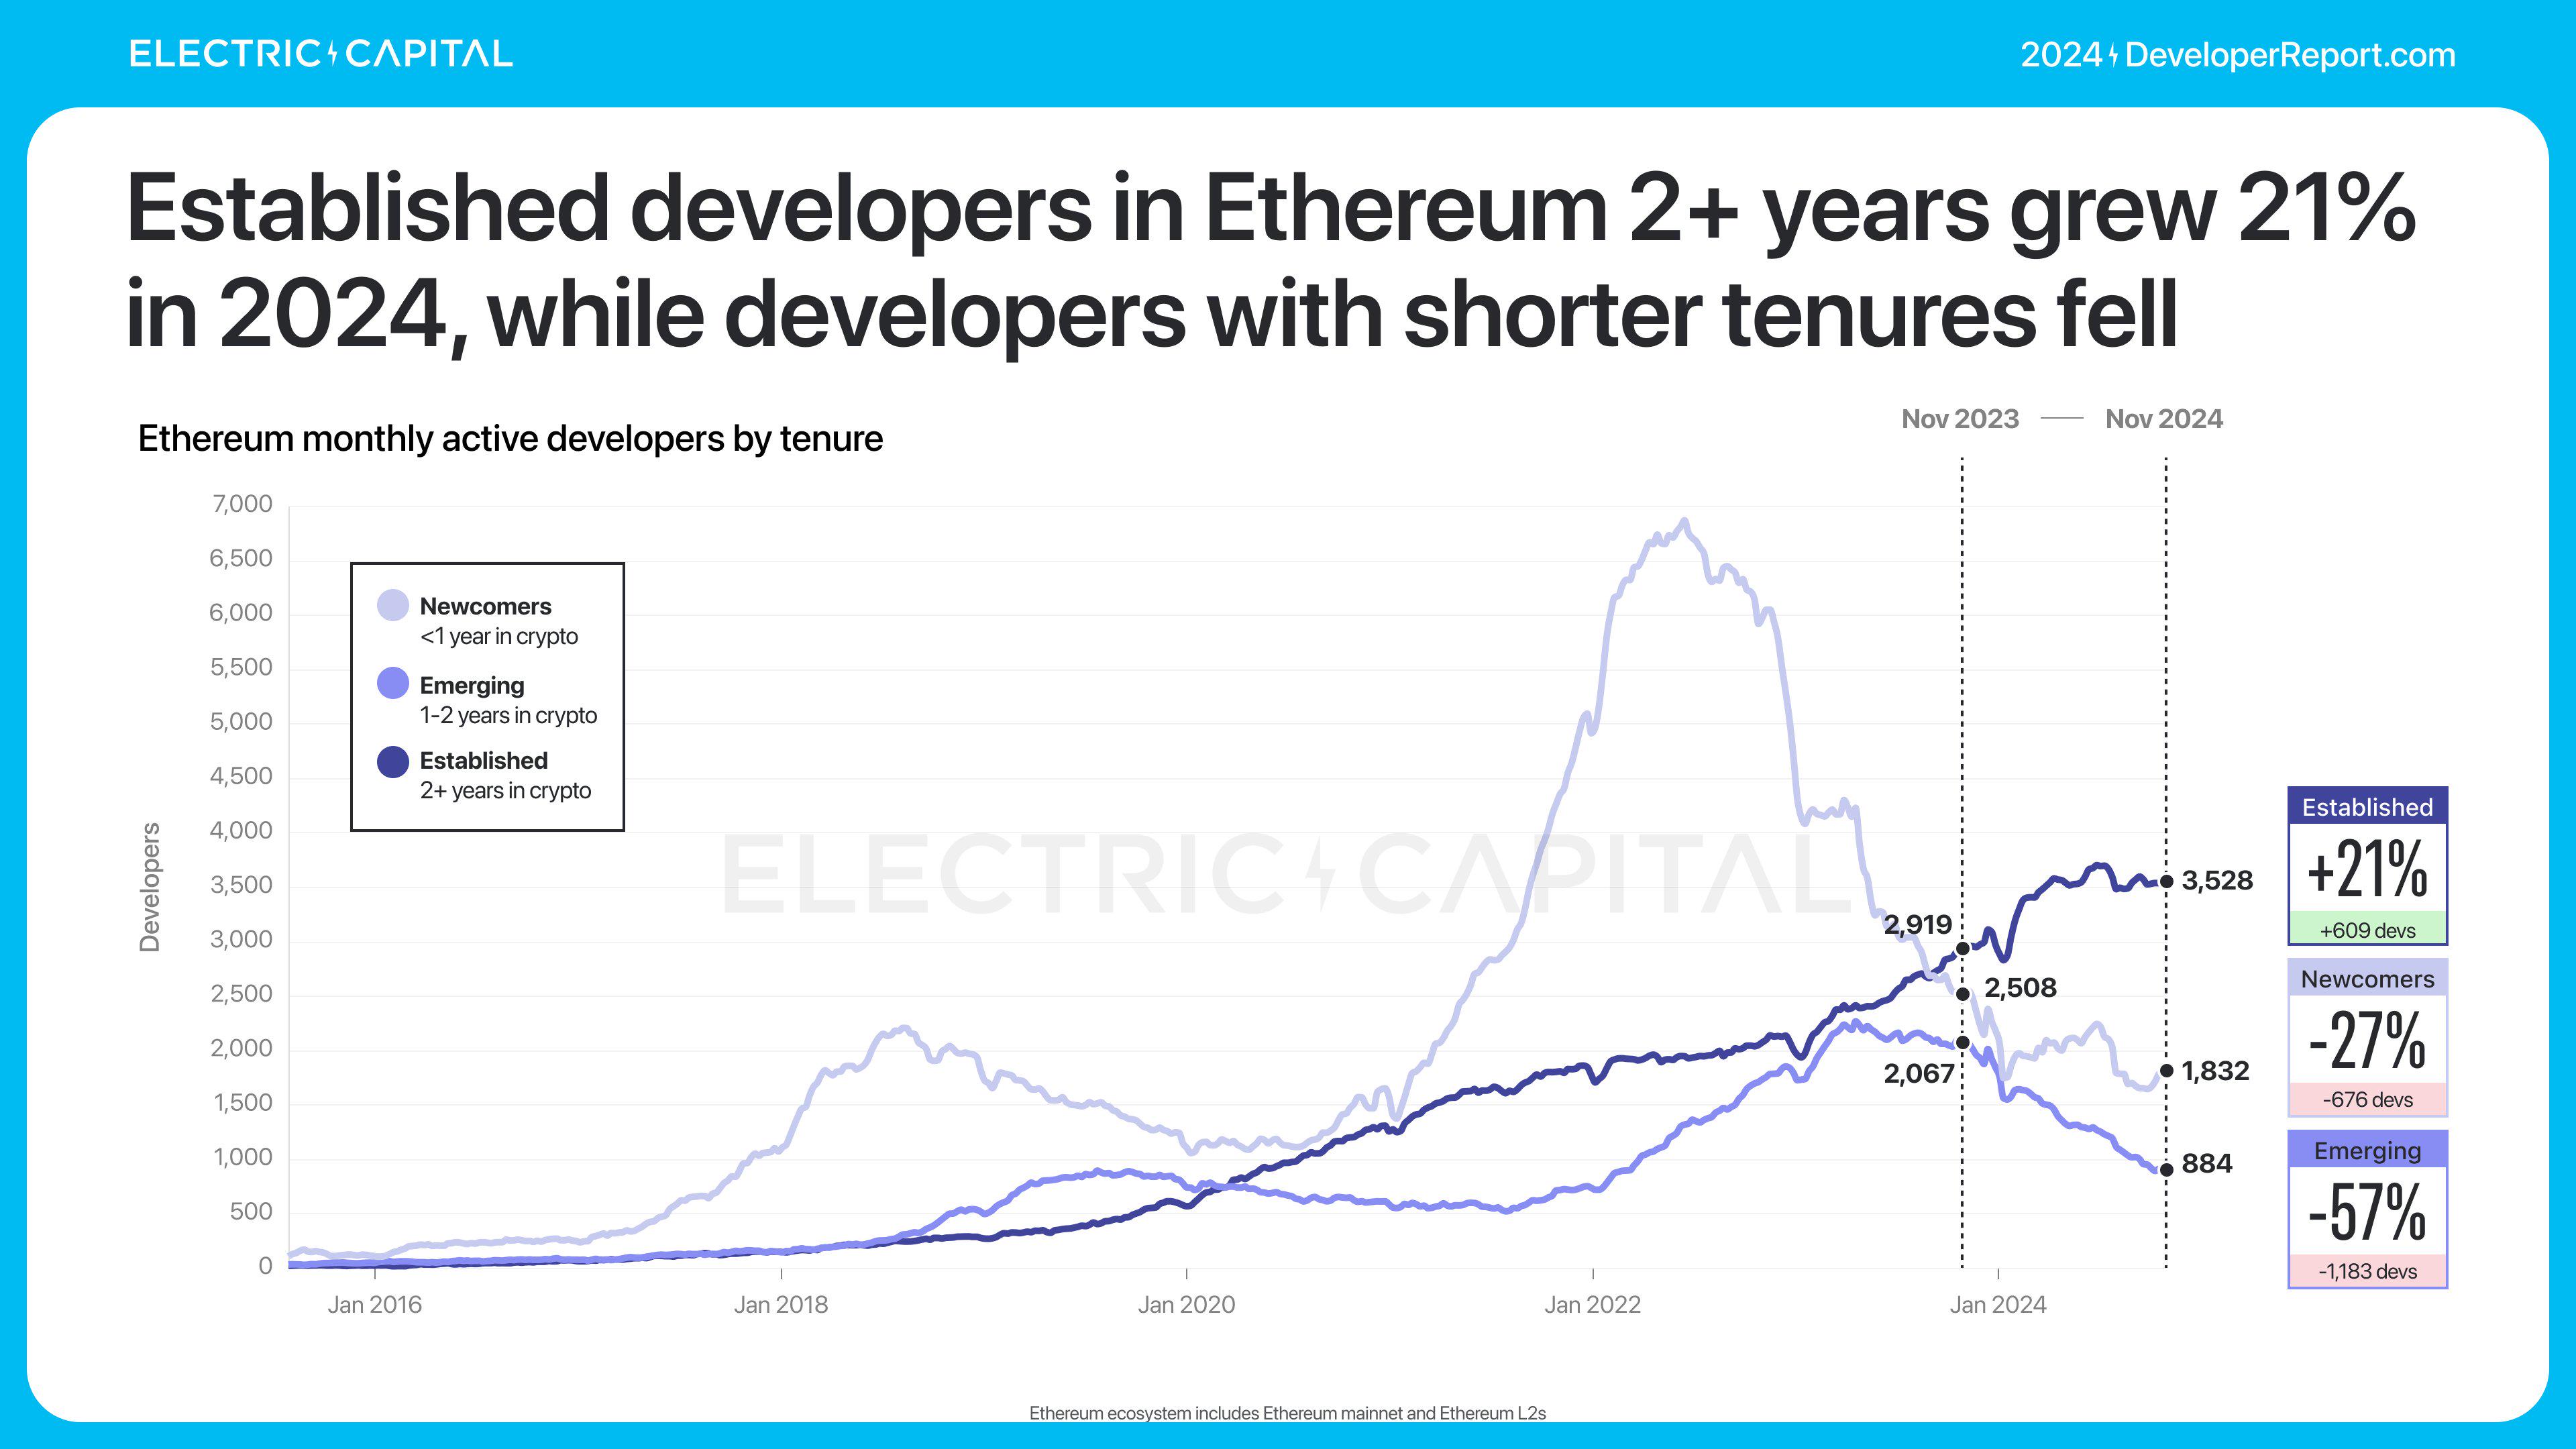
The number of monthly active developers decreased slightly last year, down 7%. The number of developers who have been in the crypto industry for more than 2 years increased by 27%. These senior developers drive the development of the industry as they contribute 70% of code commits.

Electric Capital's annual developer report: 39,000 new developers joined, more than half of Ethereum developers are committed to L2

Electric Capital's annual developer report: 39,000 new developers joined, more than half of Ethereum developers are committed to L2

Electric Capital's annual developer report: 39,000 new developers joined, more than half of Ethereum developers are committed to L2

In 2015, 81% of crypto developers were in North America and Europe, falling to 55% in 2024.

Electric Capital's annual developer report: 39,000 new developers joined, more than half of Ethereum developers are committed to L2

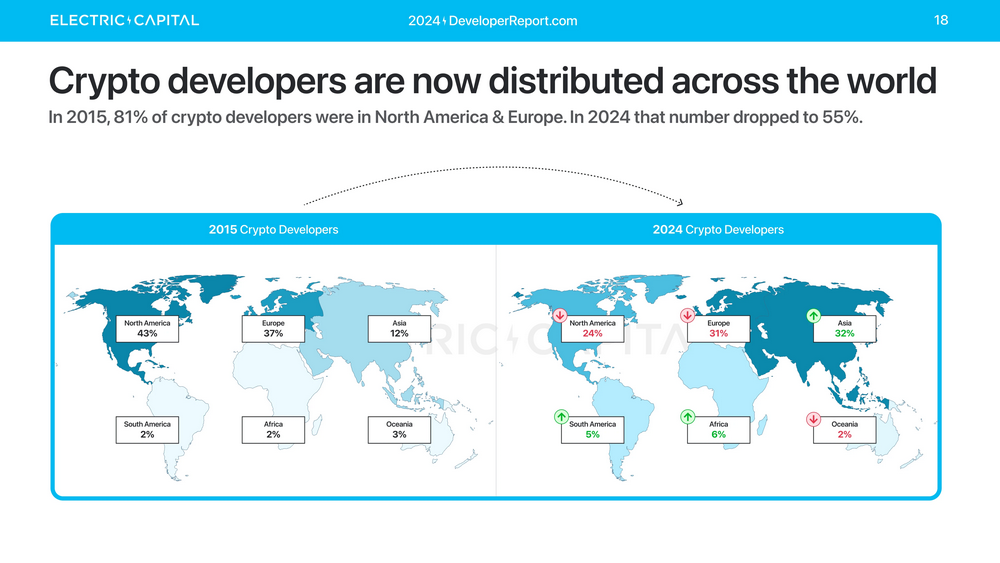
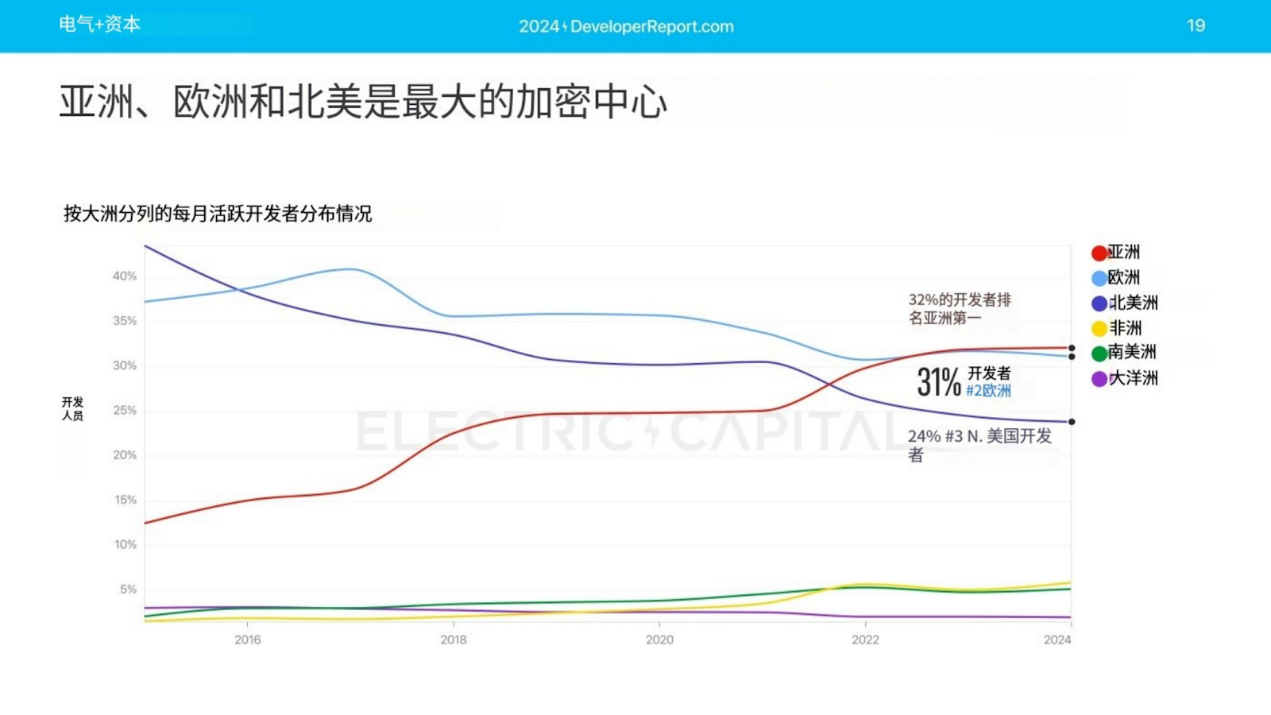
Asia is now the top continent by developer share. One-third of crypto developers live in Asia, with Europe in second place. North America has fallen from first to third since 2015.

Electric Capital's annual developer report: 39,000 new developers joined, more than half of Ethereum developers are committed to L2

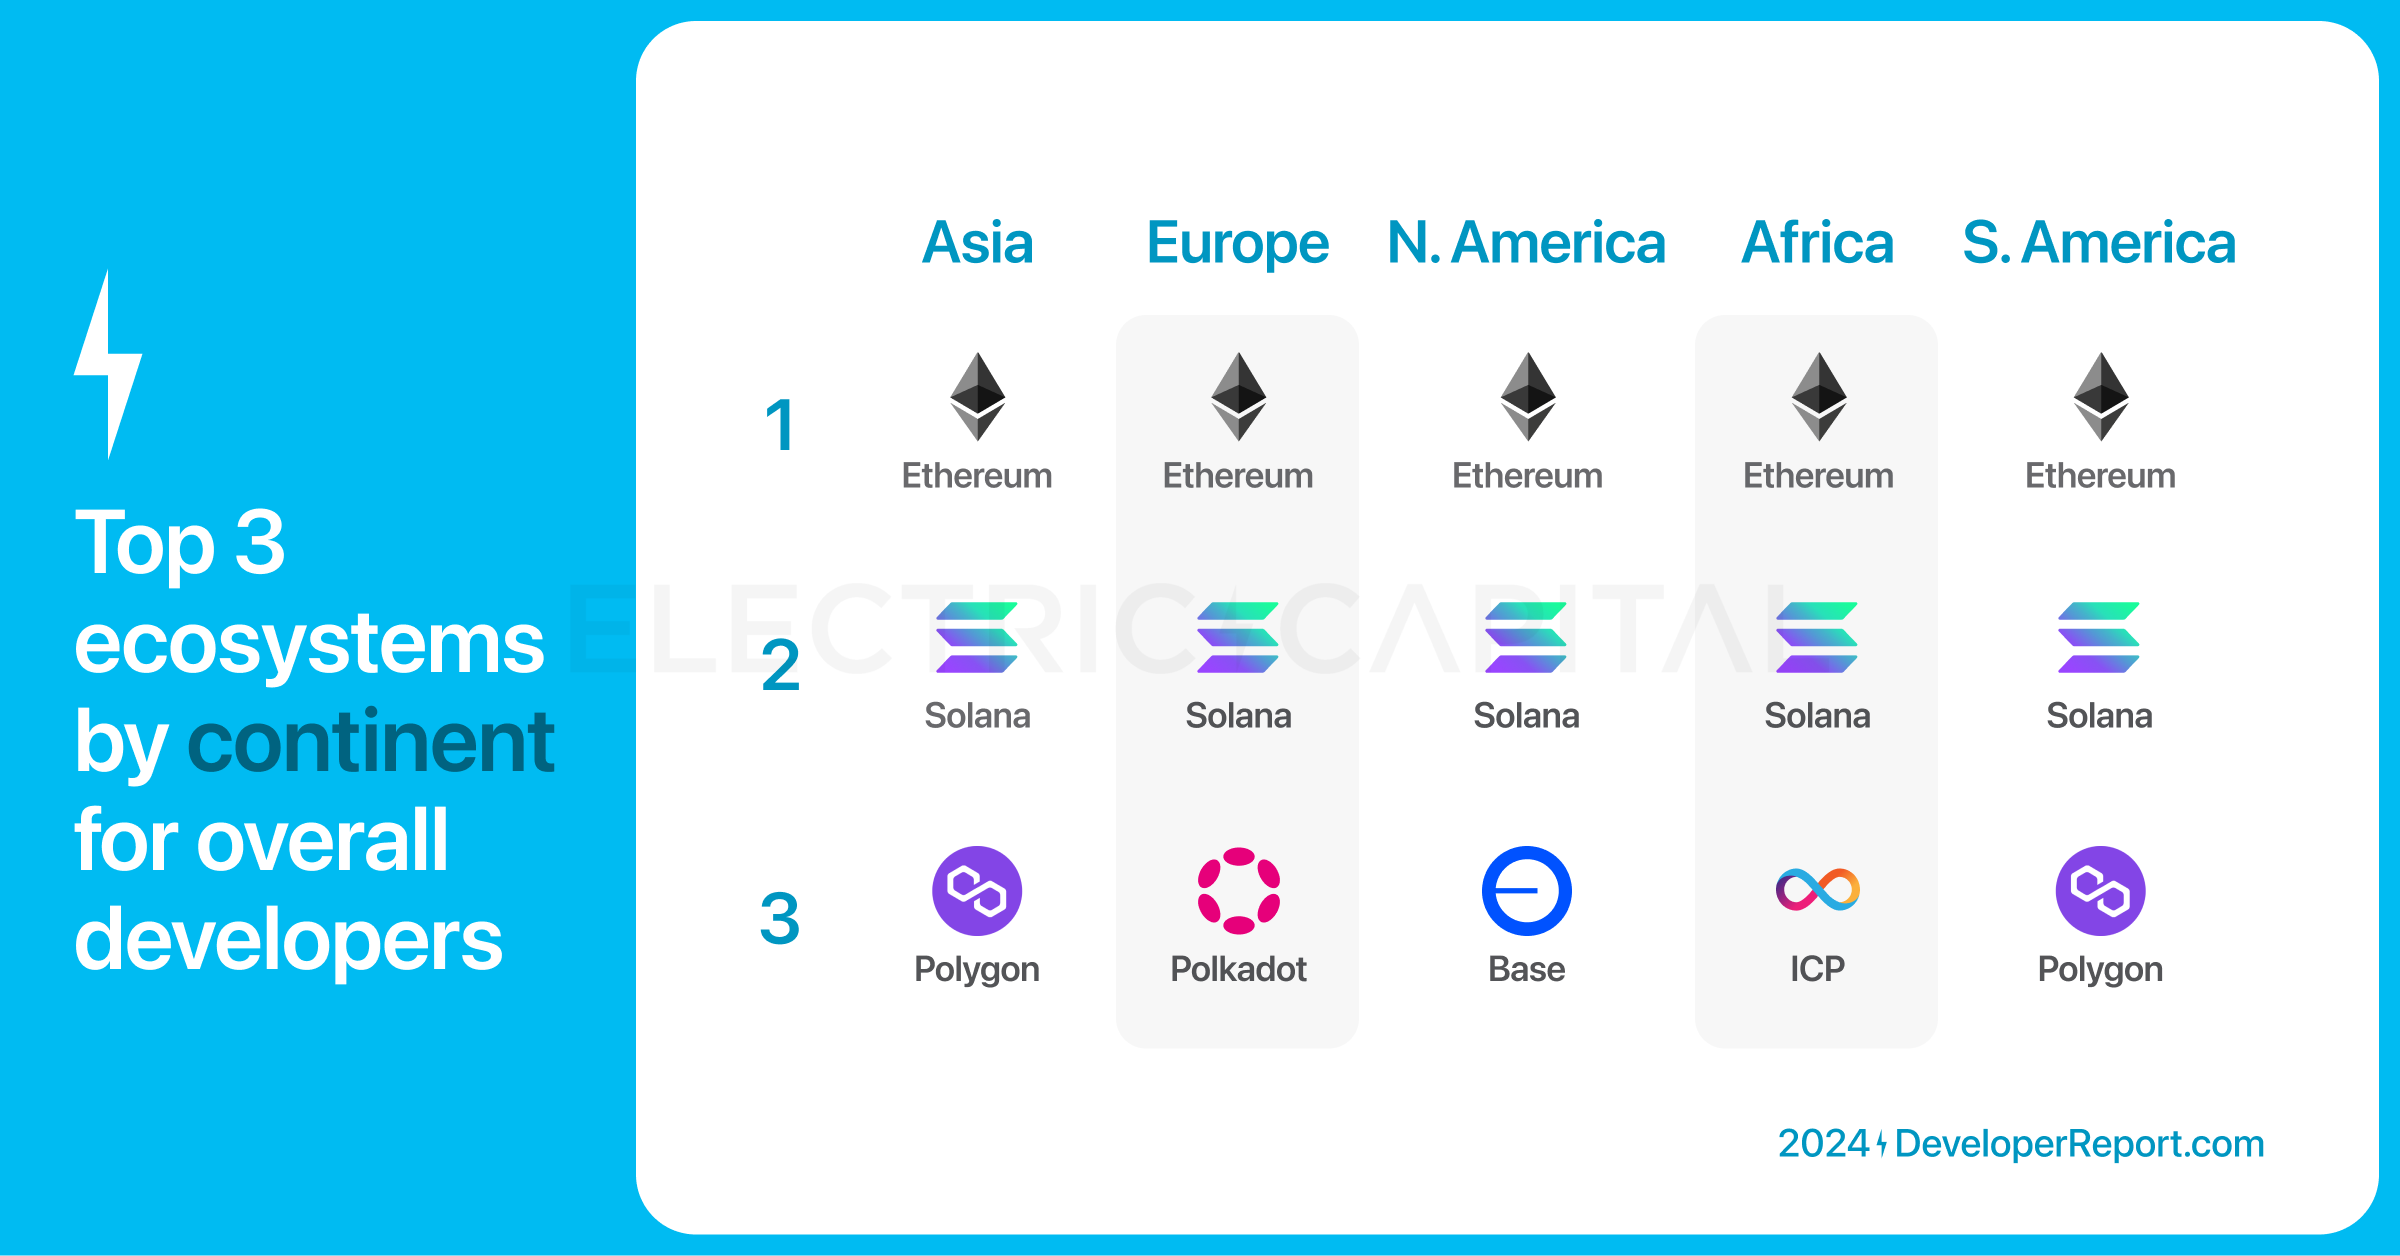
Ethereum is the top ecosystem by developer share across all continents, Solana is second, Polygon is third in Asia and South America, Polkadot is third in Europe, Base is third in North America, and DFINITY is third in Africa.

Electric Capital's annual developer report: 39,000 new developers joined, more than half of Ethereum developers are committed to L2

The United States, India, the United Kingdom, China, and Canada have the largest crypto developer communities in the world.

Electric Capital's annual developer report: 39,000 new developers joined, more than half of Ethereum developers are committed to L2

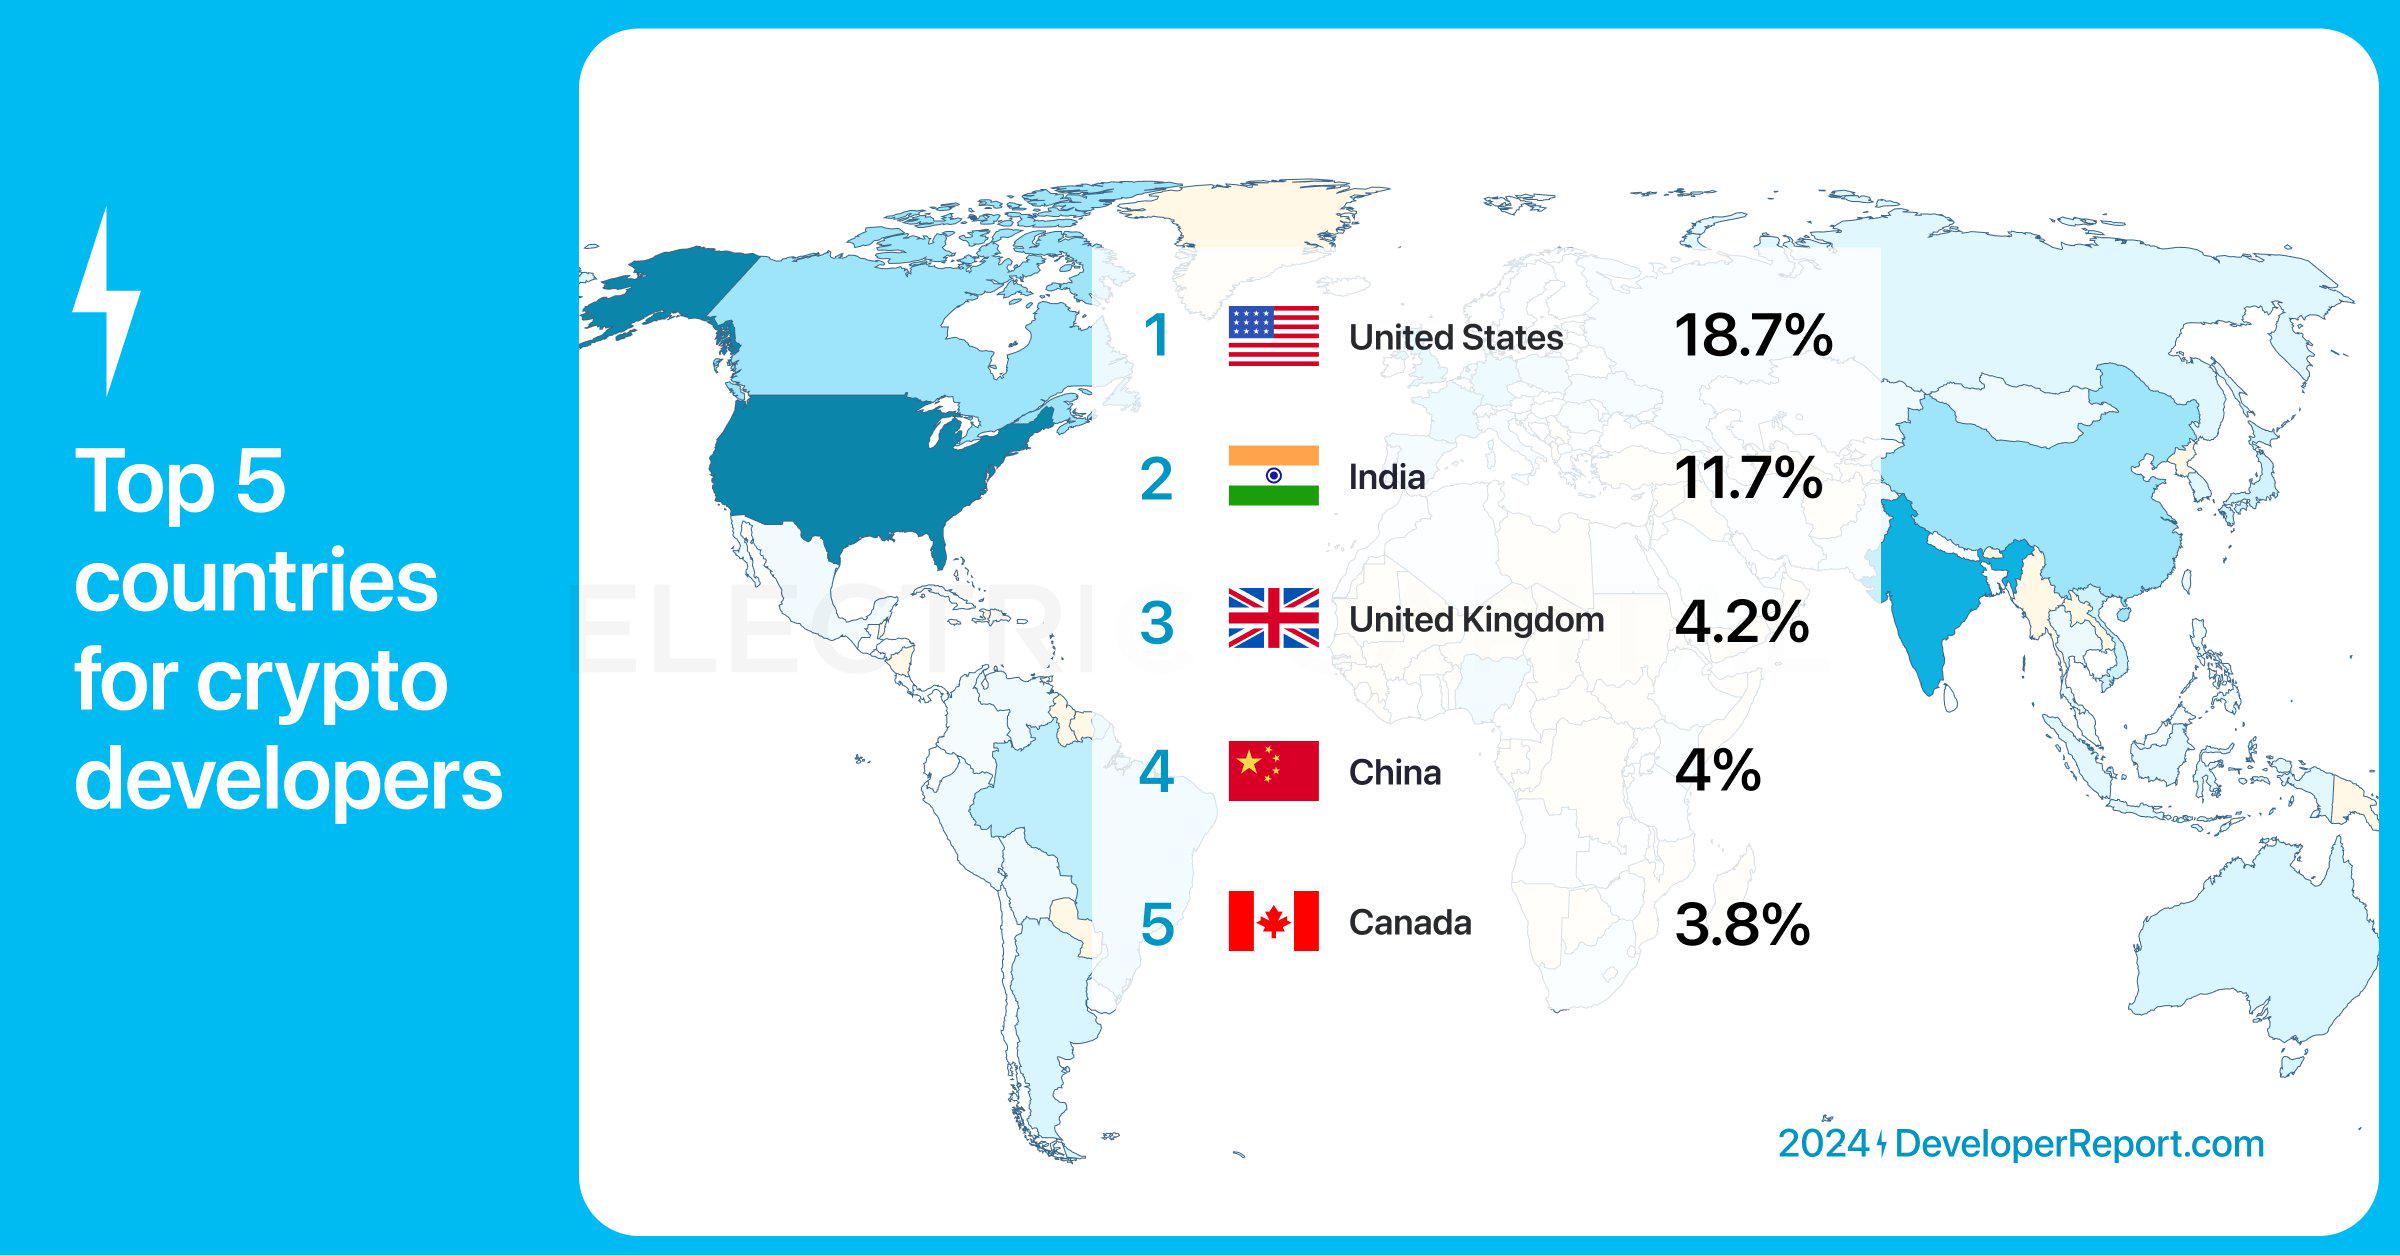
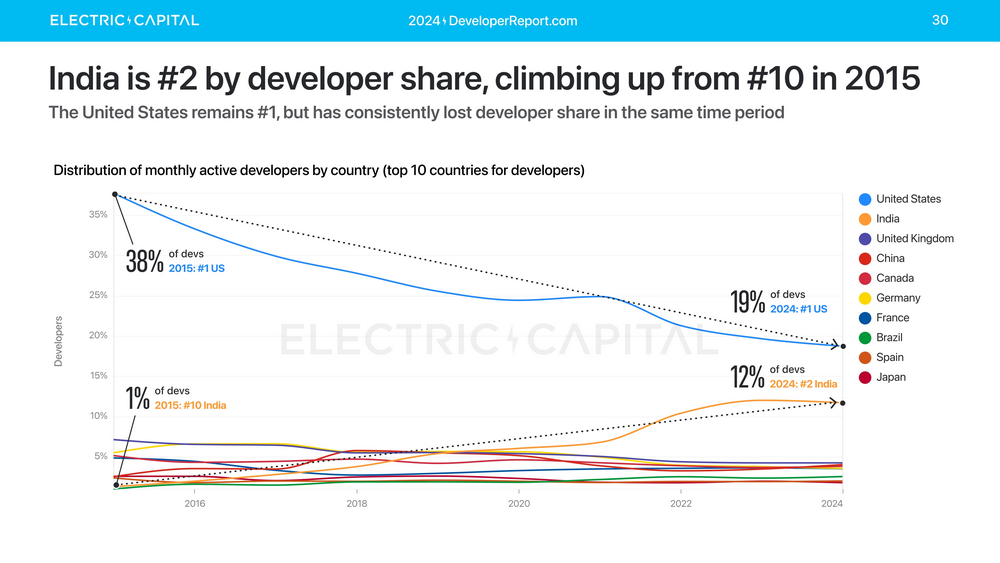
The United States still ranks first in terms of crypto developer share, but has continued to decline since 2015. India jumped from 10th to 2nd place.

Electric Capital's annual developer report: 39,000 new developers joined, more than half of Ethereum developers are committed to L2

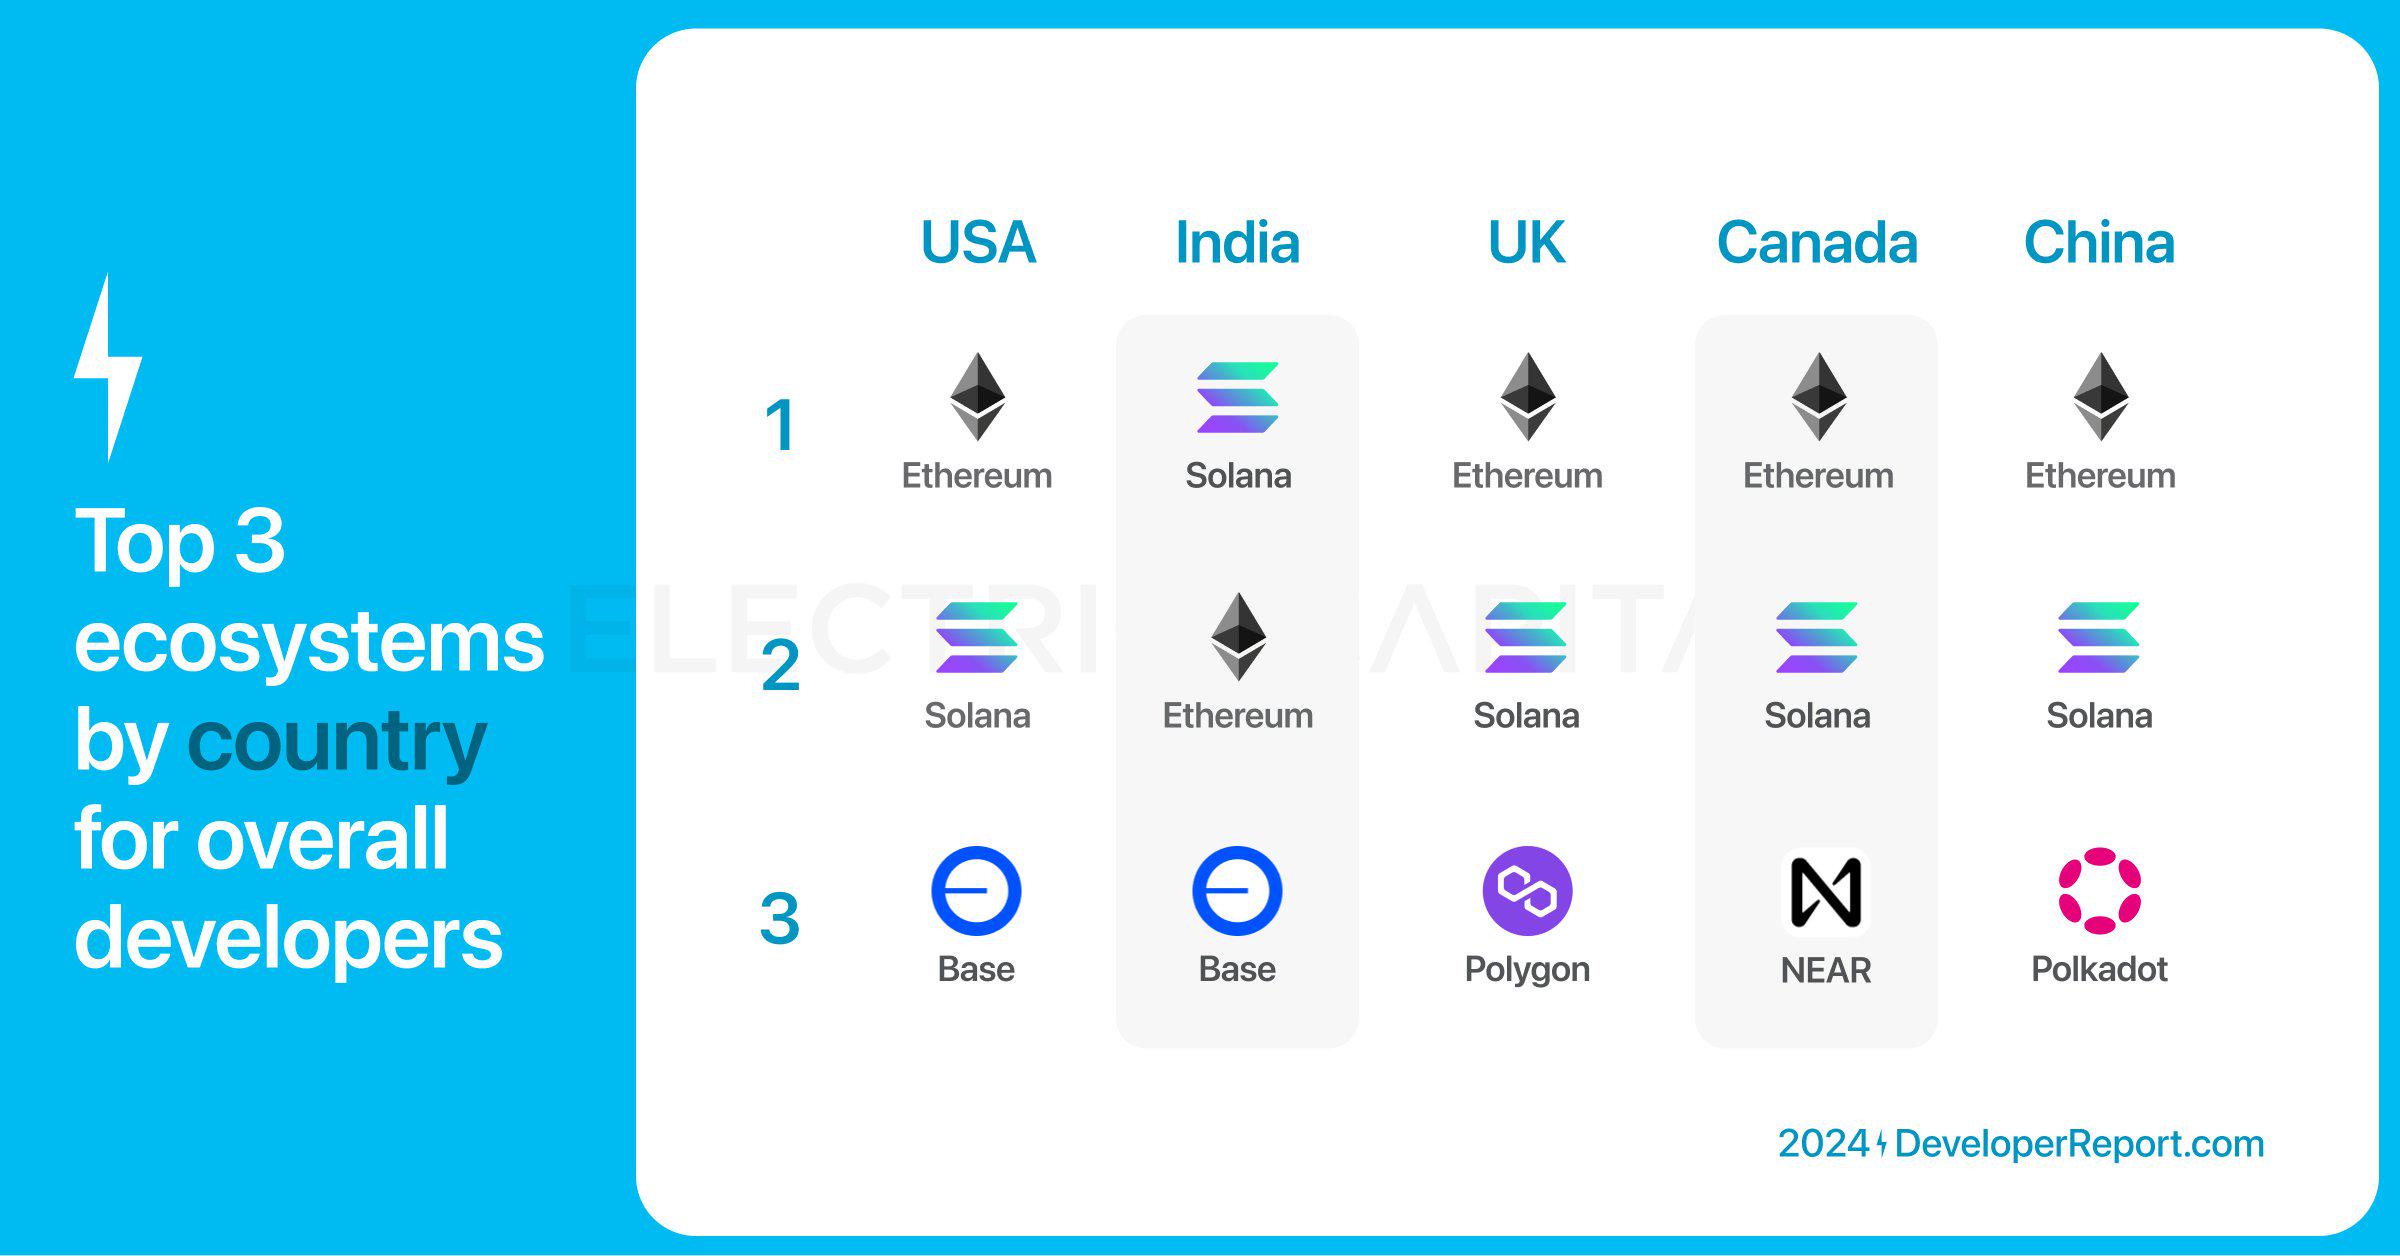
Top 3 ecosystems by country developer share:

  • Ethereum ranks first in the United States, United Kingdom, China and Canada, and second in India
  • Solana is No. 1 in India, No. 2 elsewhere
  • Base ranks third in the United States and India
  • Polygon ranks third in the UK
  • NEAR Protocol ranks third in Canada
  • Polkadot ranks third in China

Electric Capital's annual developer report: 39,000 new developers joined, more than half of Ethereum developers are committed to L2

In 2024, India surpassed the United States to become the country with the most new developers, with 17% of new developers coming from India.

Electric Capital's annual developer report: 39,000 new developers joined, more than half of Ethereum developers are committed to L2

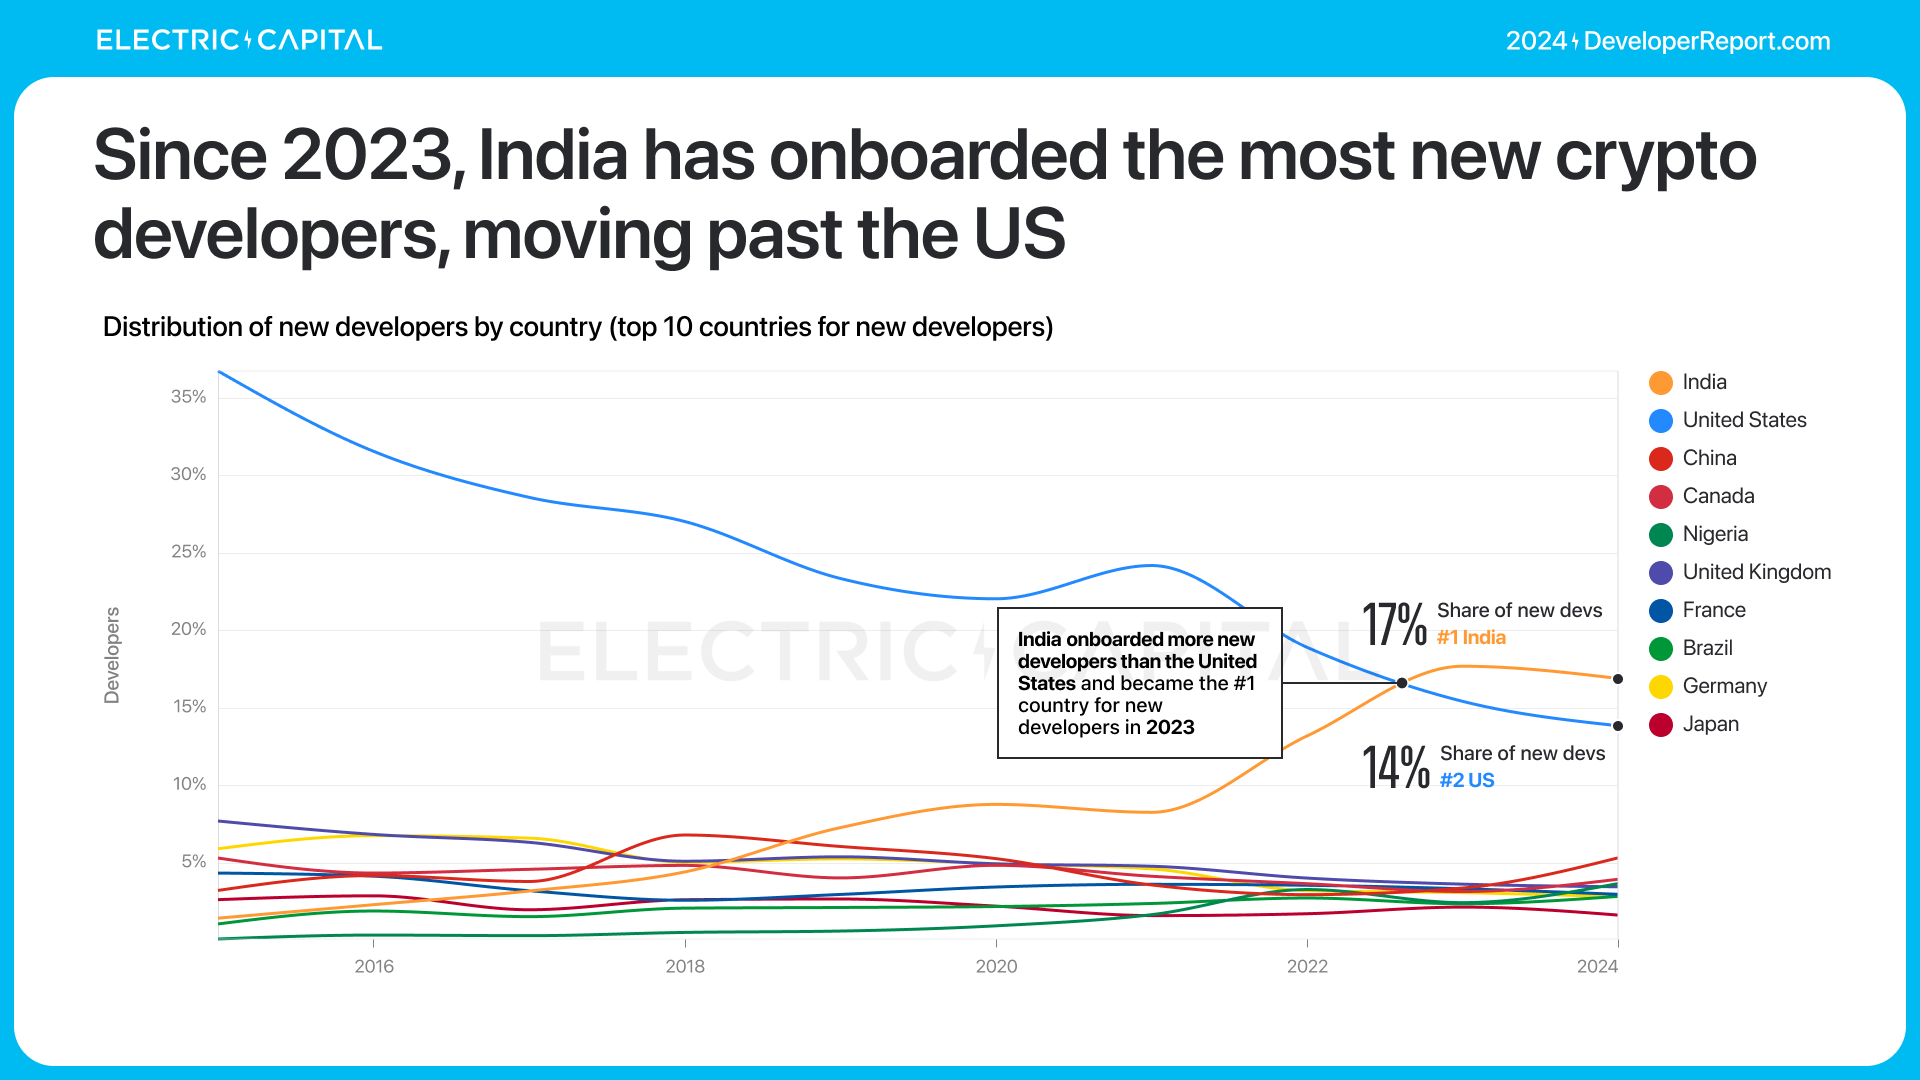
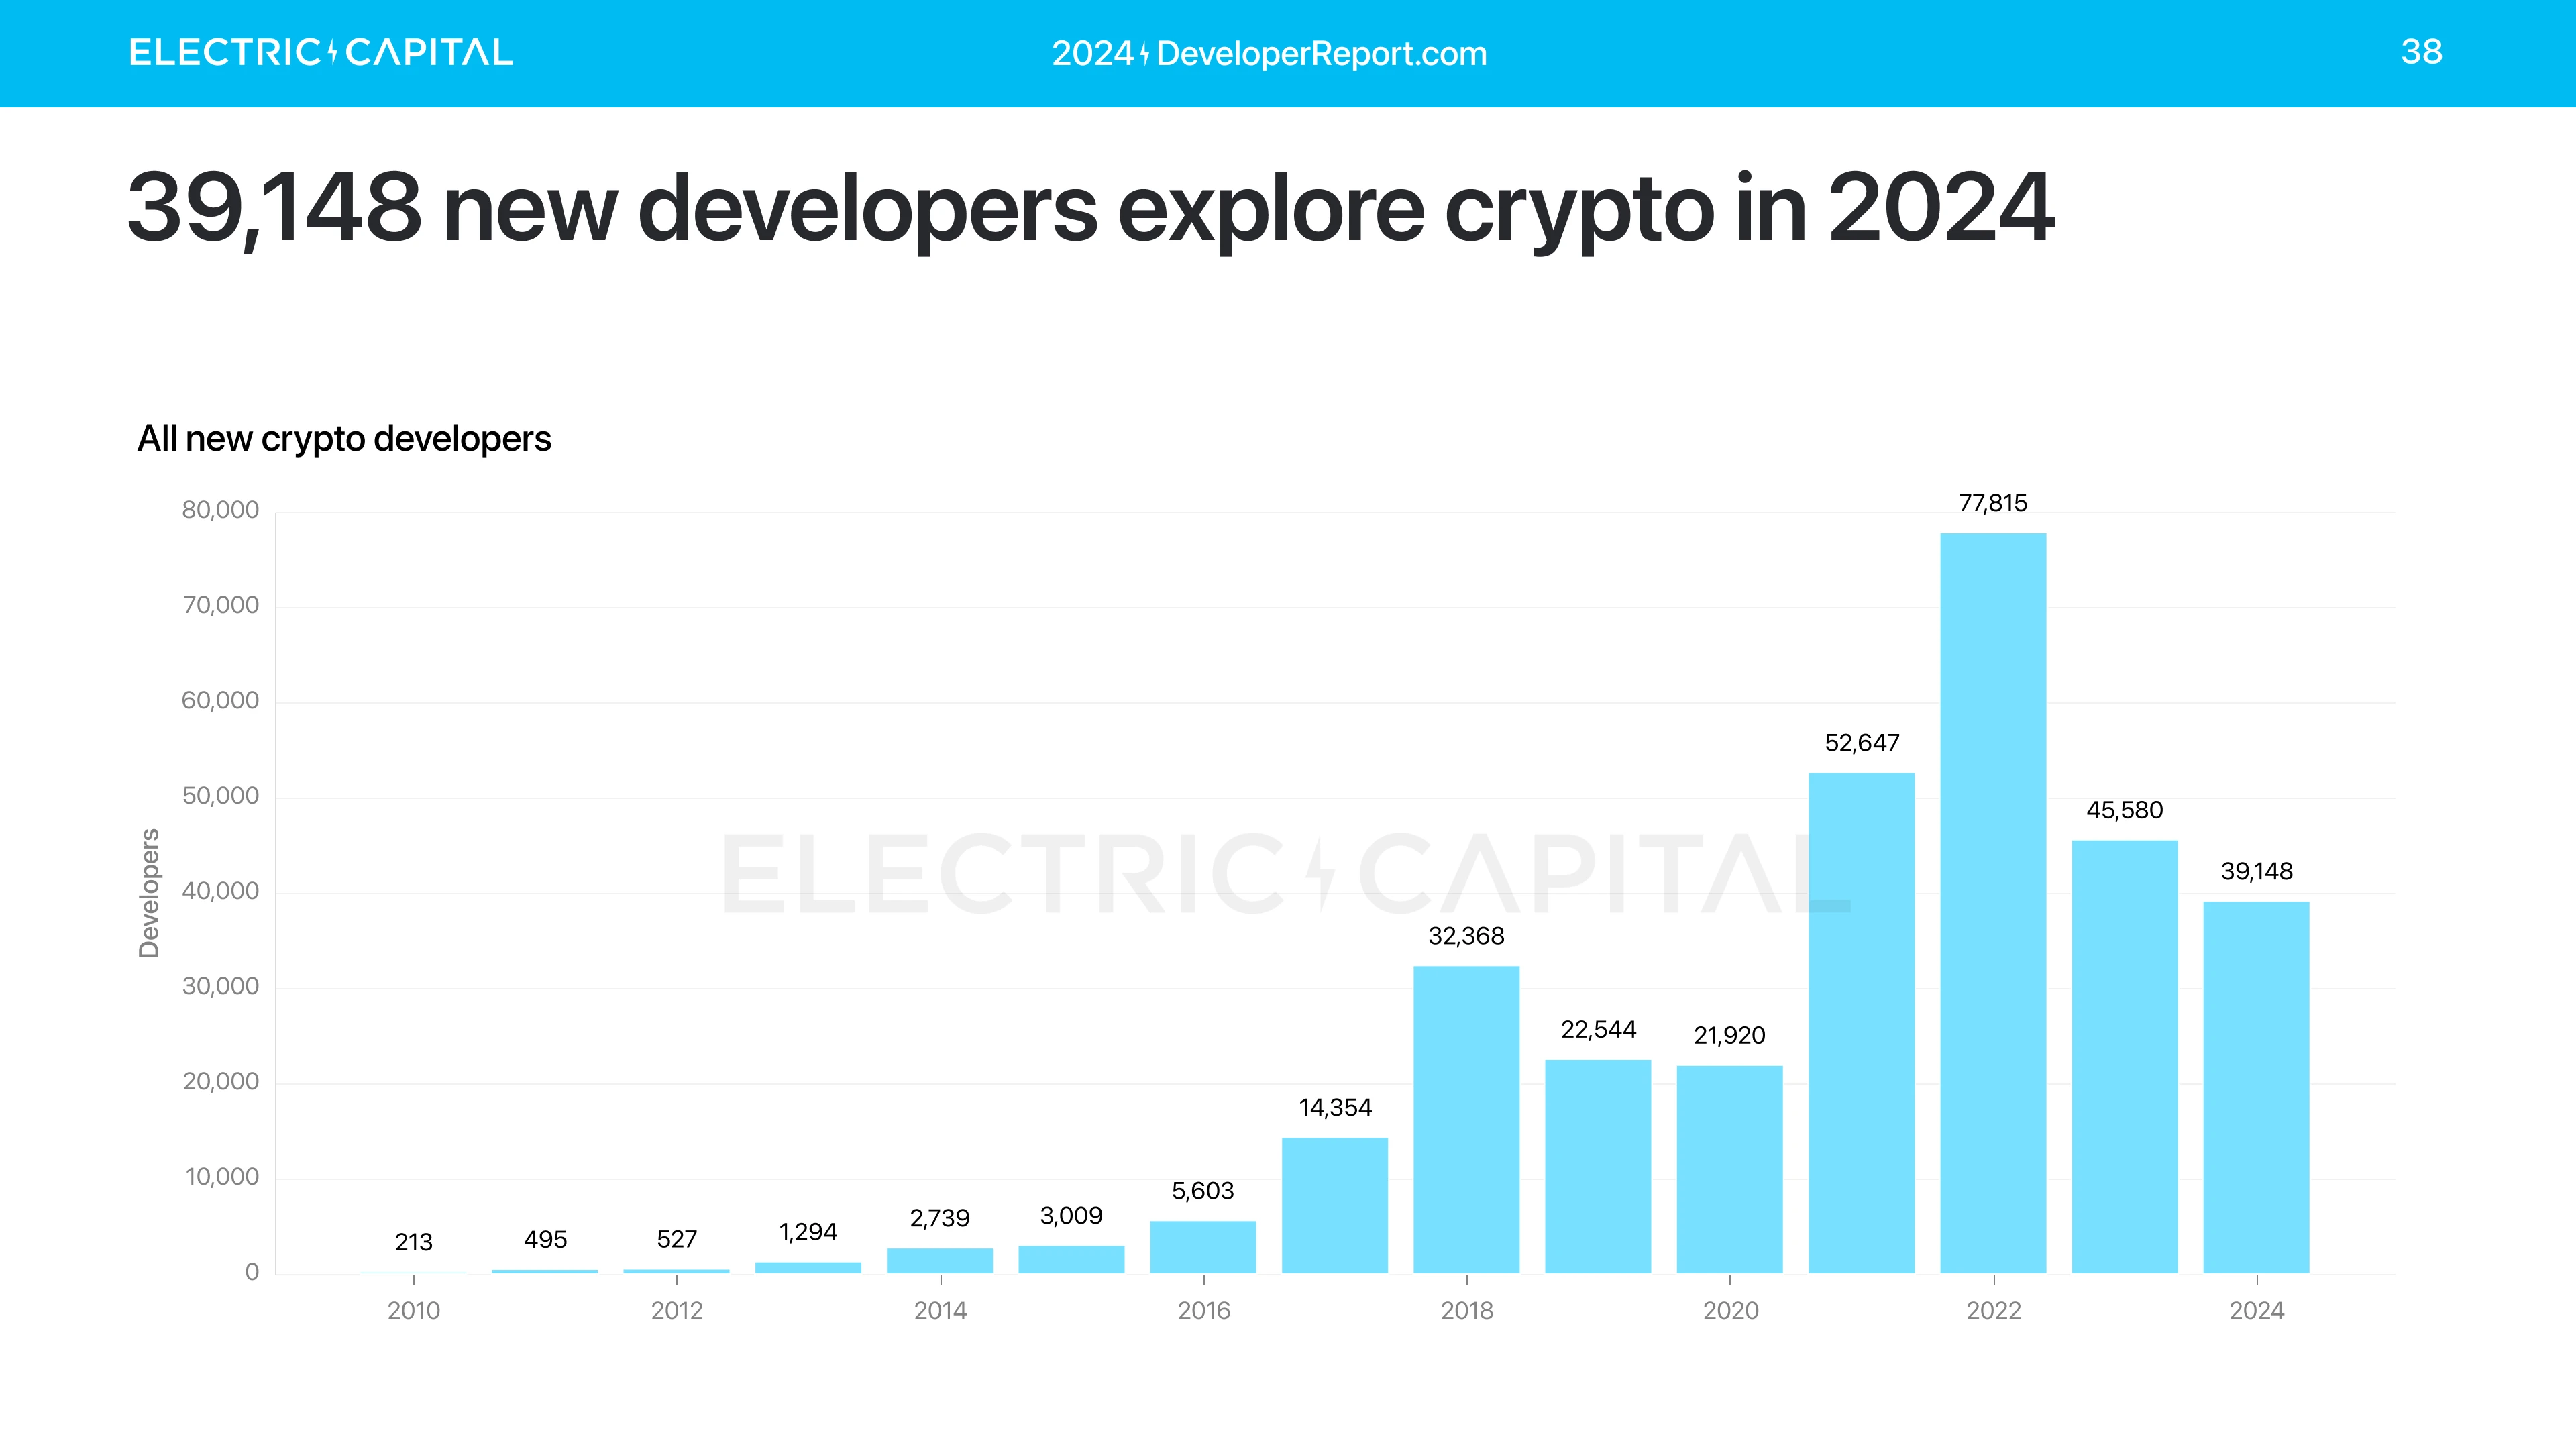
39,148 new developers will be involved in cryptocurrency in 2024.

Electric Capital's annual developer report: 39,000 new developers joined, more than half of Ethereum developers are committed to L2

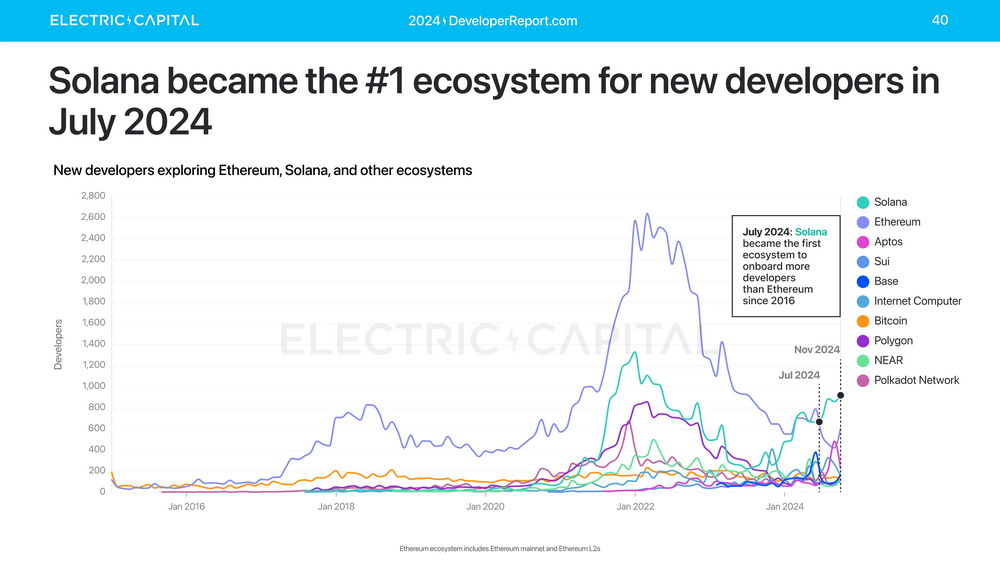
Broken down by ecosystem, Solana became the number one ecosystem for monthly new developers in July 2024.

Electric Capital's annual developer report: 39,000 new developers joined, more than half of Ethereum developers are committed to L2

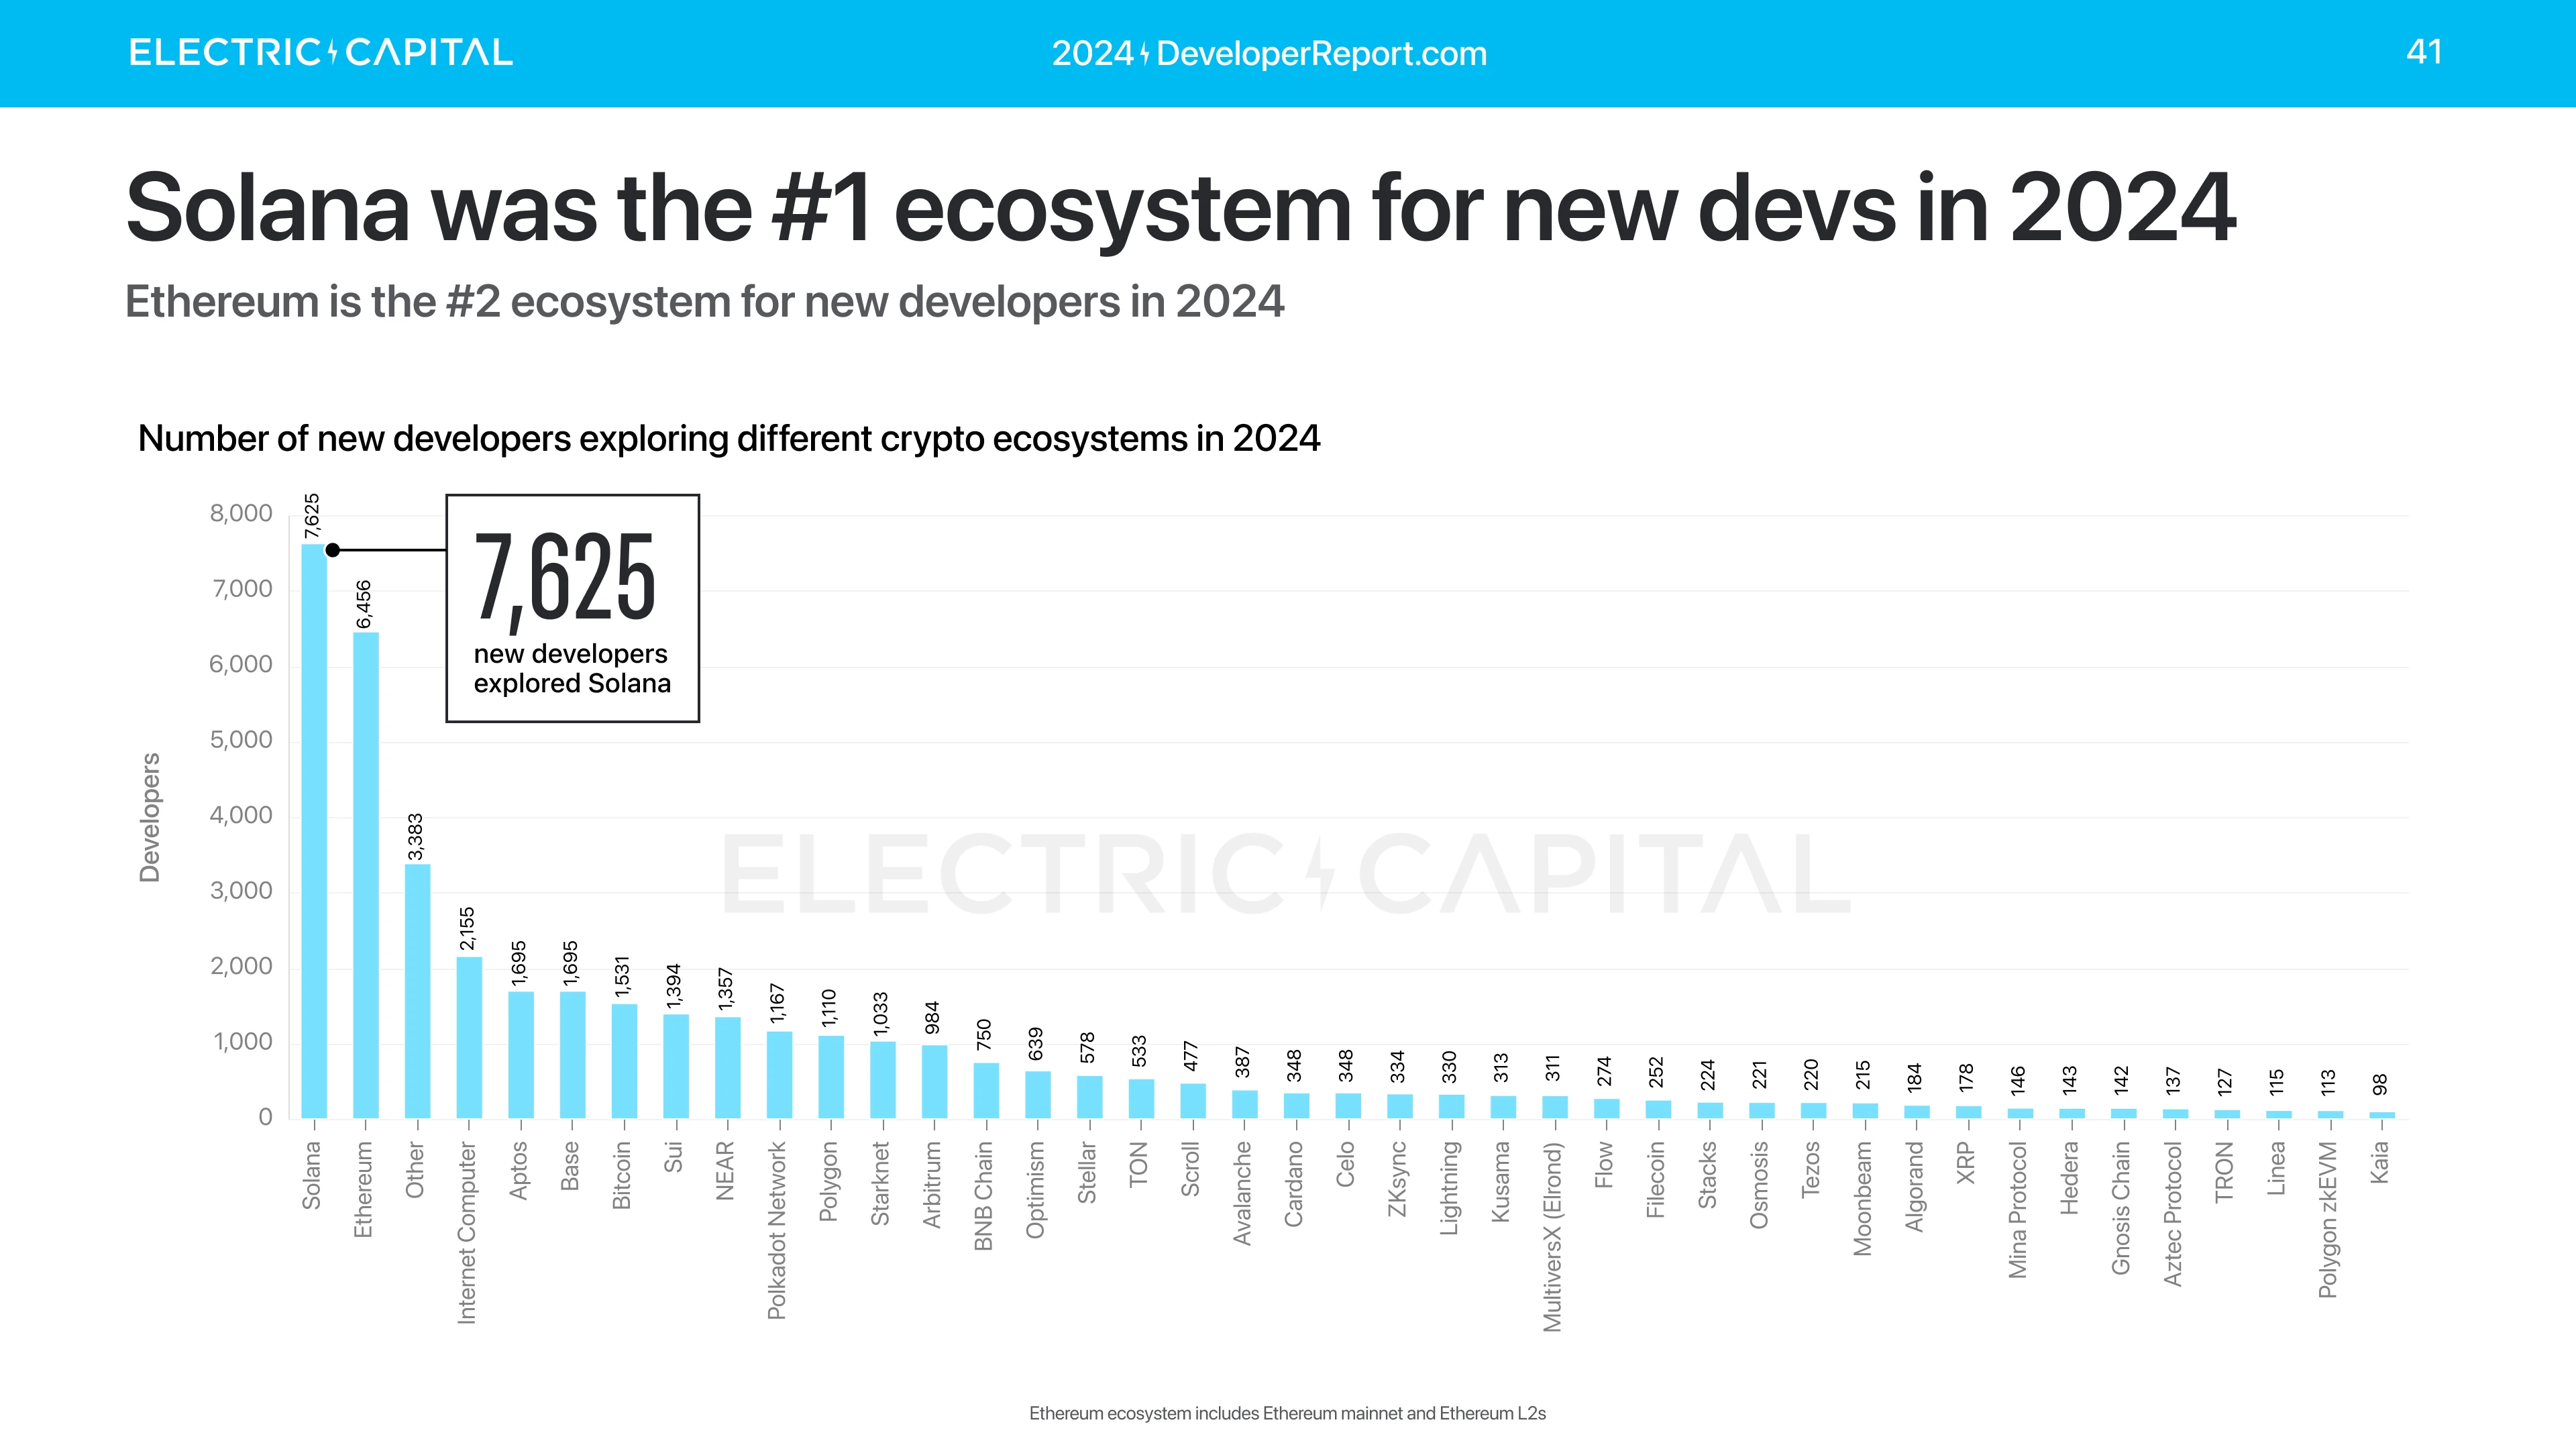
Overall situation of new developers in 2024:

  • Solana is the #1 Ecosystem for New Developers
  • Ethereum ranks second
  • Dfinity, Aptos, Bitcoin, Base, Sui, NEAR, Polkadot, Polygon, and Starknet will all have 1K+ new developers in 2024
  • Arbitrum, BNB Chain, Optimism, Stellar, TON will have 500+ new developers in 2024

Electric Capital's annual developer report: 39,000 new developers joined, more than half of Ethereum developers are committed to L2

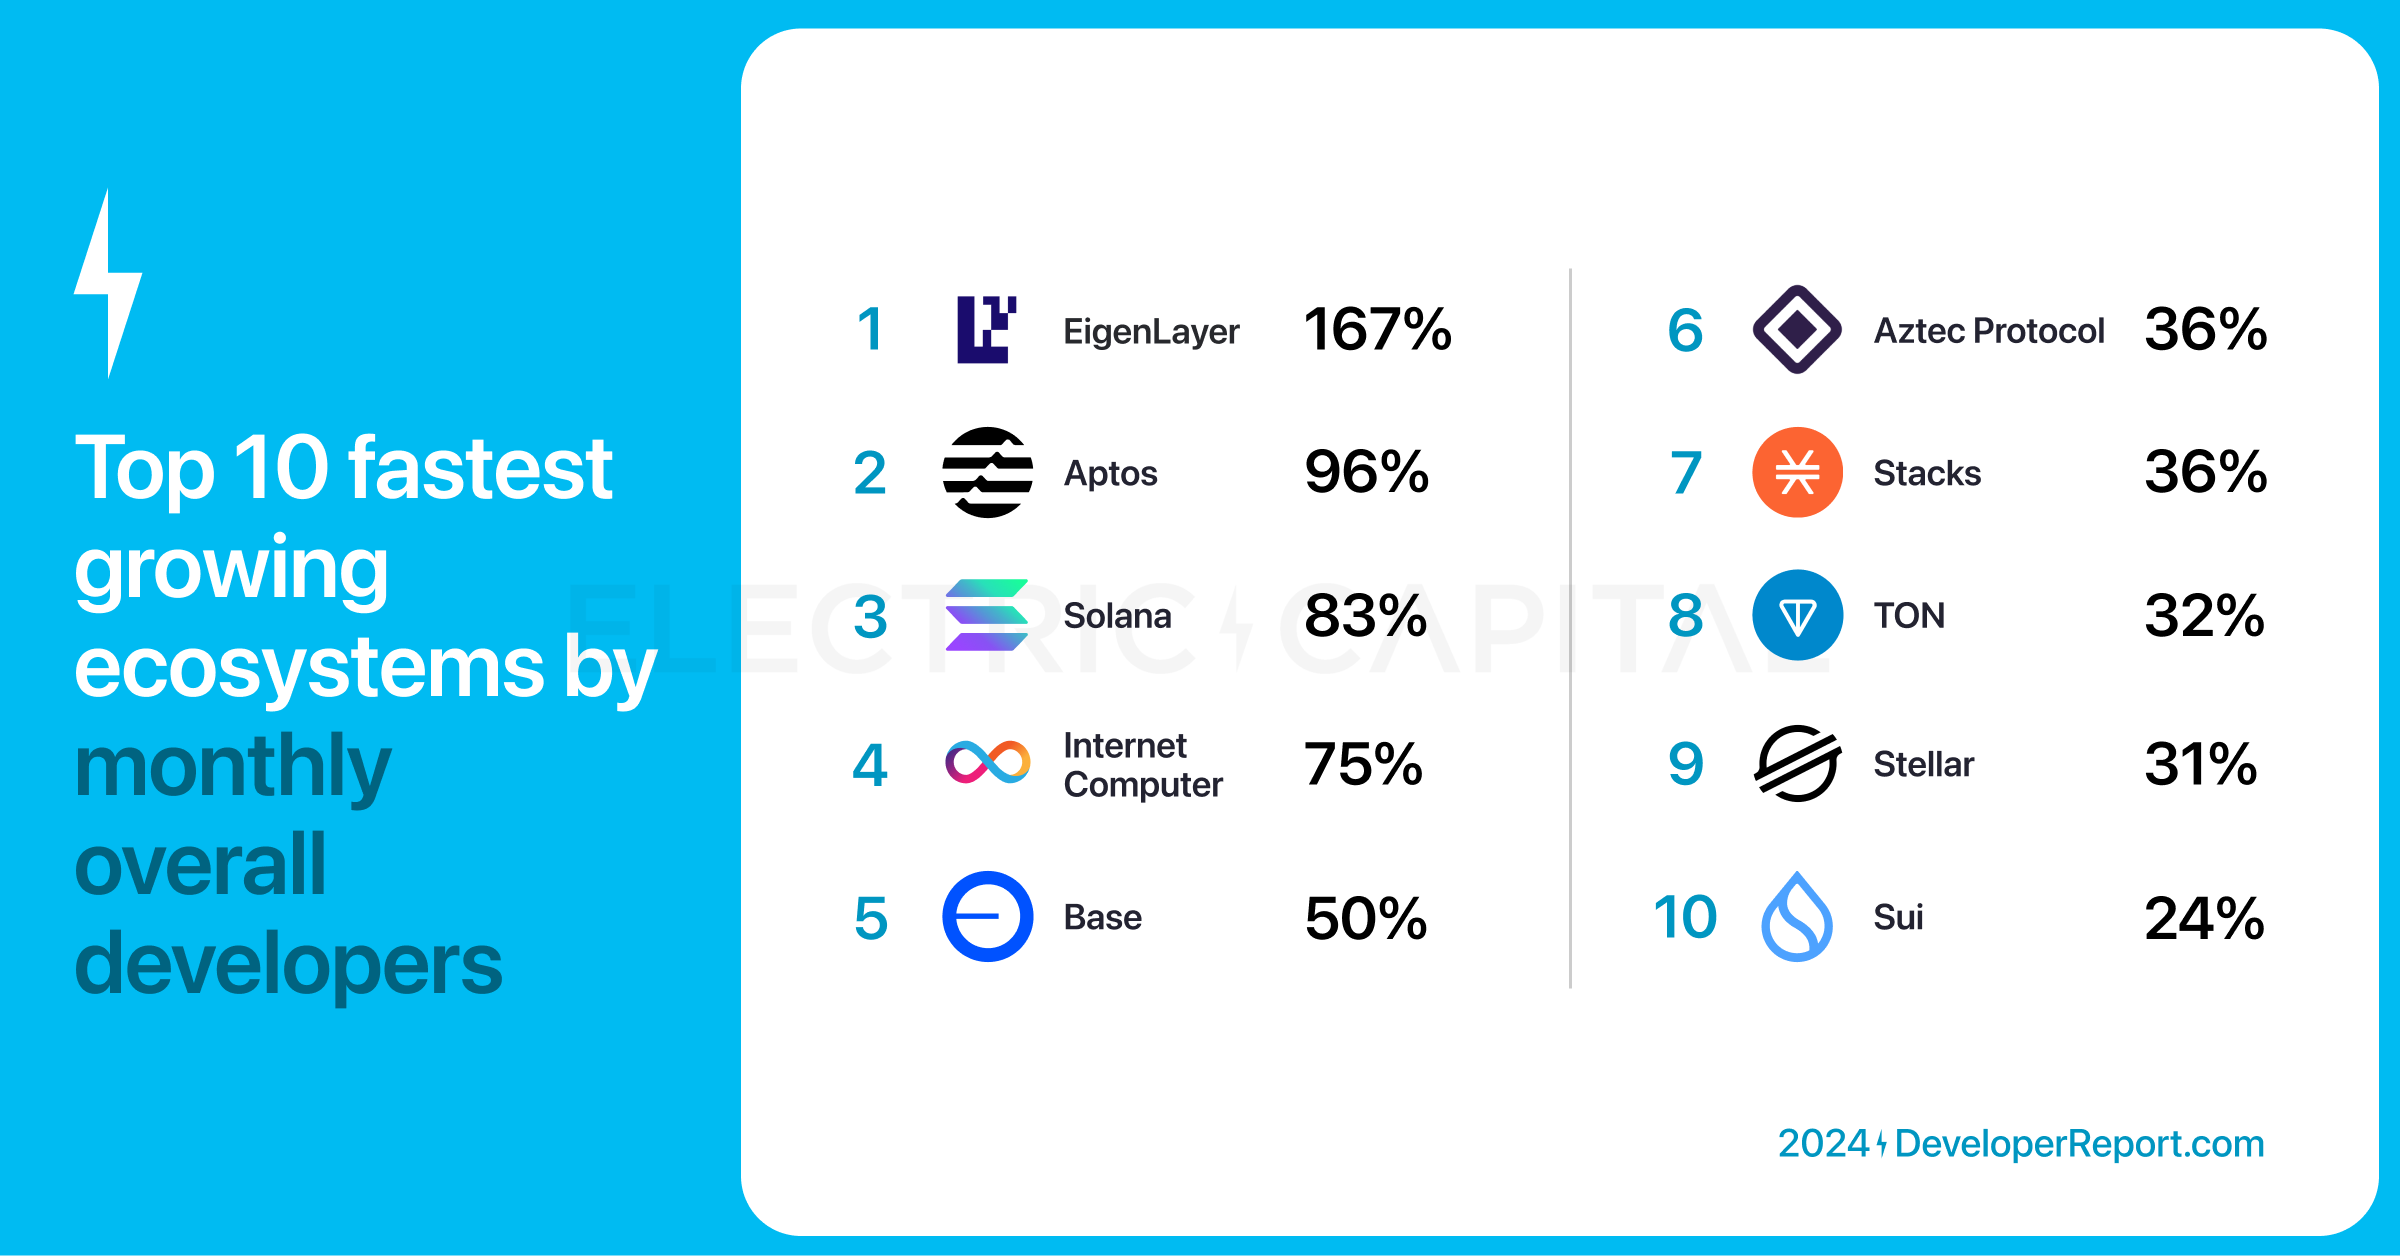
Which ecosystem has the fastest growth in total number of developers? The total number of developers reflects the interest of new developers and hackathon participants. The 10 fastest growing ecosystems in each month from Q3 2023 to Q4 2024 in terms of total number of developers: EigenLayer, Aptos, Solana, Dfinity, Base, Aztec, Stacks, TON, Stellar, Sui.

Electric Capital's annual developer report: 39,000 new developers joined, more than half of Ethereum developers are committed to L2

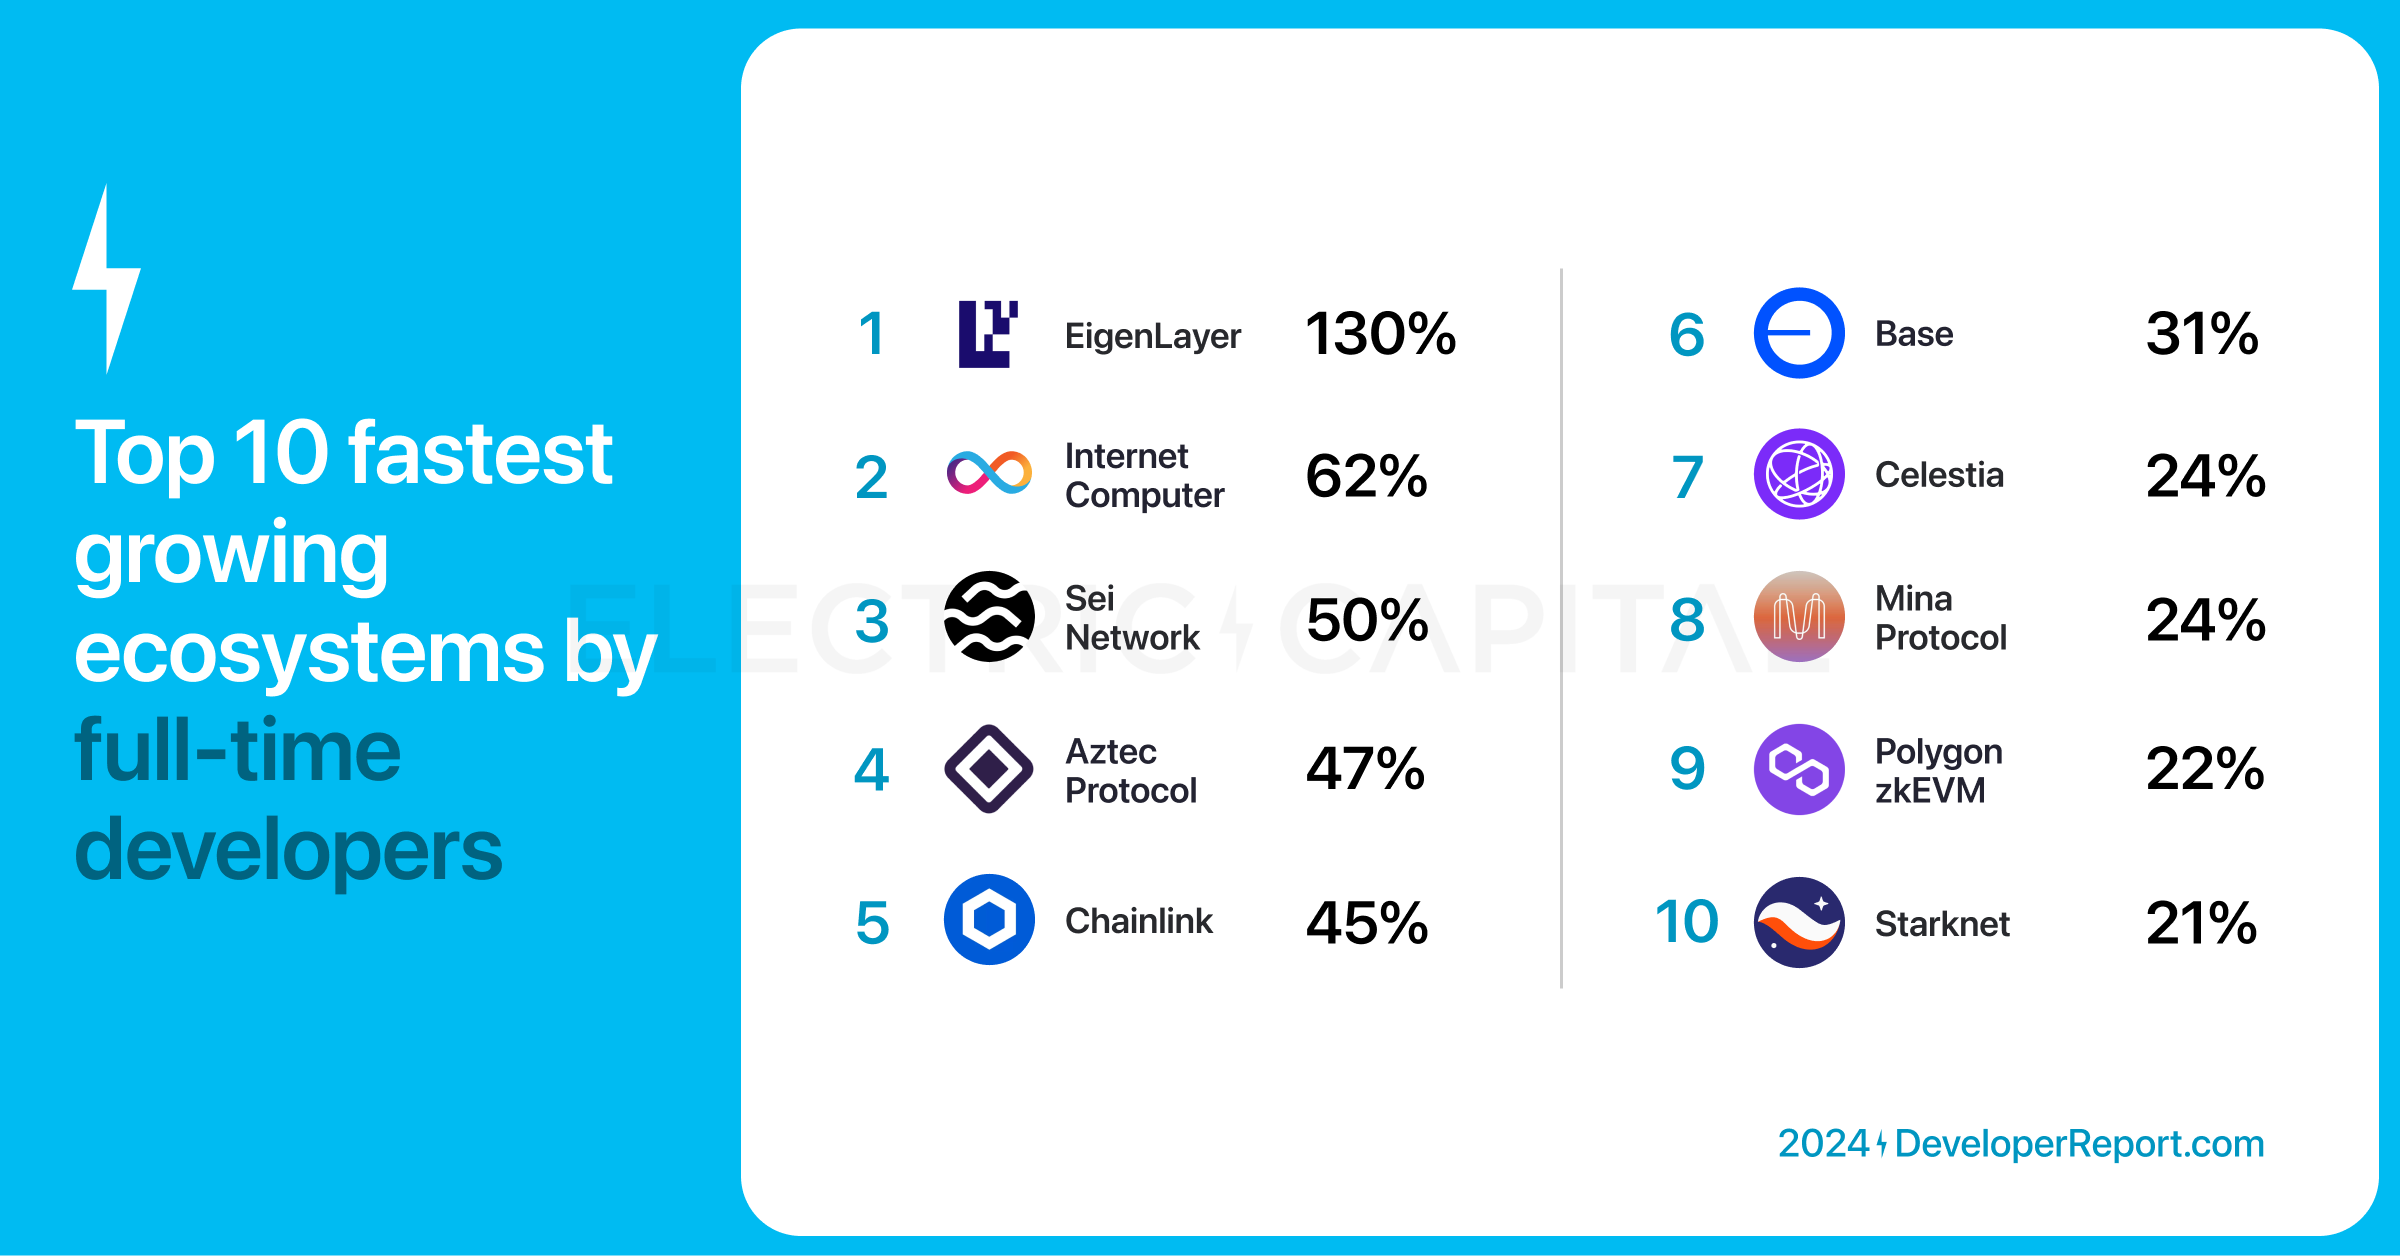
Which ecosystem has the fastest growth in full-time developers? Full-time developers submit code more than 10 days a month, and they make a steady contribution to the ecosystem. The 10 ecosystems with the fastest growth in full-time developers from Q3 2023 to Q4 2024: EigenLayer, Dfinity, Sei, Aztec, Chainlink, Base, Celestia, Mina, Polygon, Starknet.

Electric Capital's annual developer report: 39,000 new developers joined, more than half of Ethereum developers are committed to L2

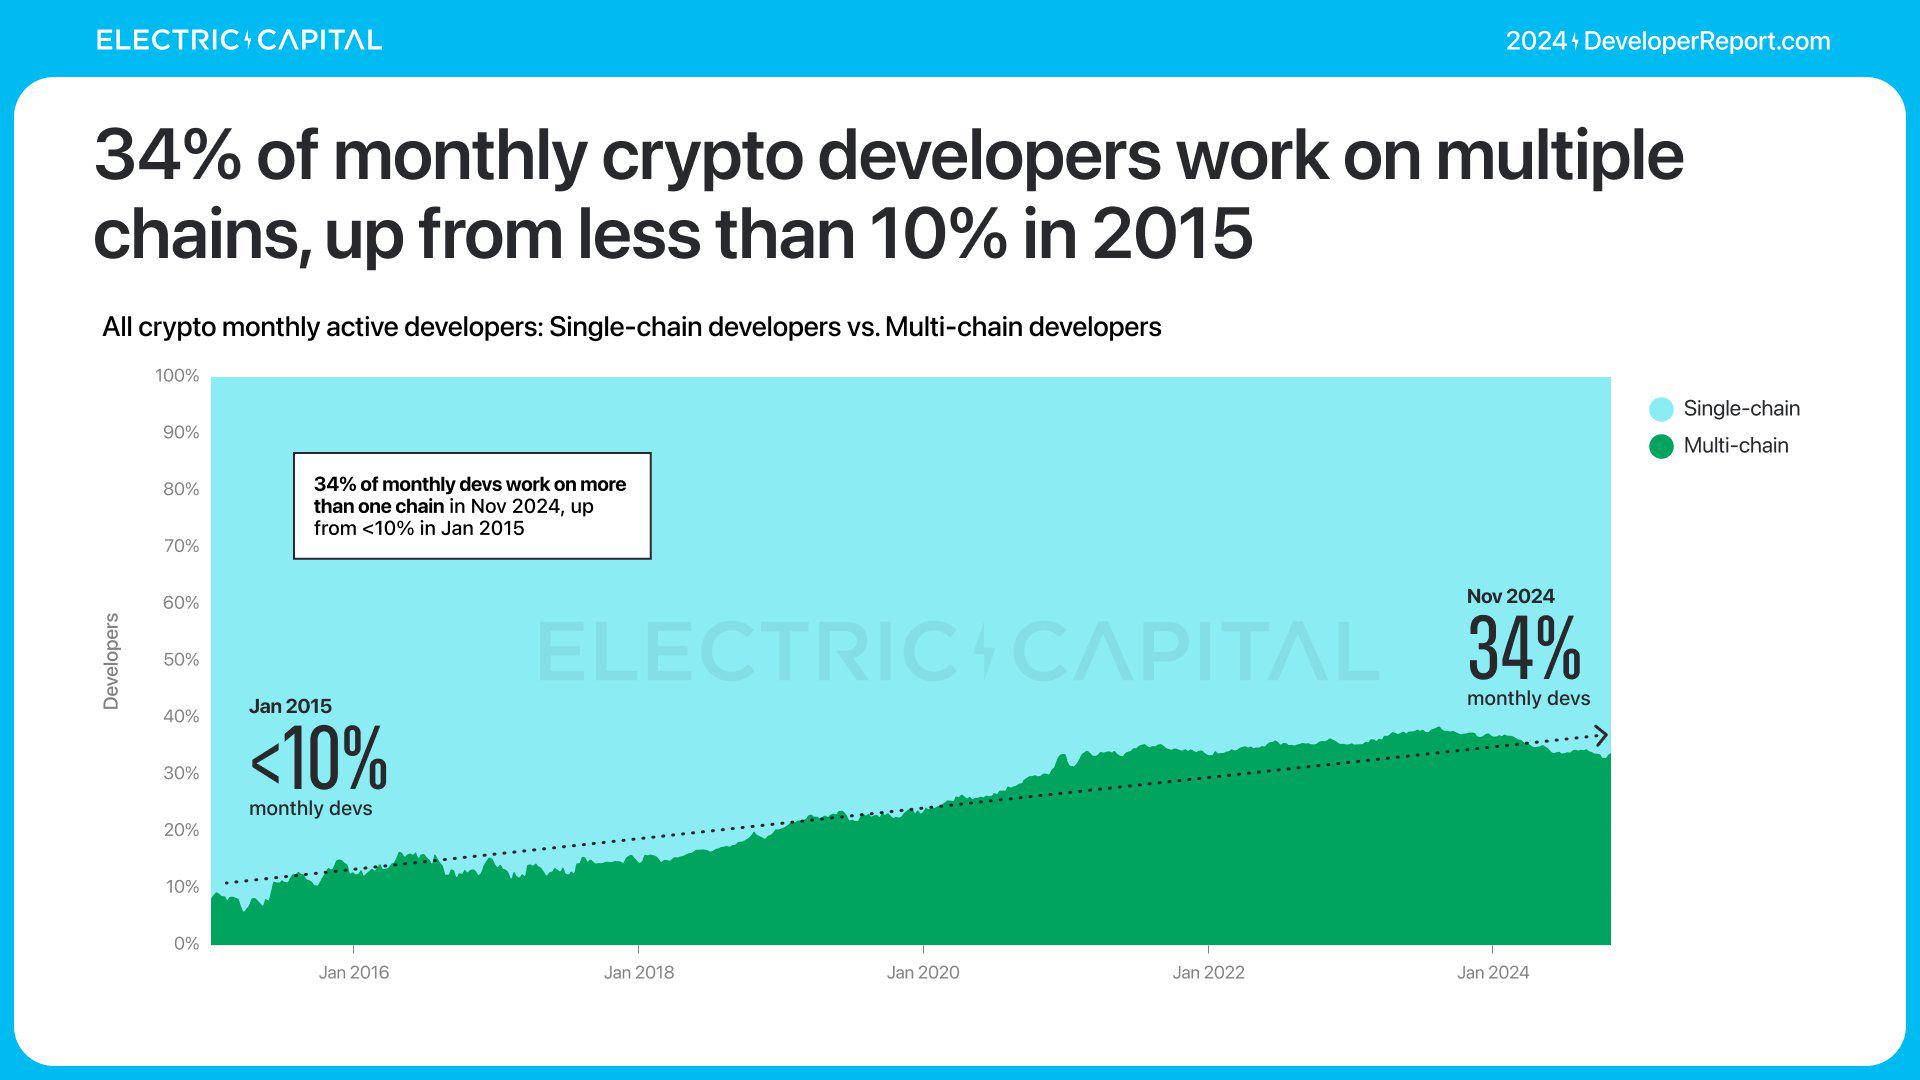
Many developers are working on multiple chains. Today, one-third of crypto developers are working on multiple chains, and this number is growing.

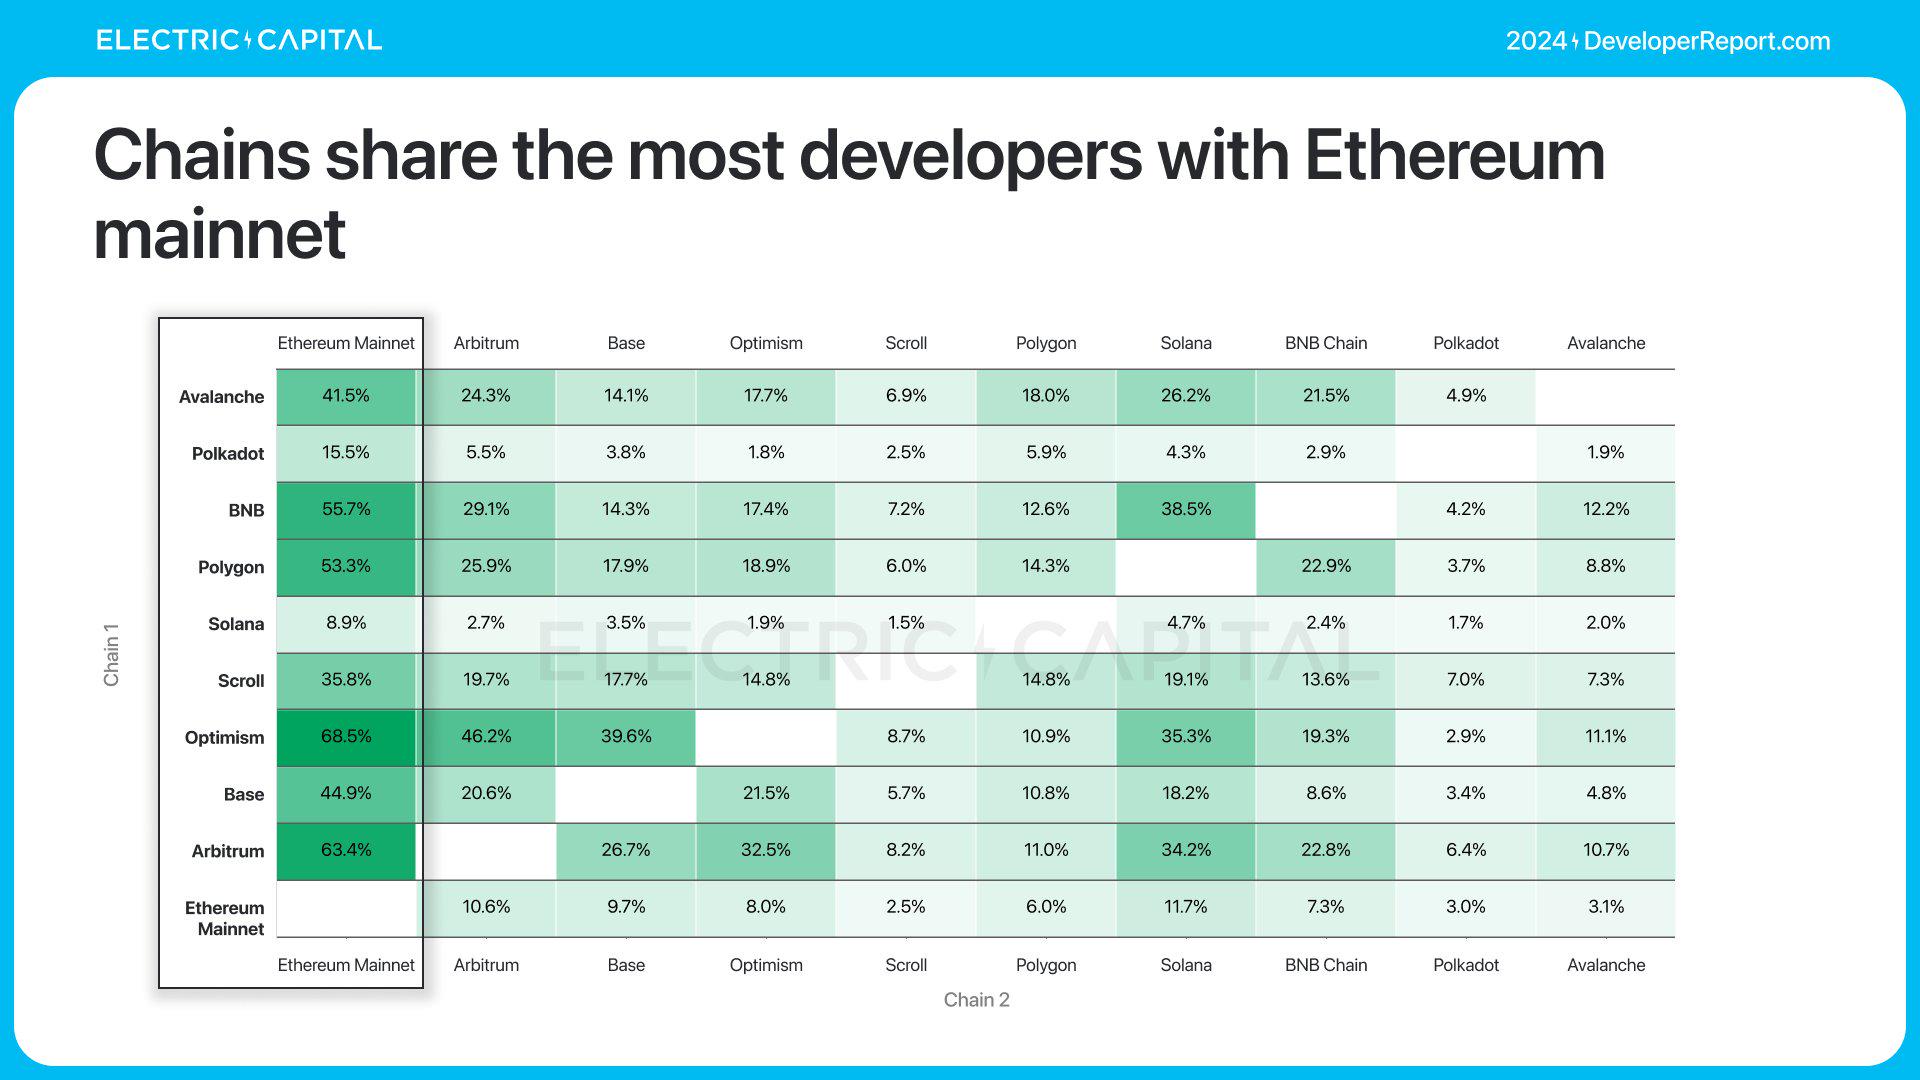
The share of multi-chain developers per month increases from less than 10% in 2015 to 34% in 2024. The chain with the largest share of multi-chain developers shares developers with Ethereum.

Electric Capital's annual developer report: 39,000 new developers joined, more than half of Ethereum developers are committed to L2

Electric Capital's annual developer report: 39,000 new developers joined, more than half of Ethereum developers are committed to L2

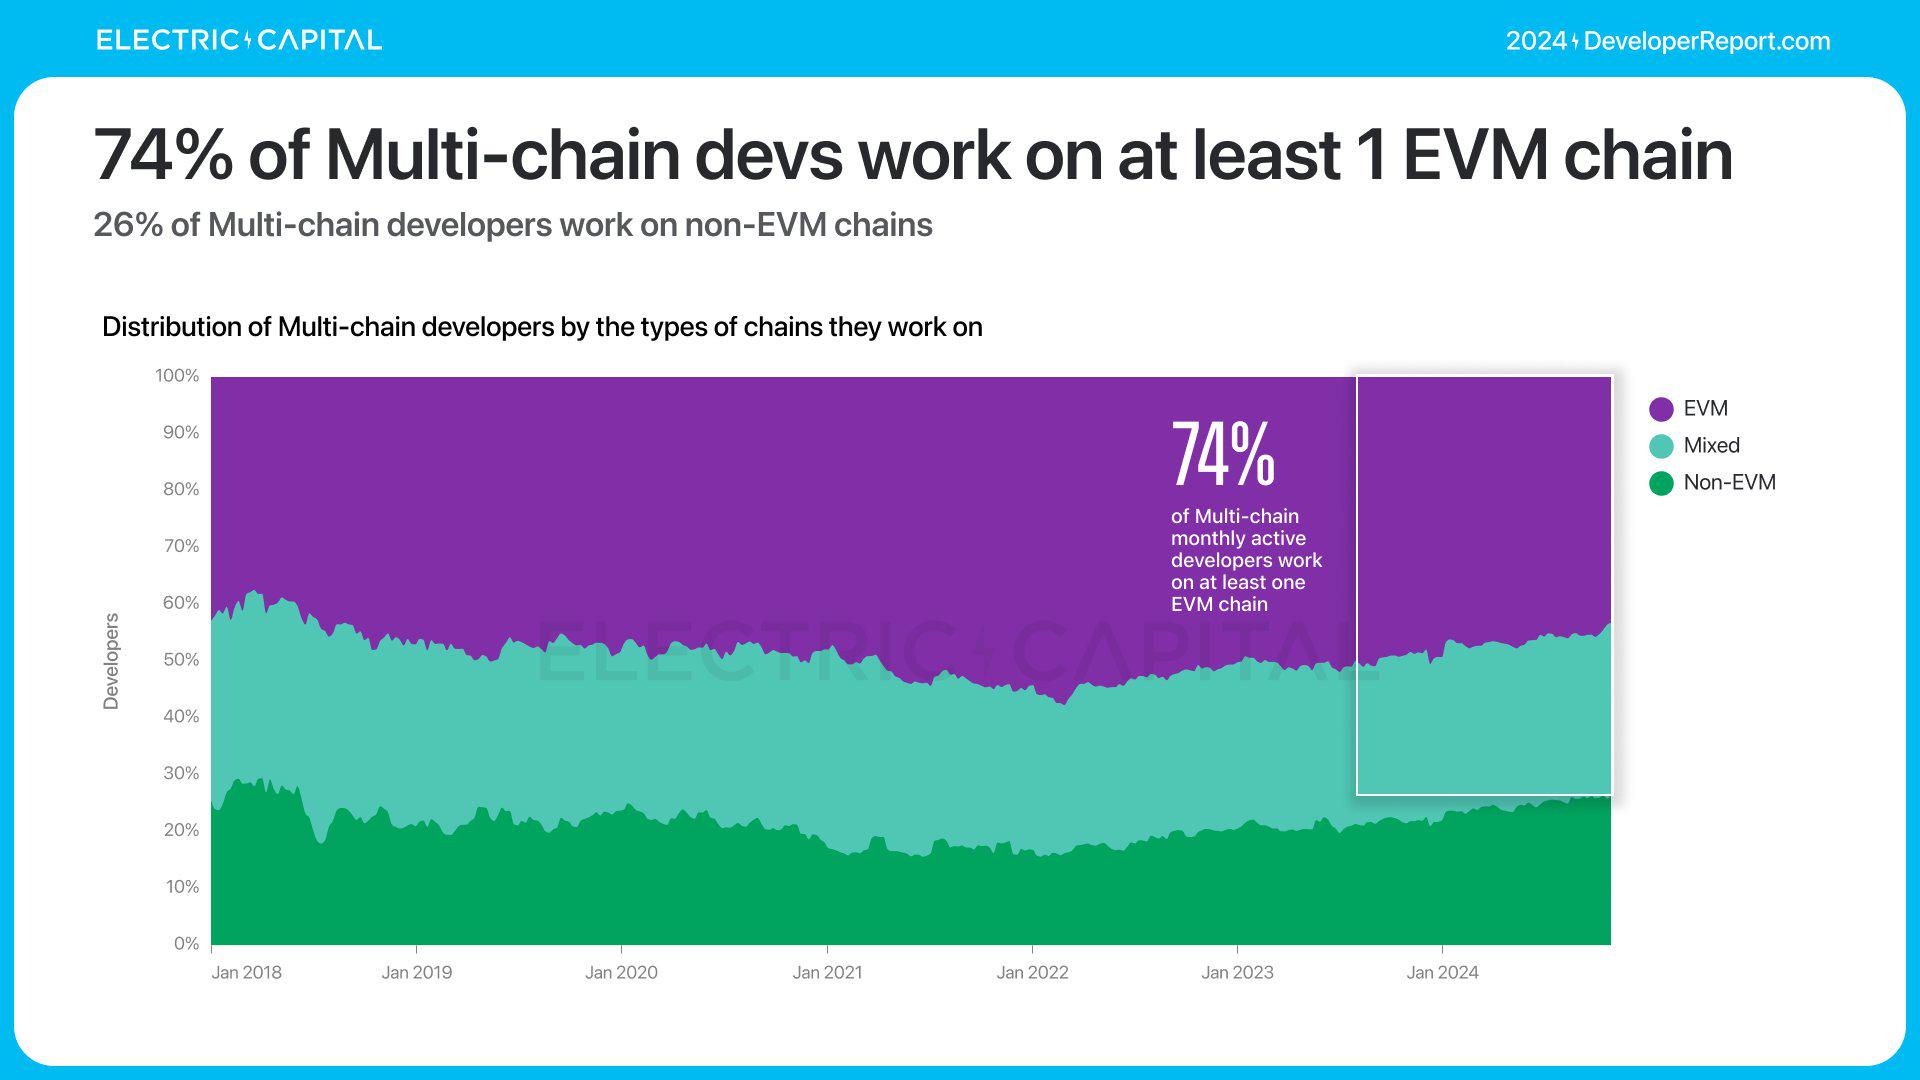
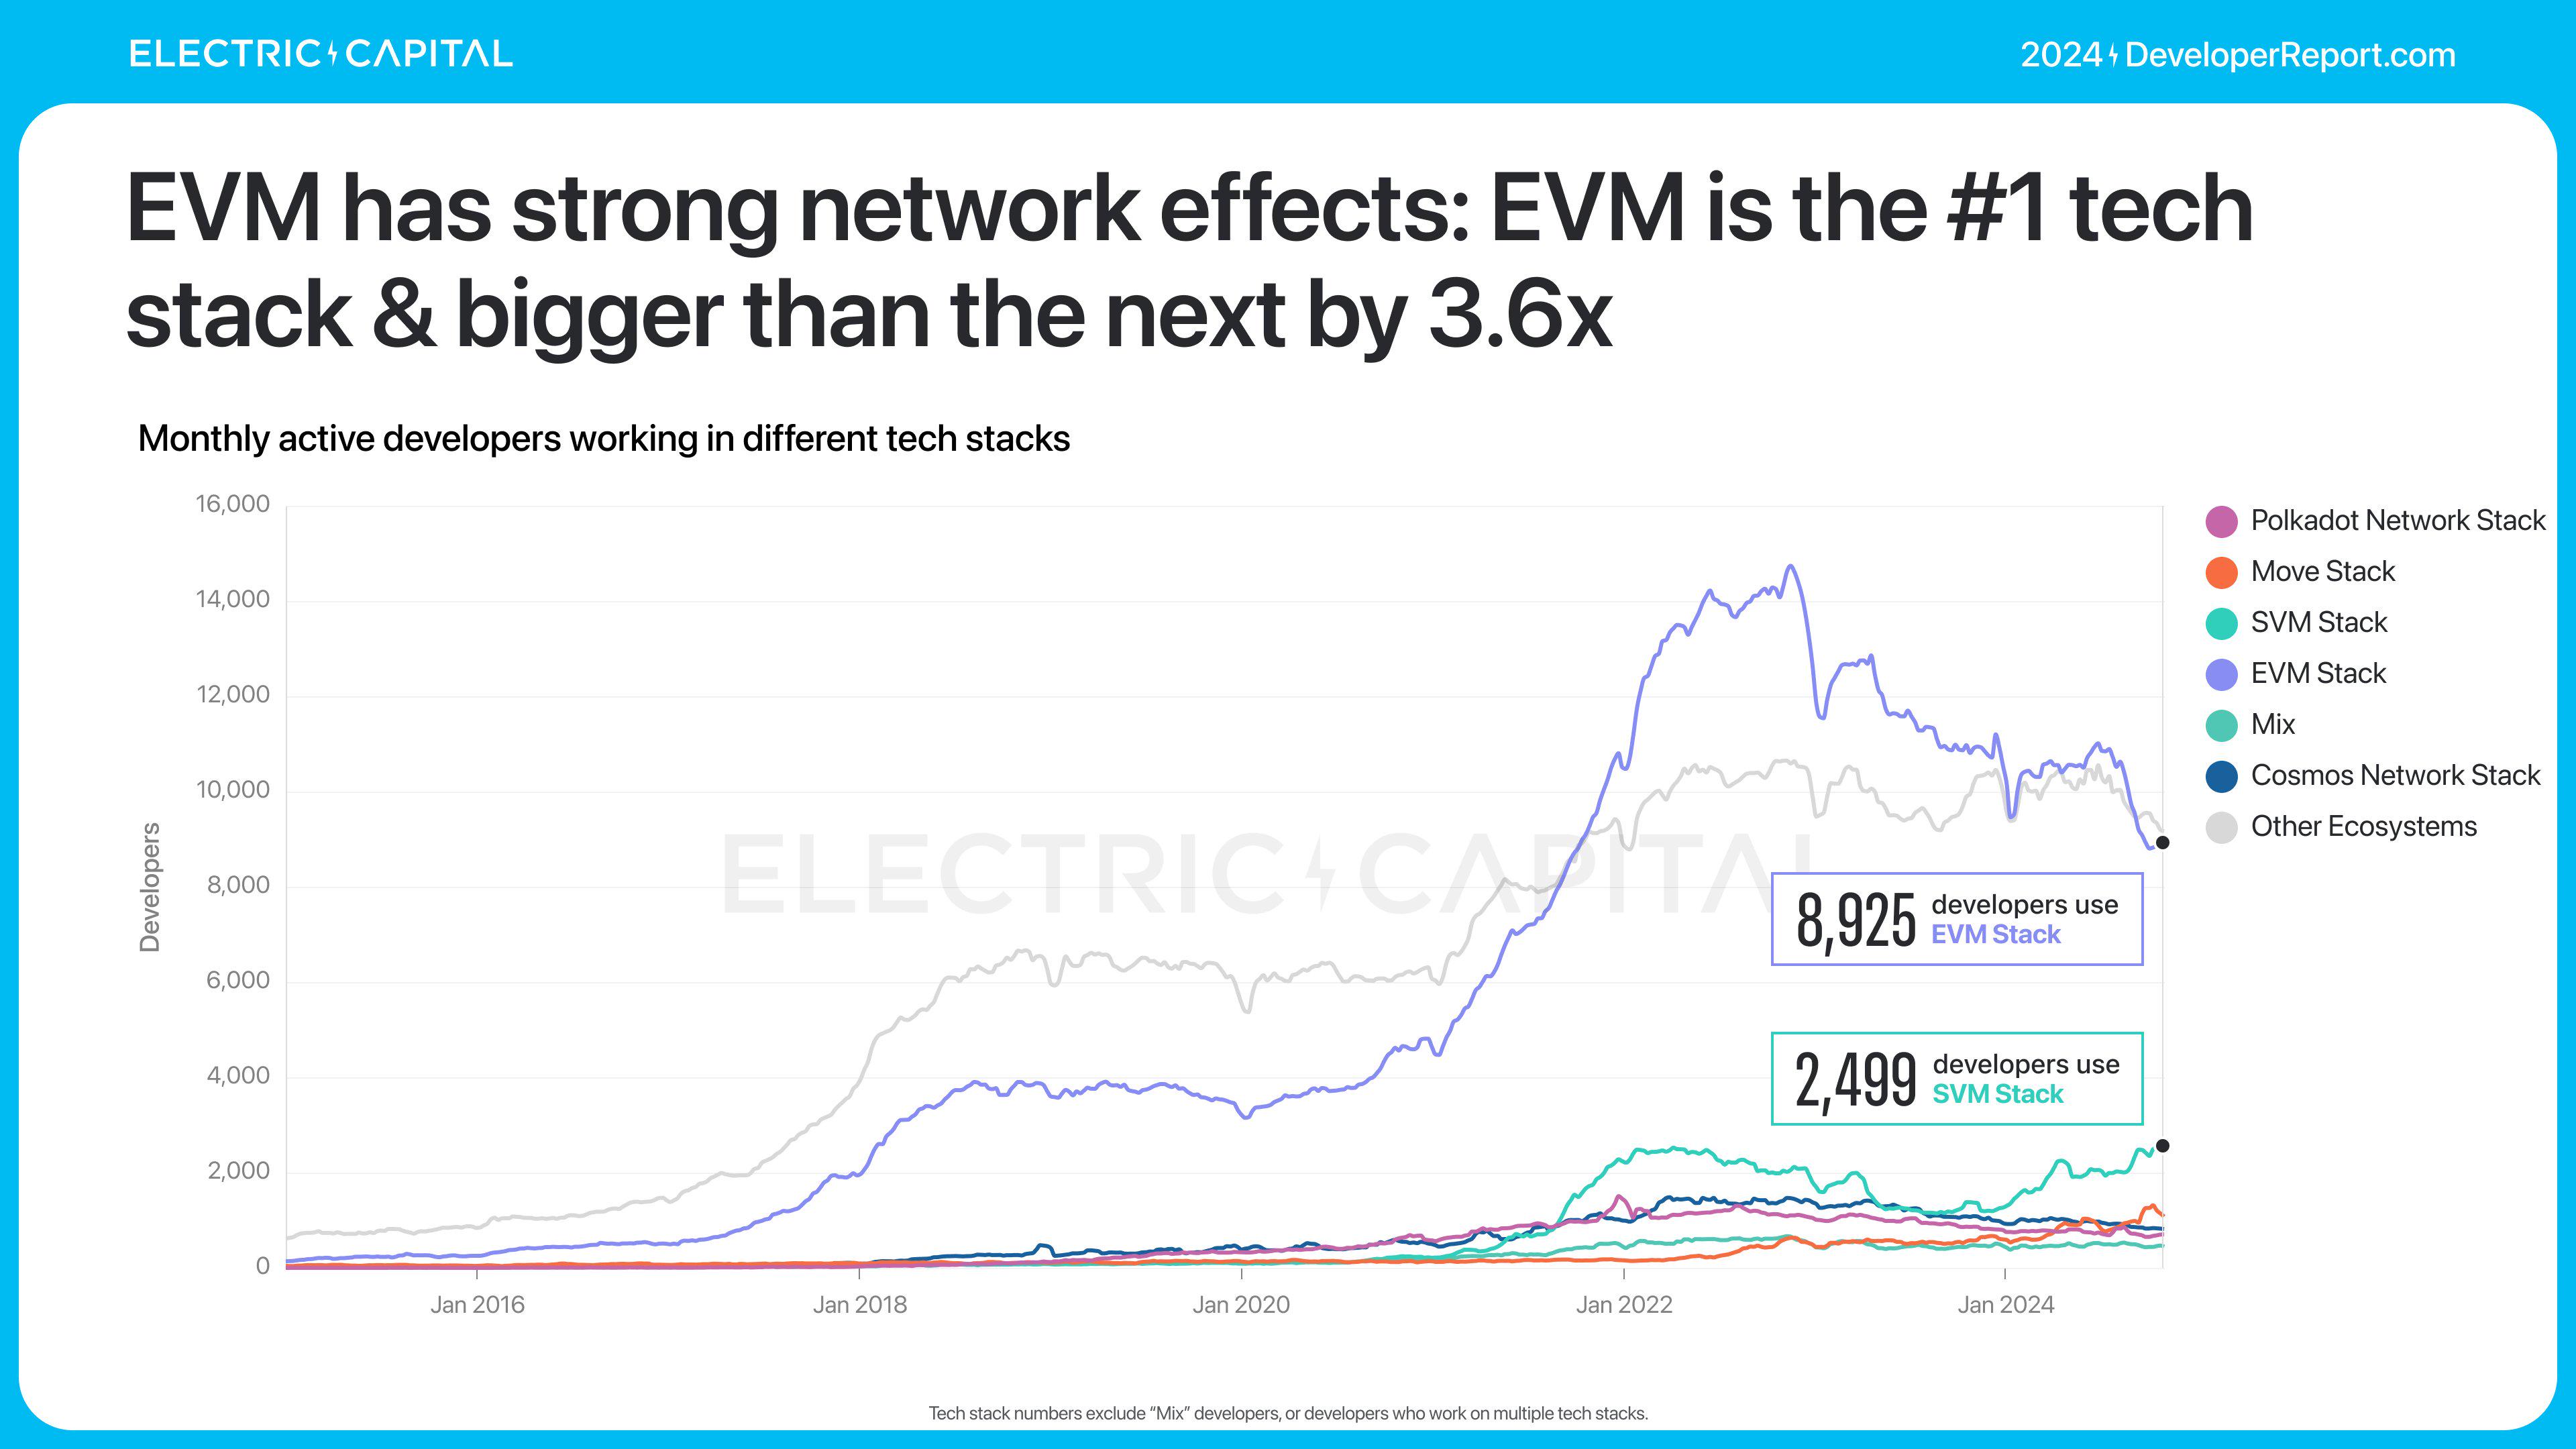
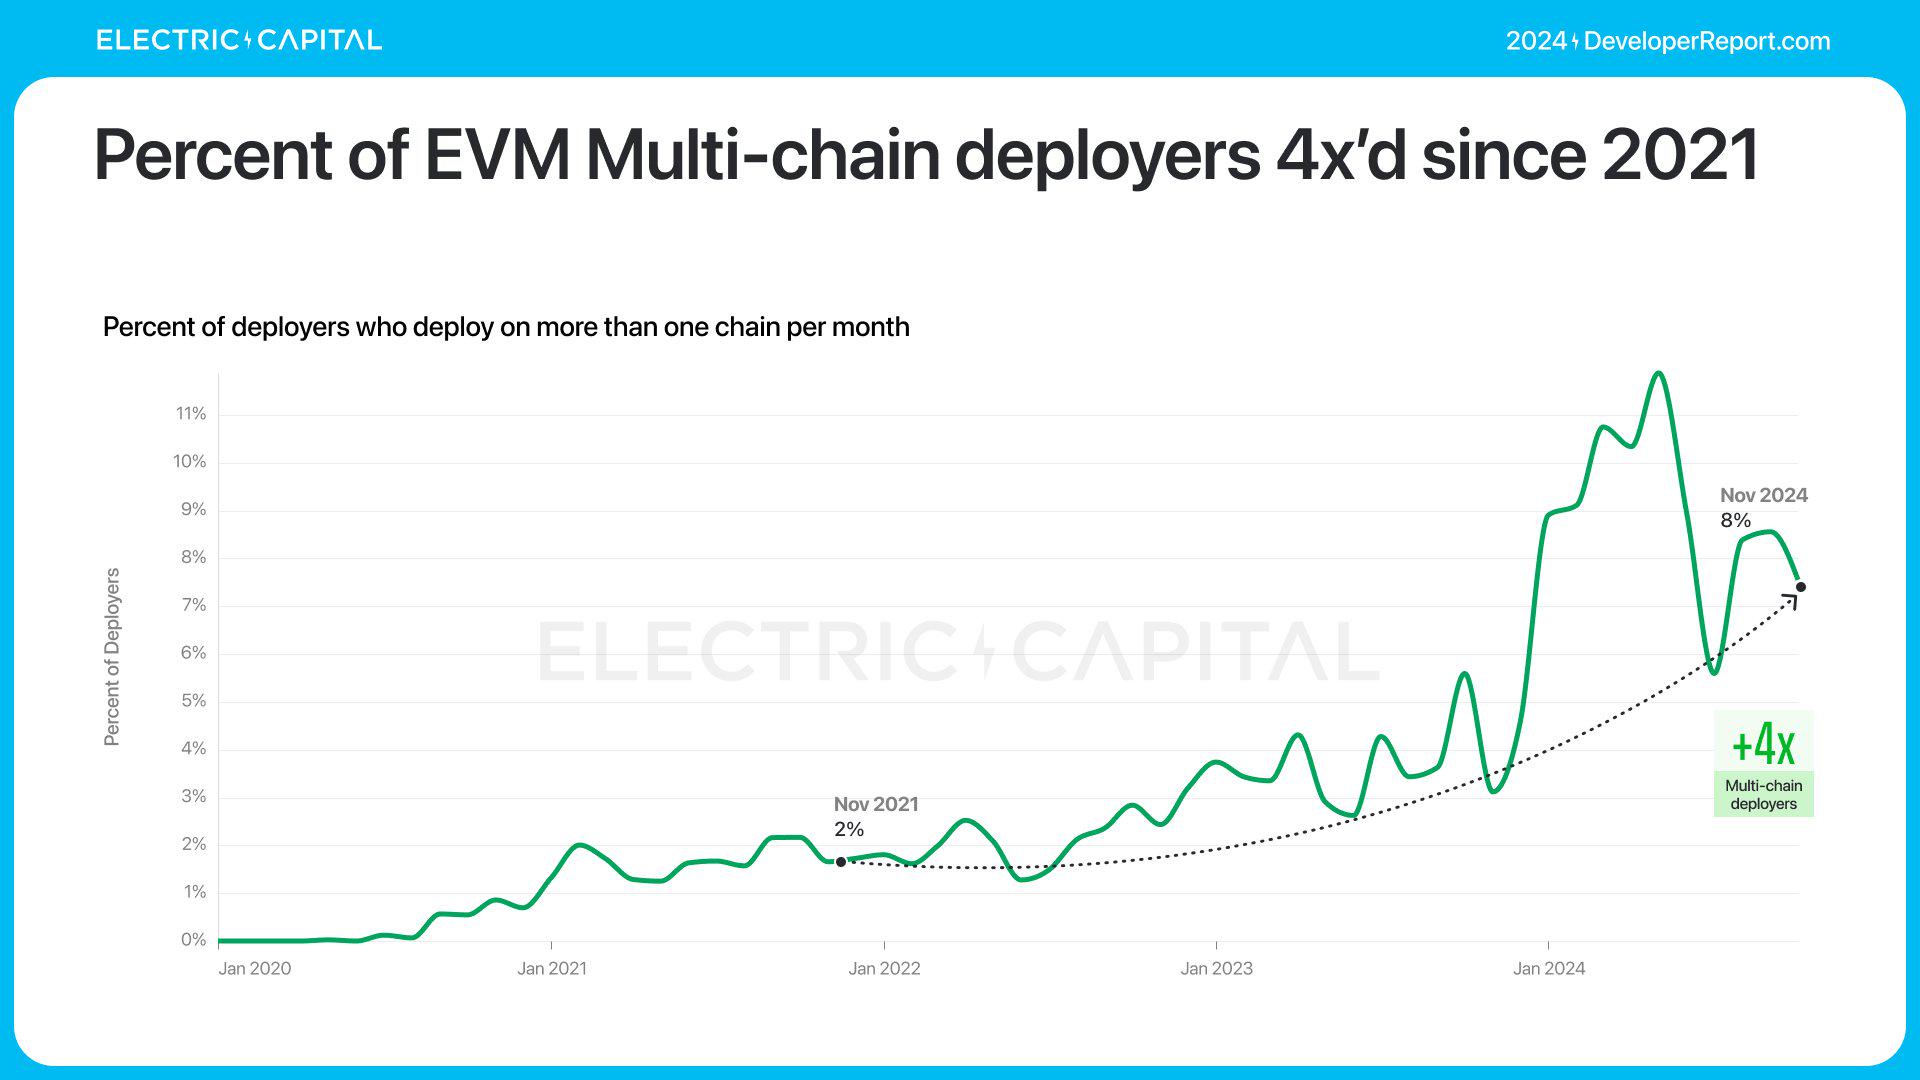
The EVM chain shares the most developers and has a significant network effect: 74% of multi-chain developers work on the EVM chain. The proportion of EVM cross-chain deployers has increased 4x since 2021.

Electric Capital's annual developer report: 39,000 new developers joined, more than half of Ethereum developers are committed to L2

Electric Capital's annual developer report: 39,000 new developers joined, more than half of Ethereum developers are committed to L2

Electric Capital's annual developer report: 39,000 new developers joined, more than half of Ethereum developers are committed to L2

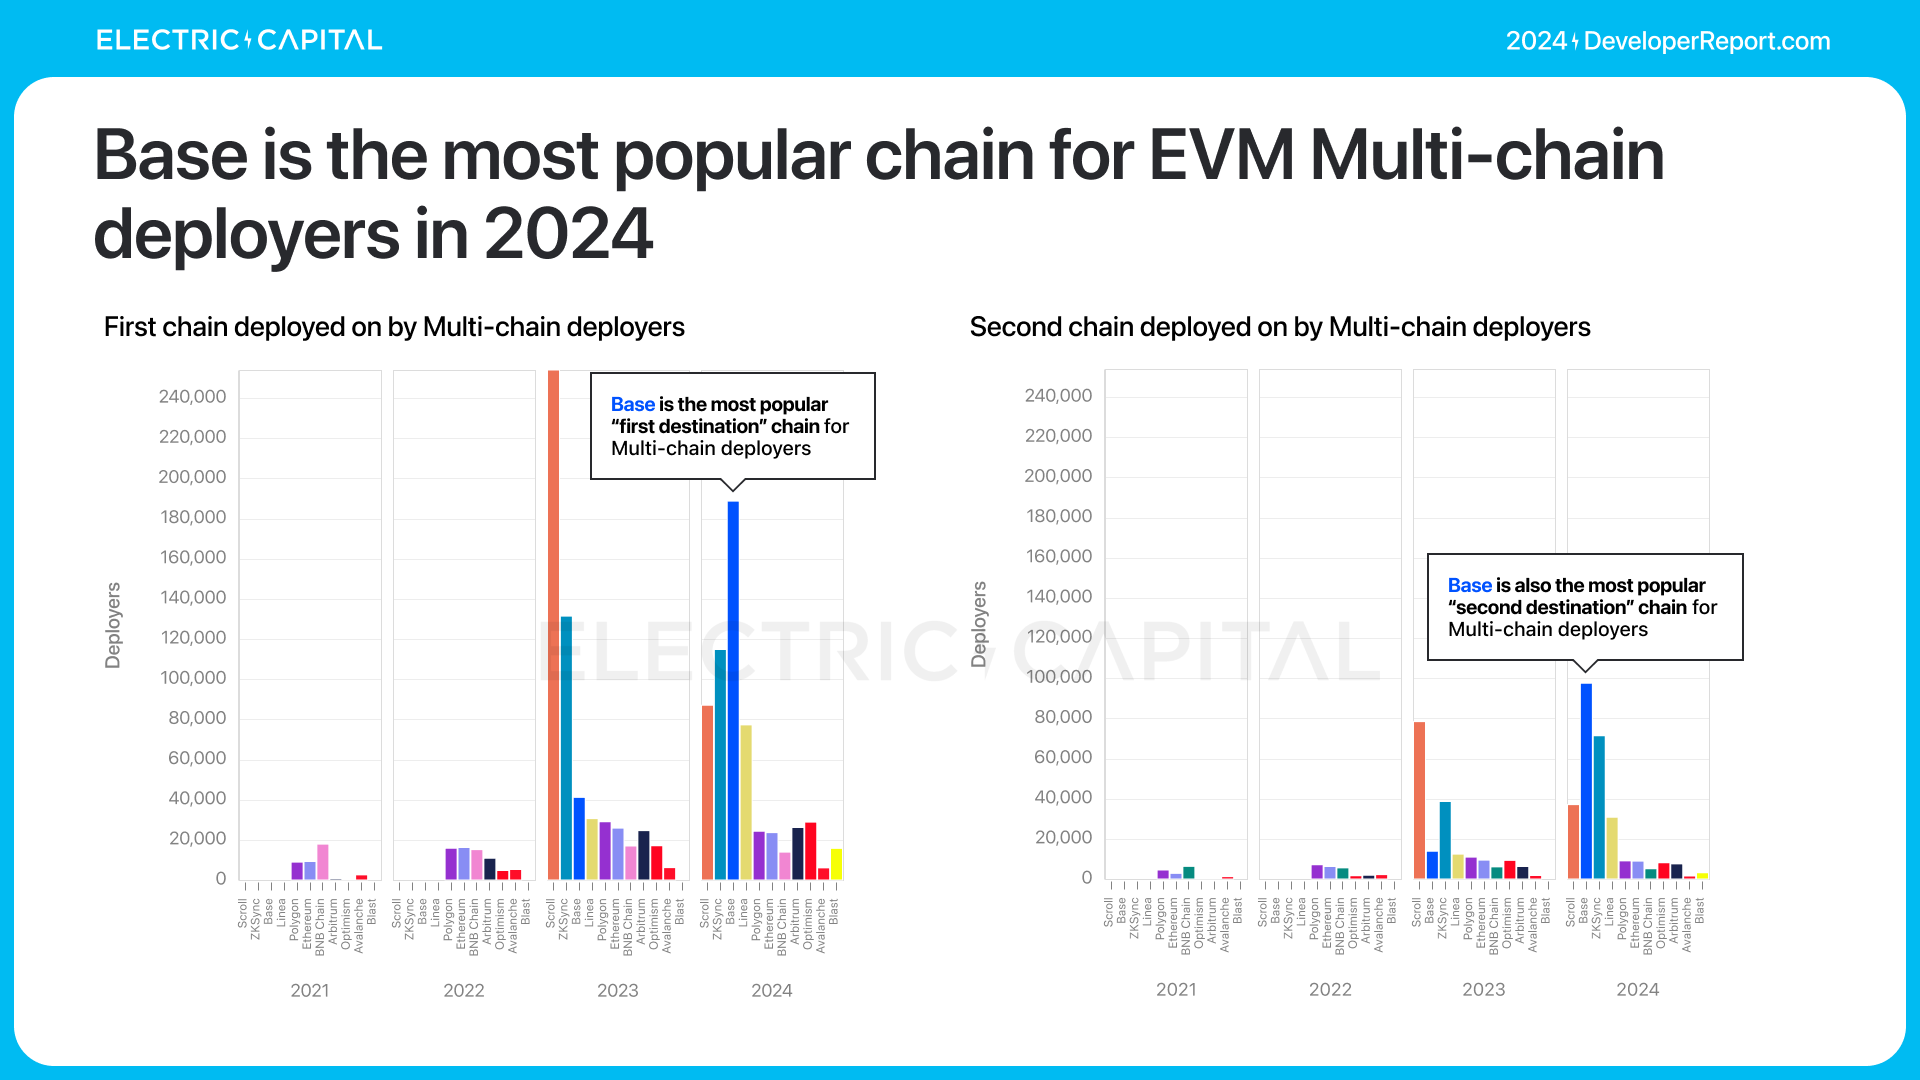
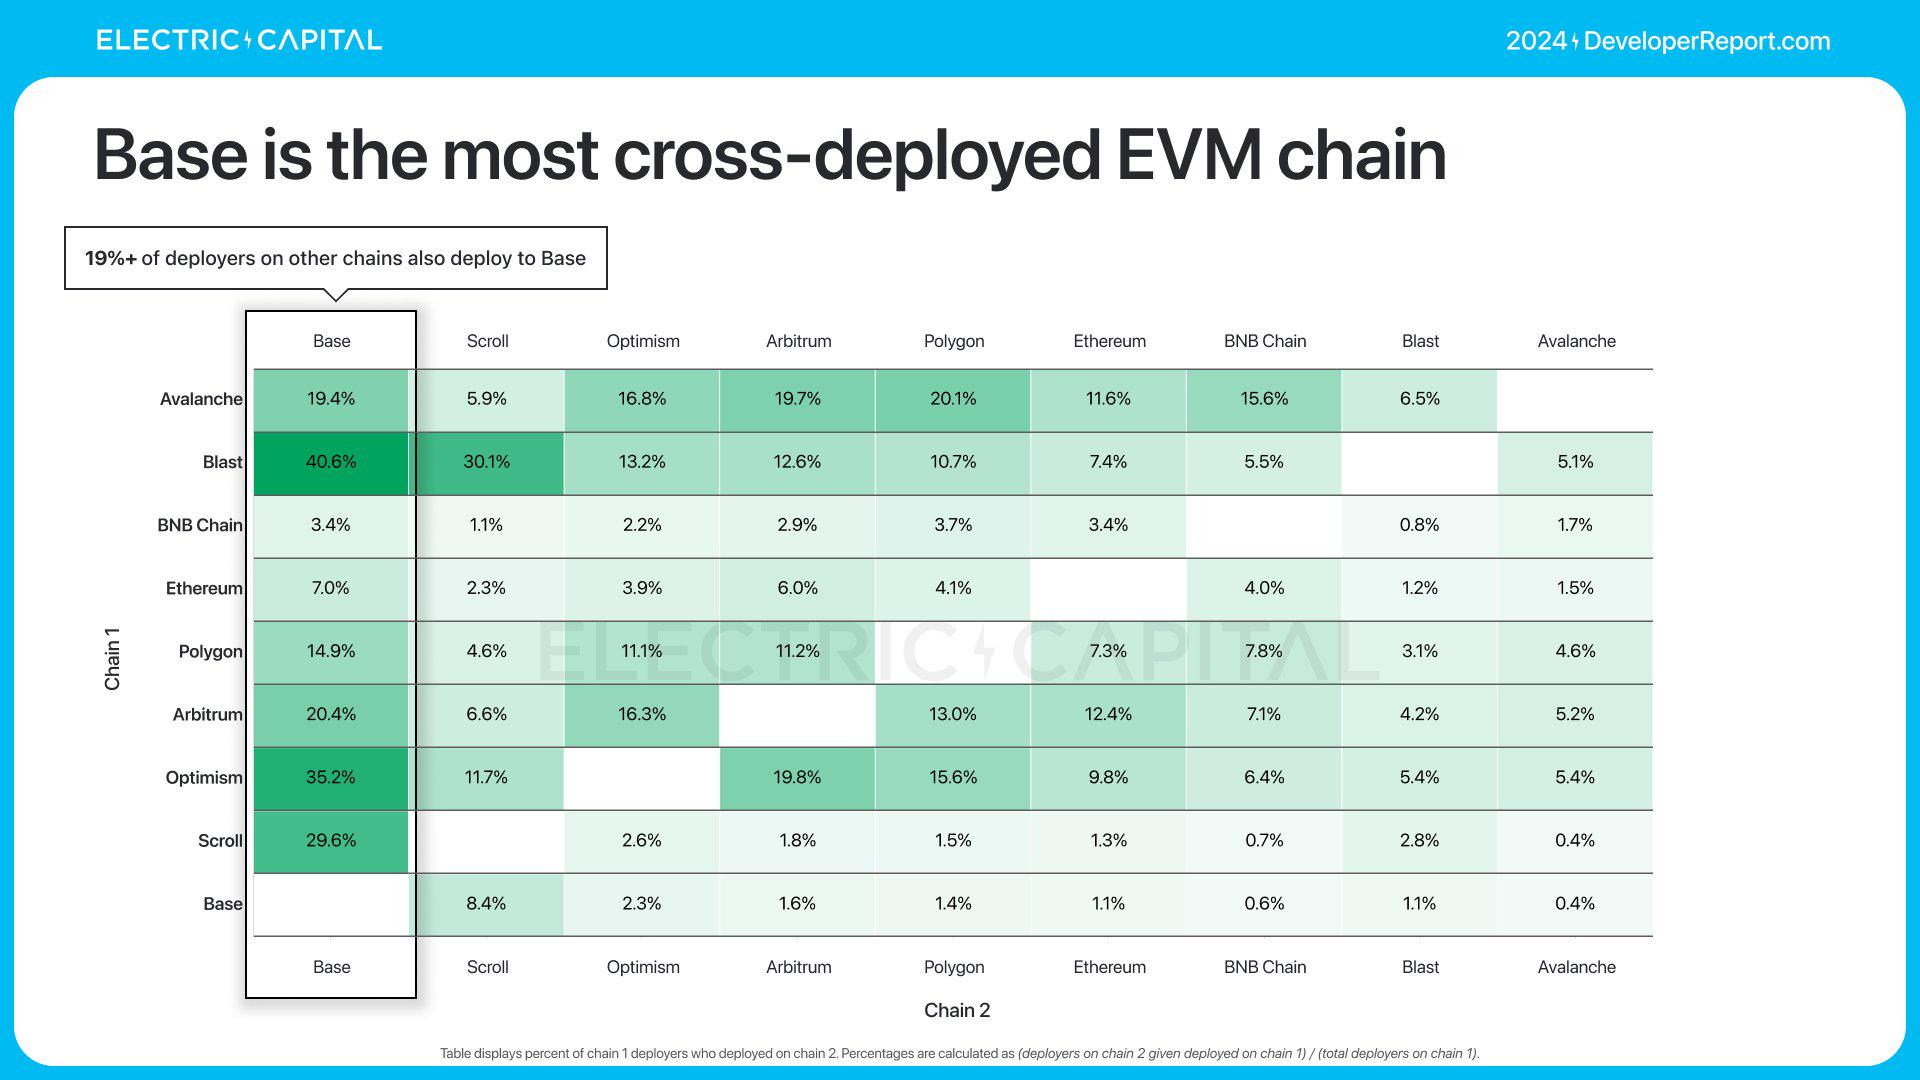
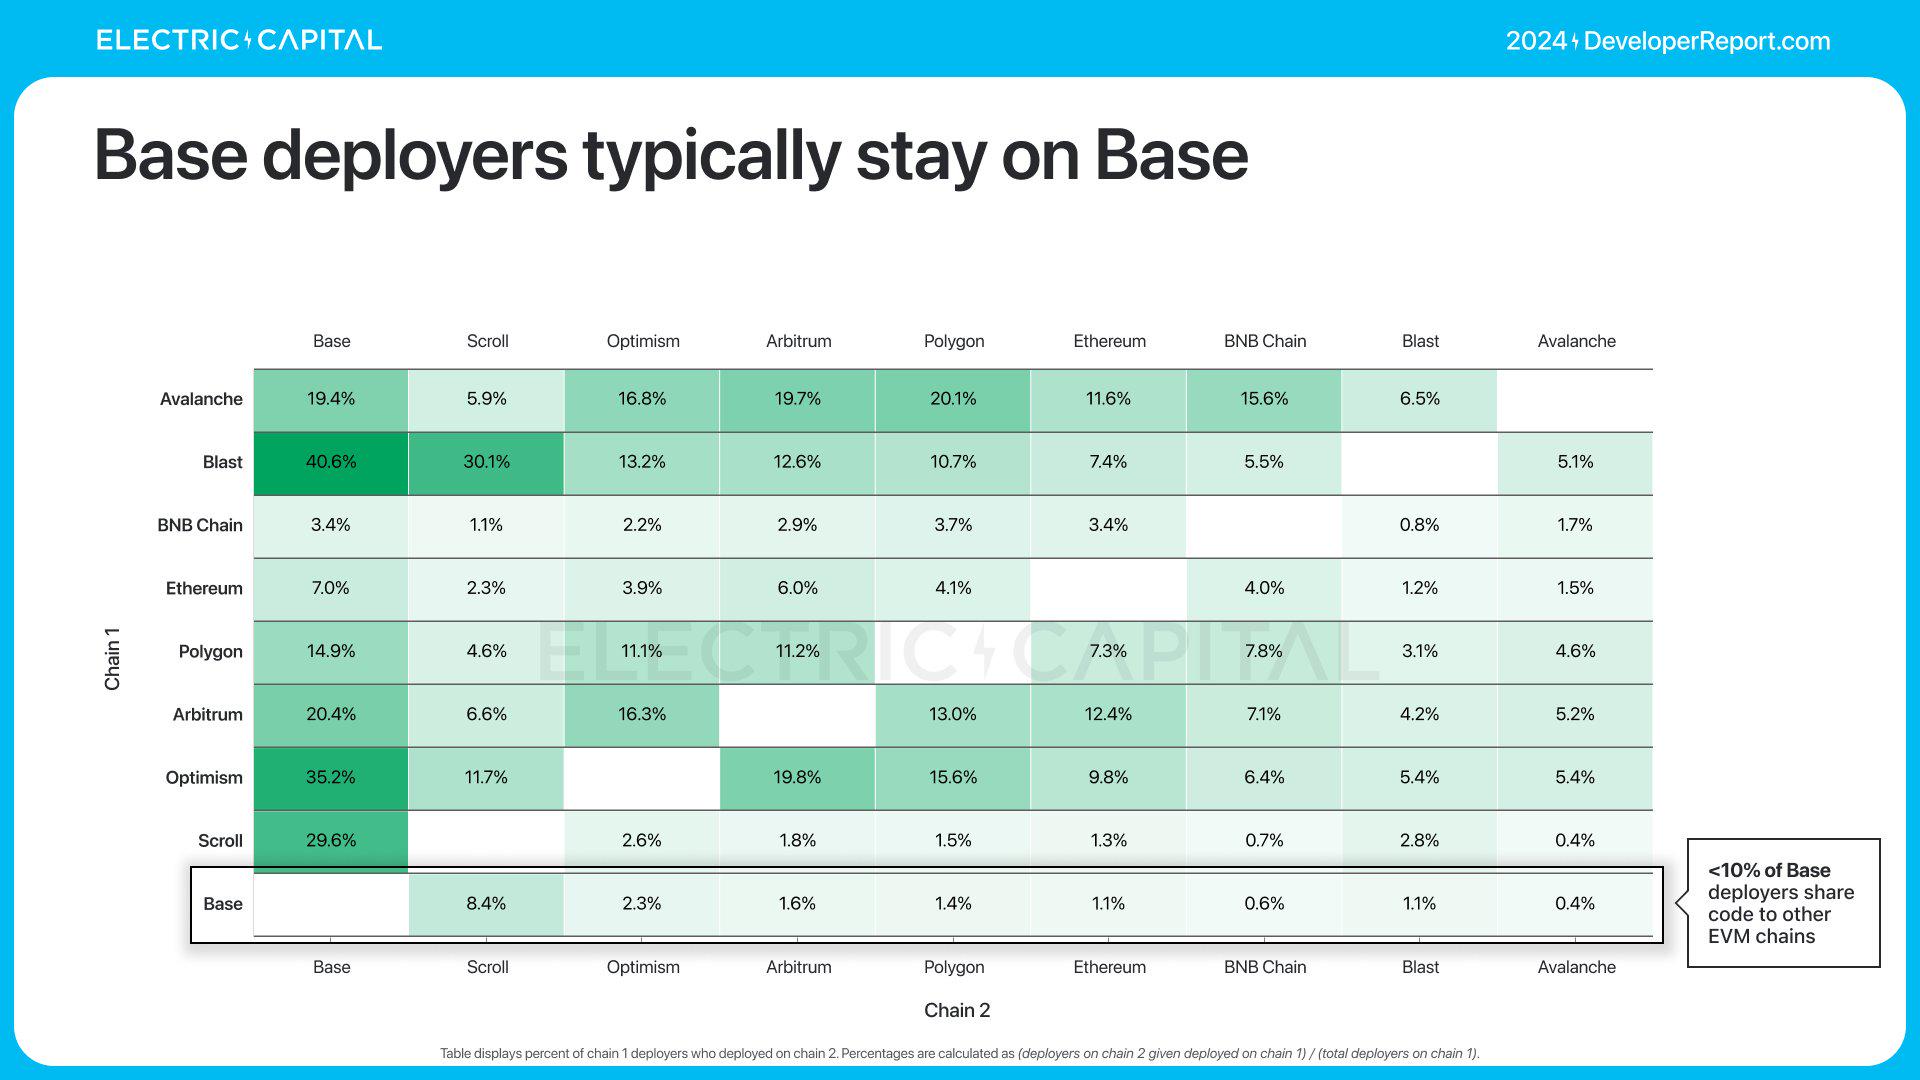
In 2024, Base is the most popular chain among EVM multi-chain deployers, but Base deployers tend to stay on Base.

Electric Capital's annual developer report: 39,000 new developers joined, more than half of Ethereum developers are committed to L2

Electric Capital's annual developer report: 39,000 new developers joined, more than half of Ethereum developers are committed to L2

Electric Capital's annual developer report: 39,000 new developers joined, more than half of Ethereum developers are committed to L2

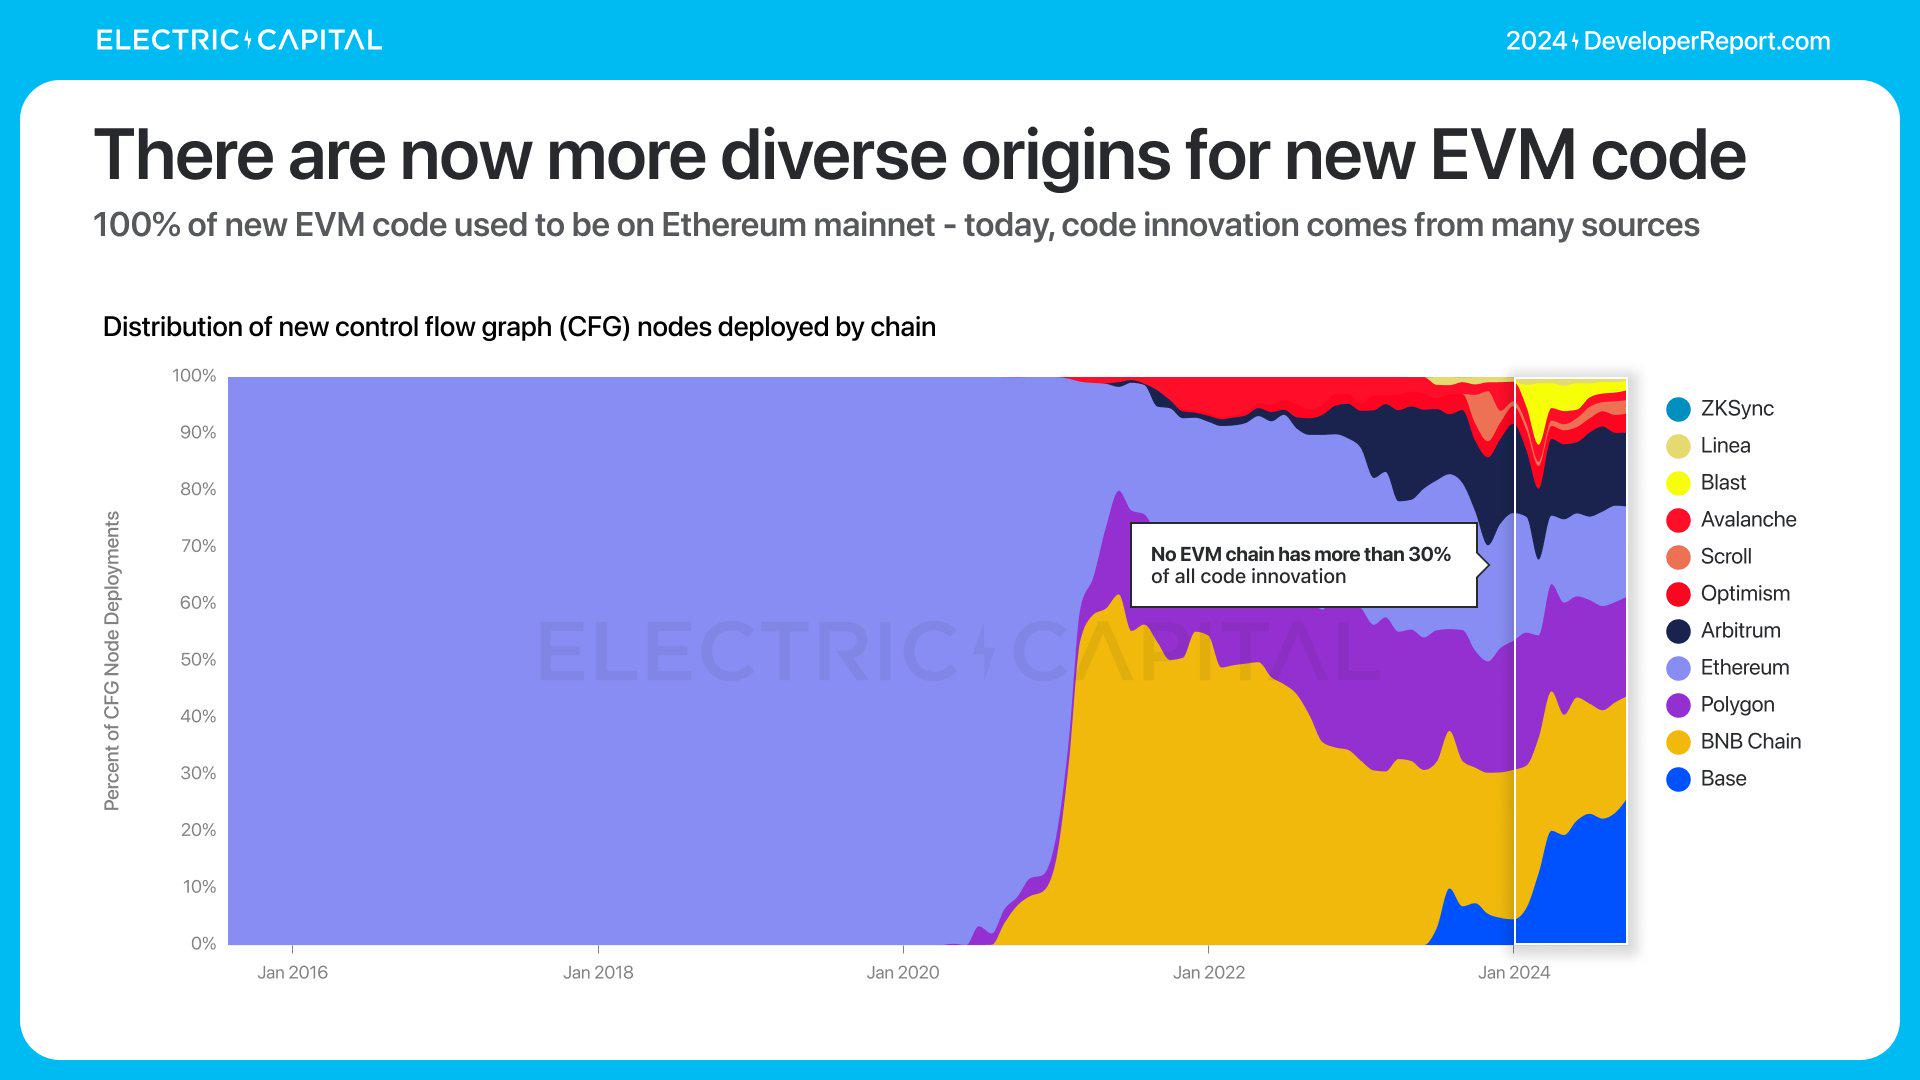
Before 2020, almost all of the original on-chain code logic in the EVM was on Ethereum. Today, no EVM chain has more than 30% of all code innovation.

Electric Capital's annual developer report: 39,000 new developers joined, more than half of Ethereum developers are committed to L2

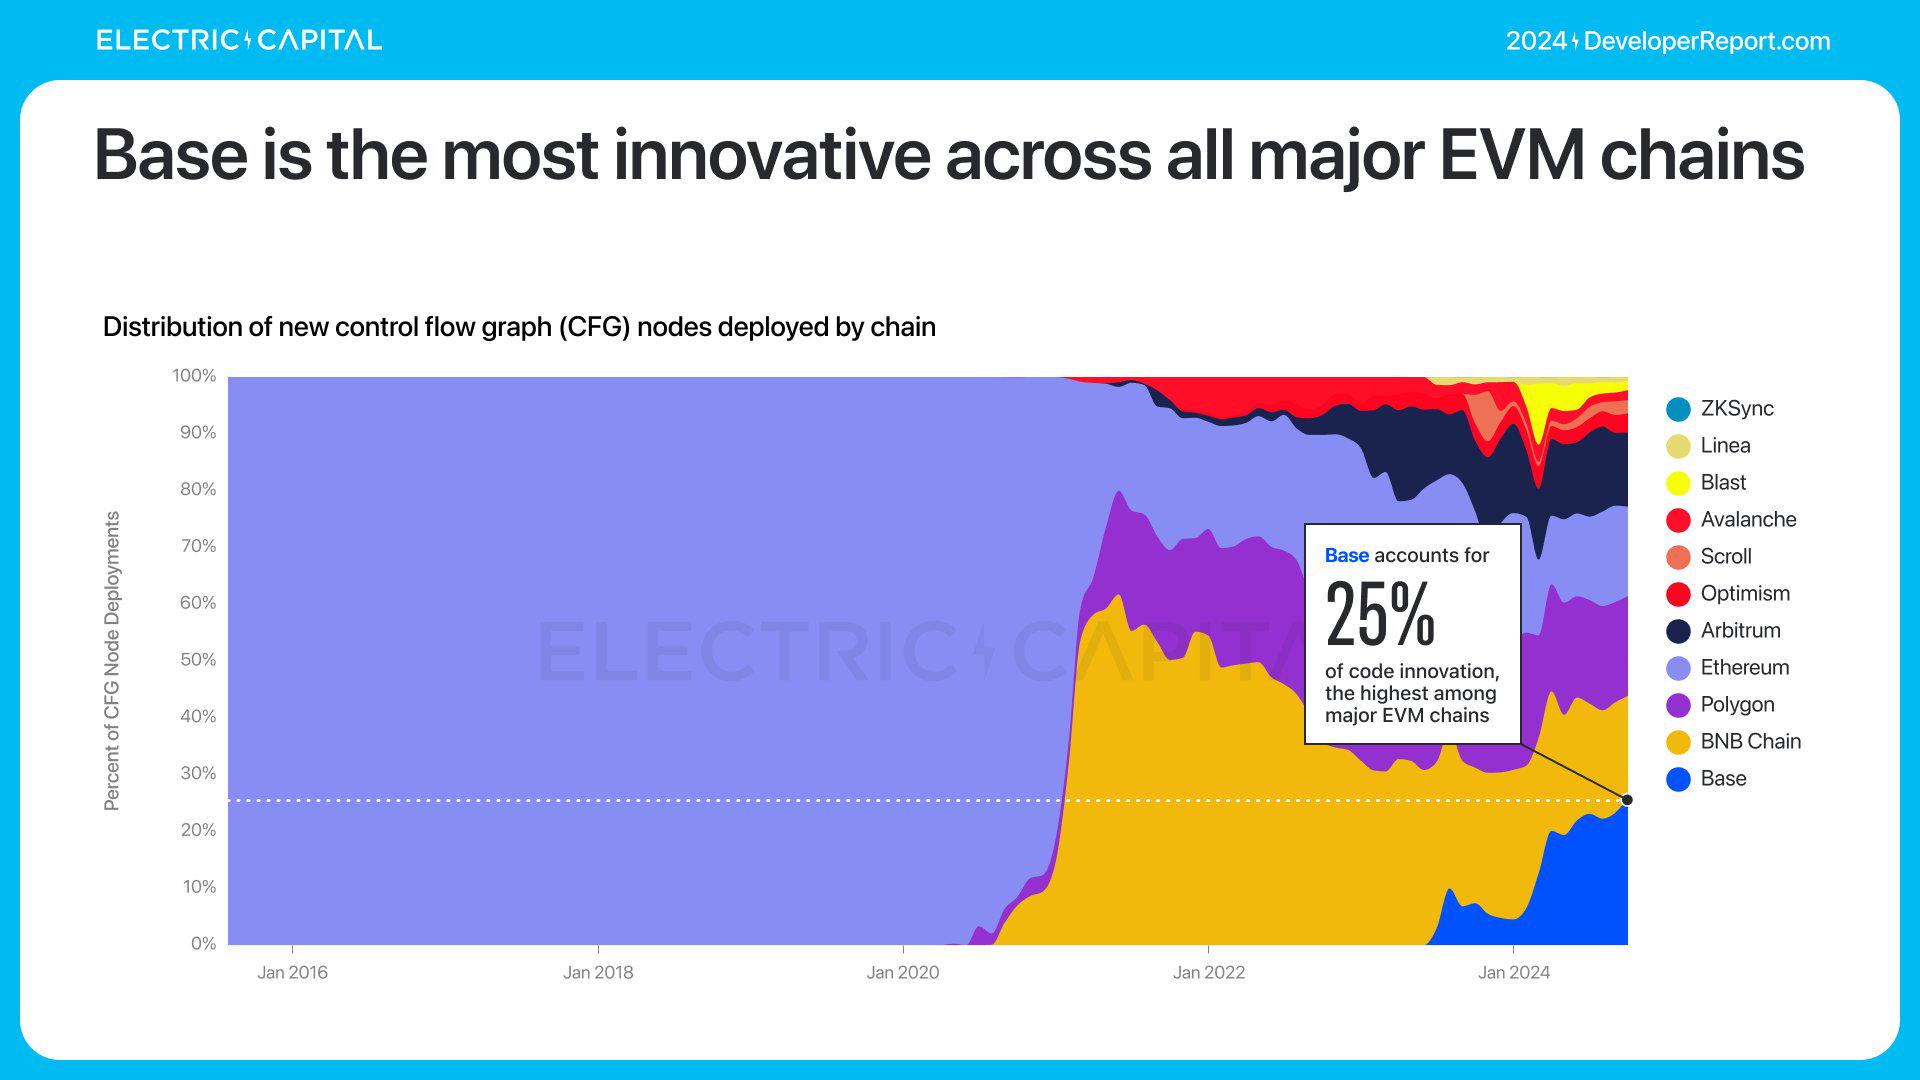
Base accounts for 25% of all original on-chain code logic in the EVM, the most among the mainstream EVM chains.

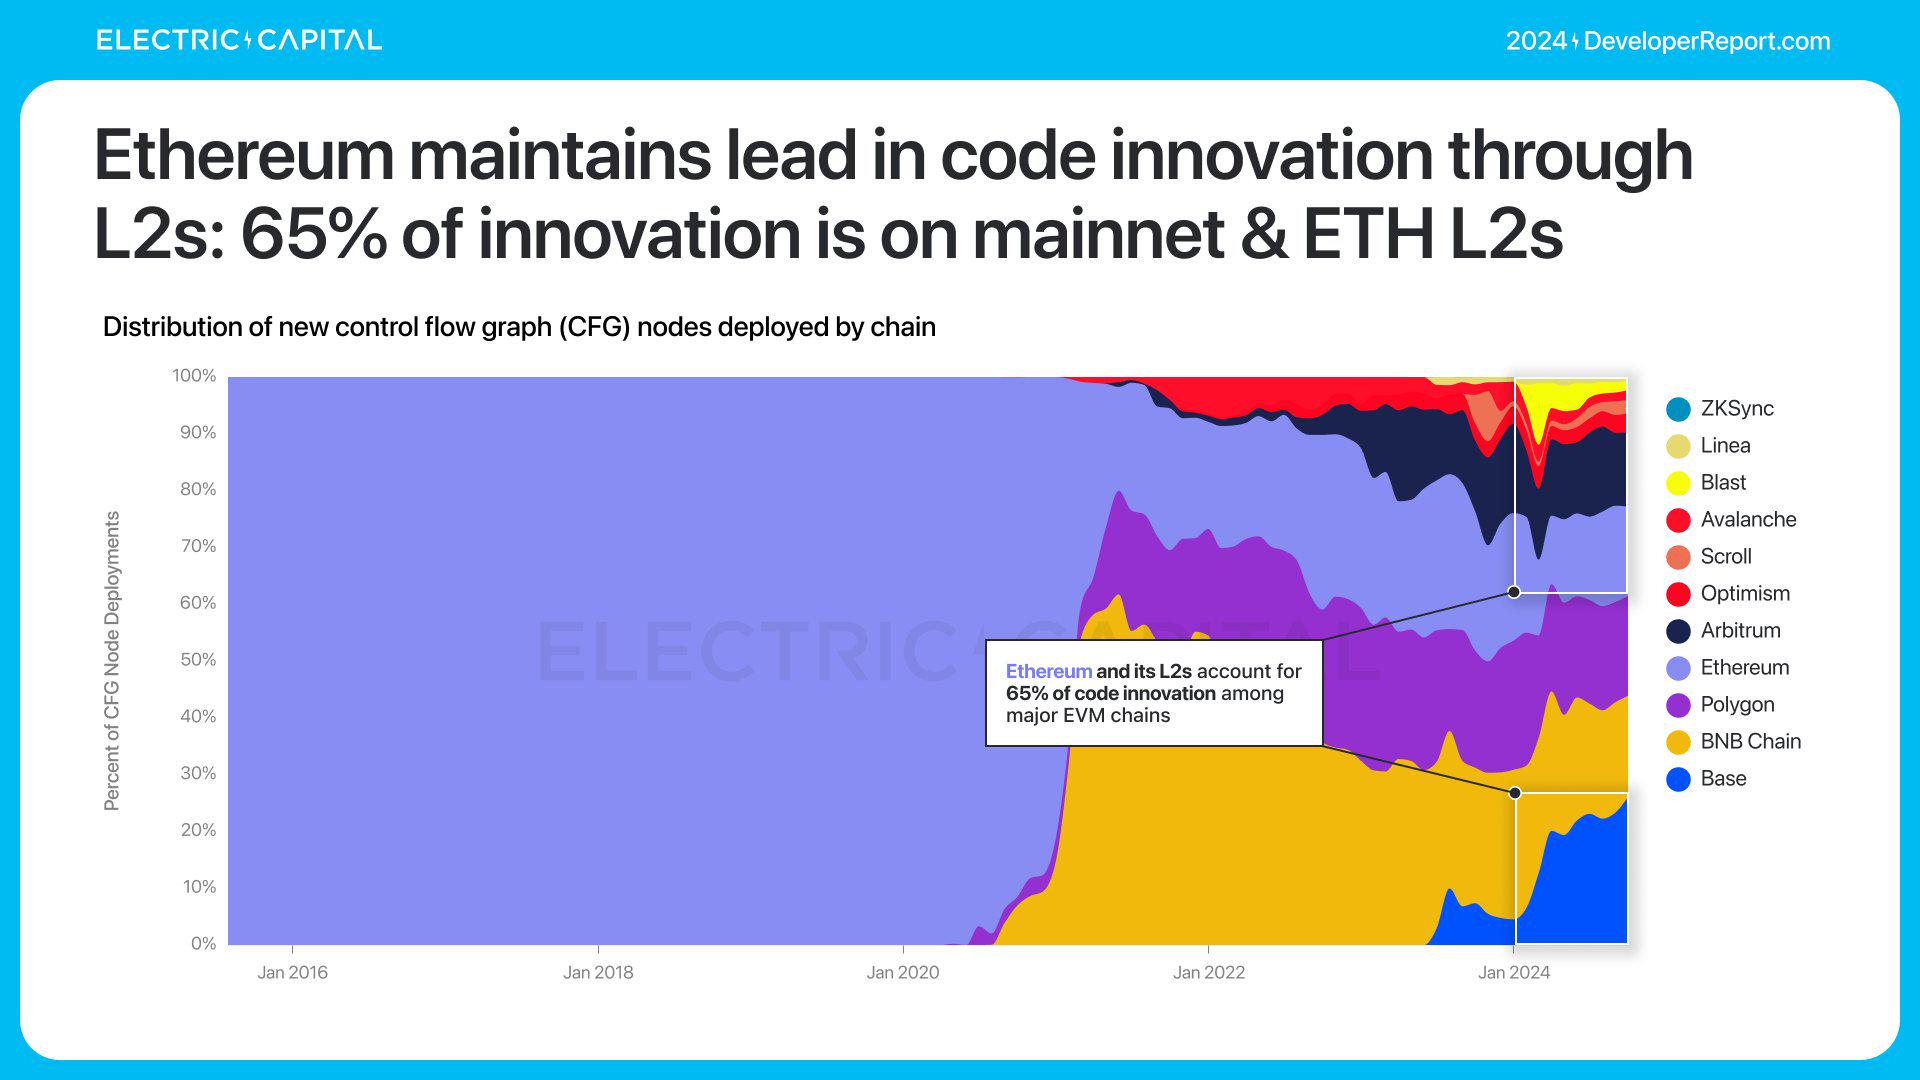
This is how the Ethereum ecosystem maintains its lead in code innovation through L2s. 65% of innovation happens on the mainnet and ETH L2s.

Electric Capital's annual developer report: 39,000 new developers joined, more than half of Ethereum developers are committed to L2

Electric Capital's annual developer report: 39,000 new developers joined, more than half of Ethereum developers are committed to L2

Ethereum

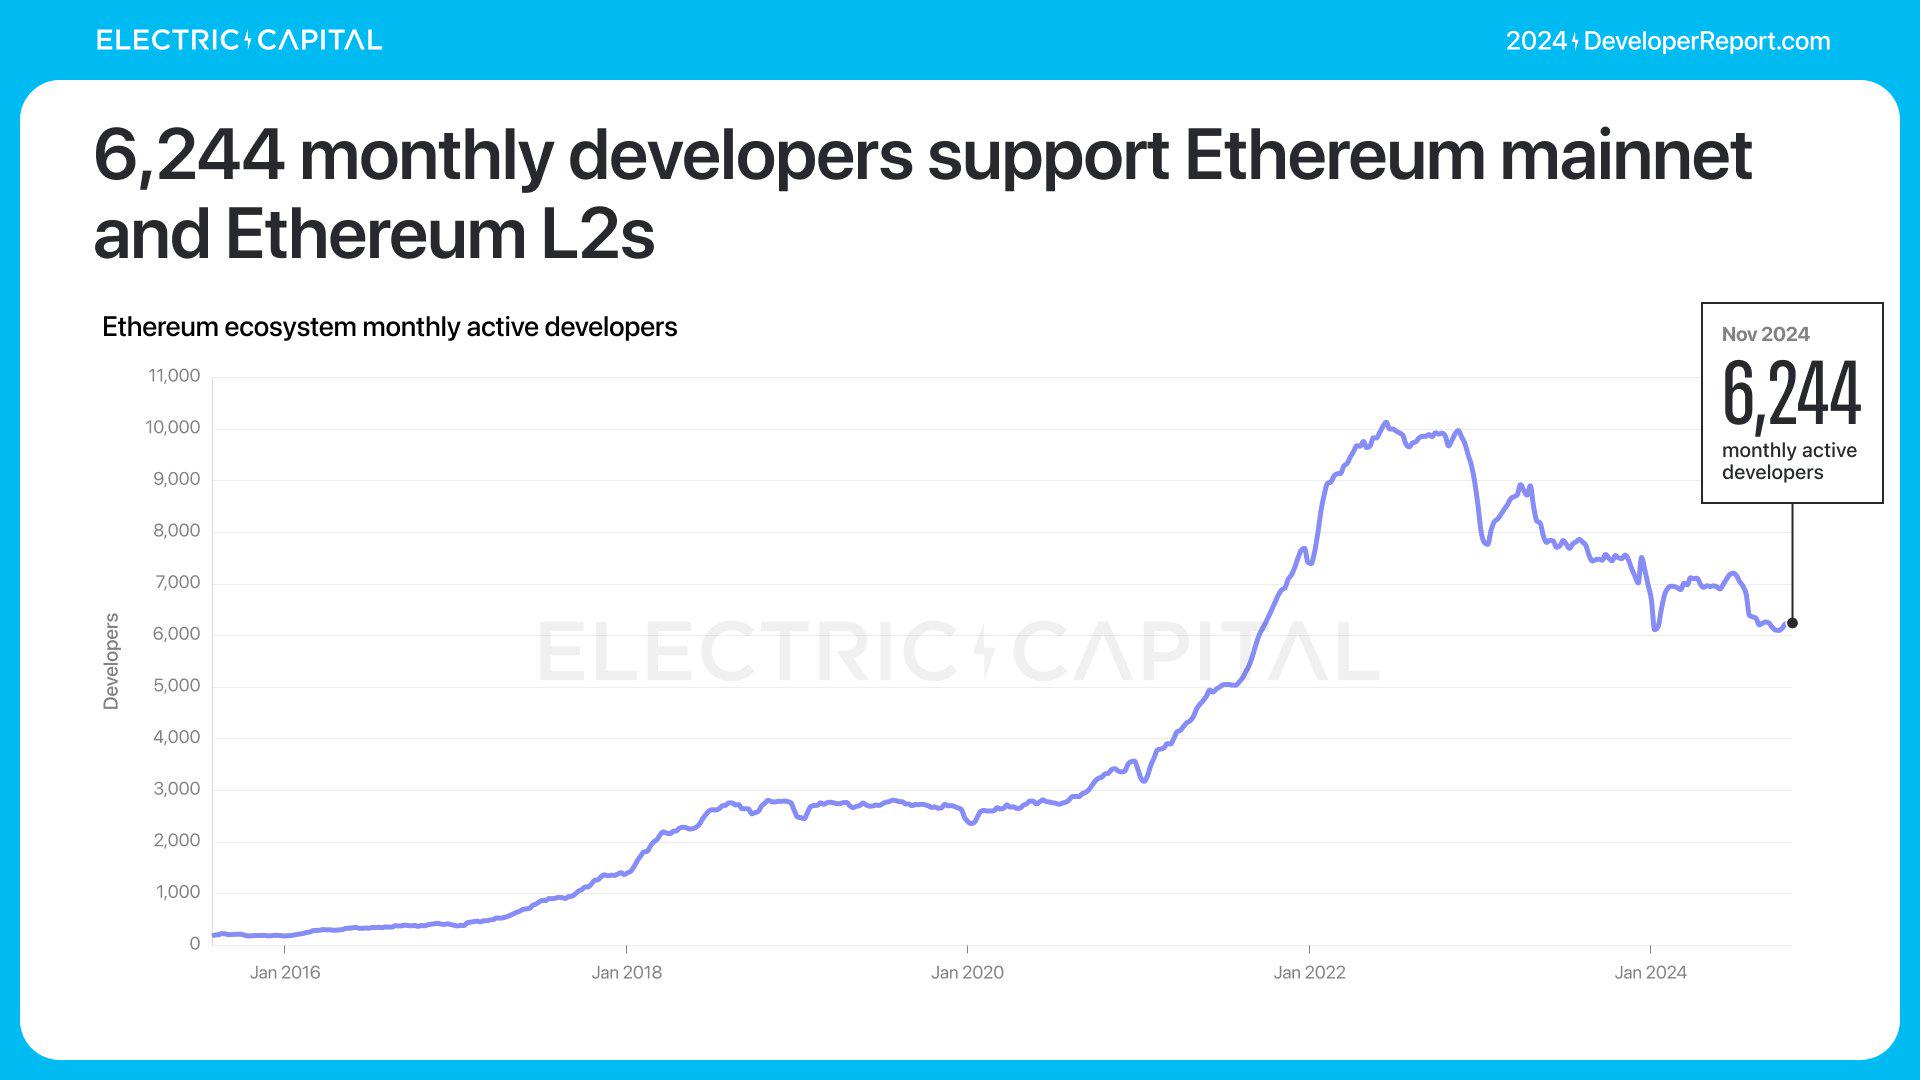
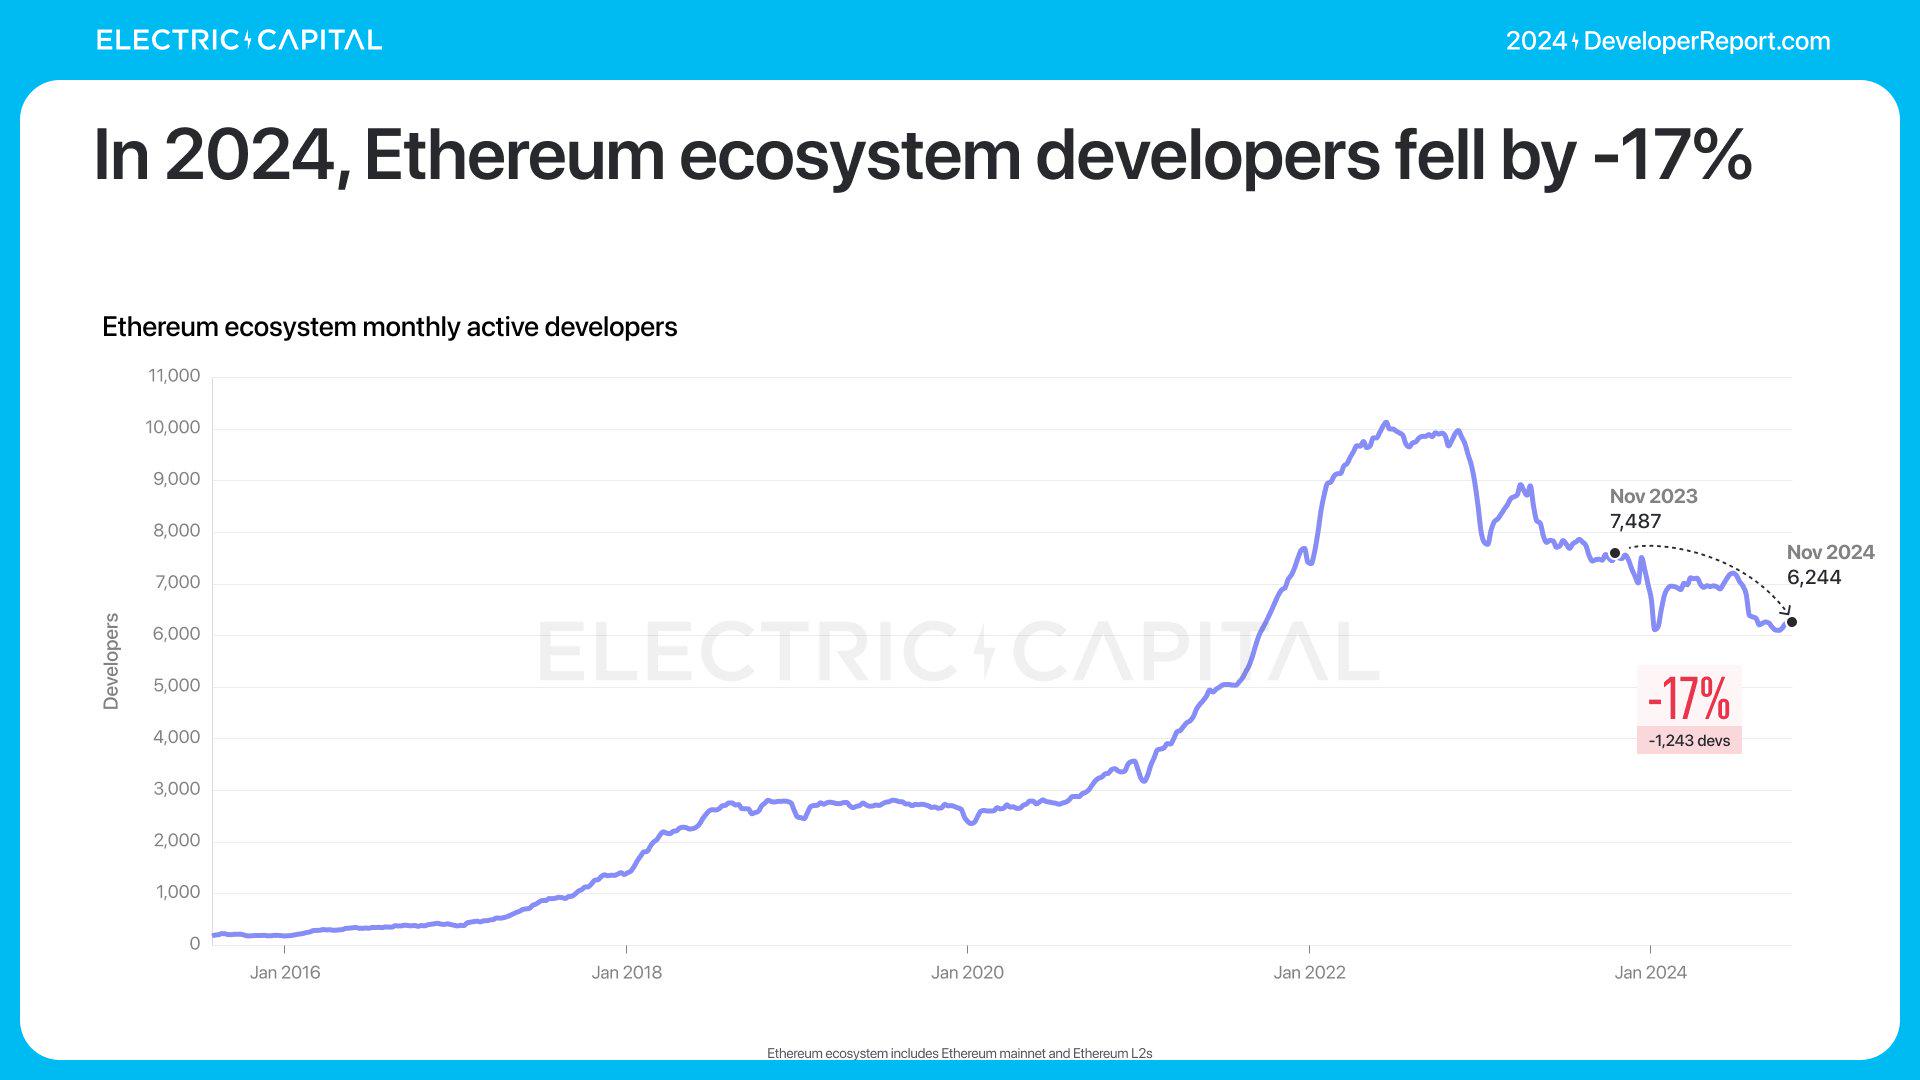
The Ethereum ecosystem demonstrates strong network effects through the dominance of EVM and multi-chain developers. The number of Ethereum monthly active developers is 6,244, down 17% year-on-year. Most of the loss is caused by developers who joined after 2021. The number of Ethereum developers with more than 2 years of experience increased by 21%.

Electric Capital's annual developer report: 39,000 new developers joined, more than half of Ethereum developers are committed to L2

Electric Capital's annual developer report: 39,000 new developers joined, more than half of Ethereum developers are committed to L2

Electric Capital's annual developer report: 39,000 new developers joined, more than half of Ethereum developers are committed to L2

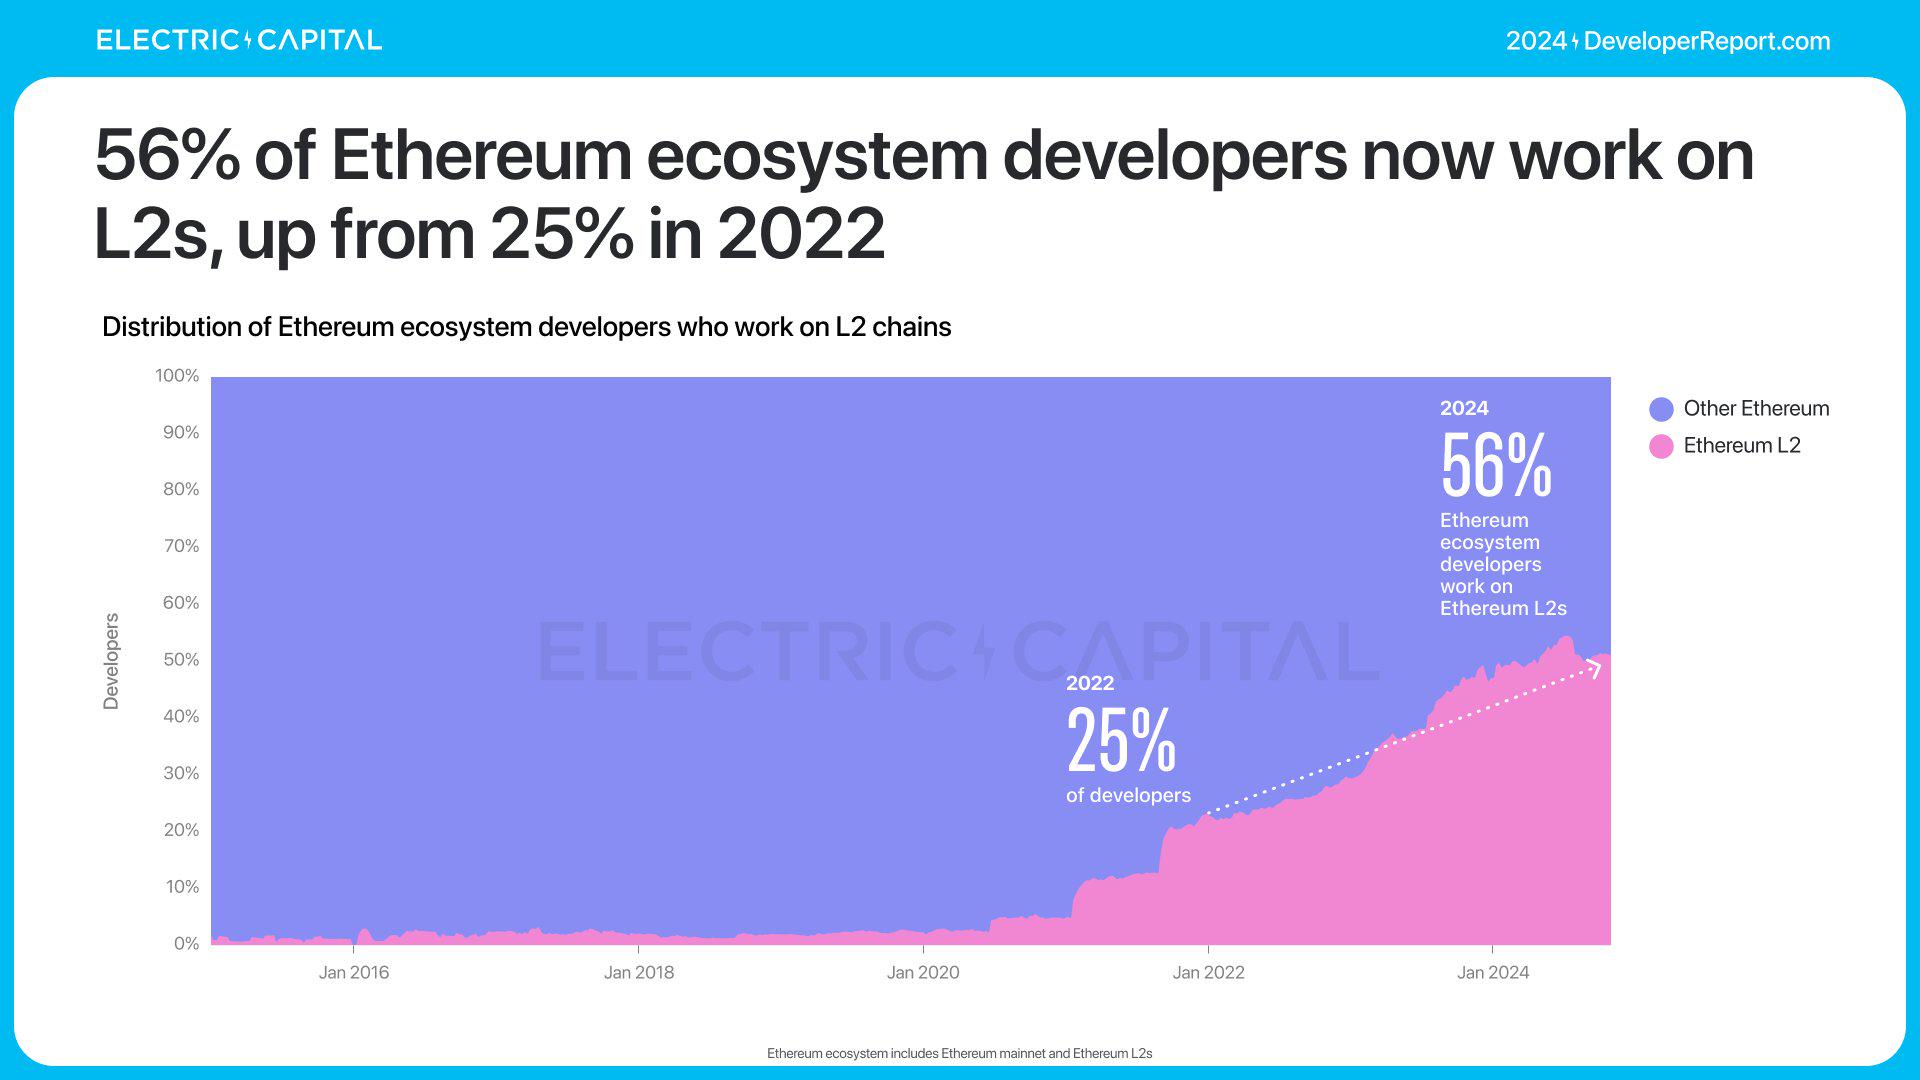
Currently, more than half of Ethereum developers are working on L2s, up from 25% in 2022.

Electric Capital's annual developer report: 39,000 new developers joined, more than half of Ethereum developers are committed to L2

Ethereum L2s has seen a dramatic increase in developers over the past 4 years, with 3,592 active developers per month, an annualized growth rate of 67% since the launch of Arbitrum in 2021.

Electric Capital's annual developer report: 39,000 new developers joined, more than half of Ethereum developers are committed to L2

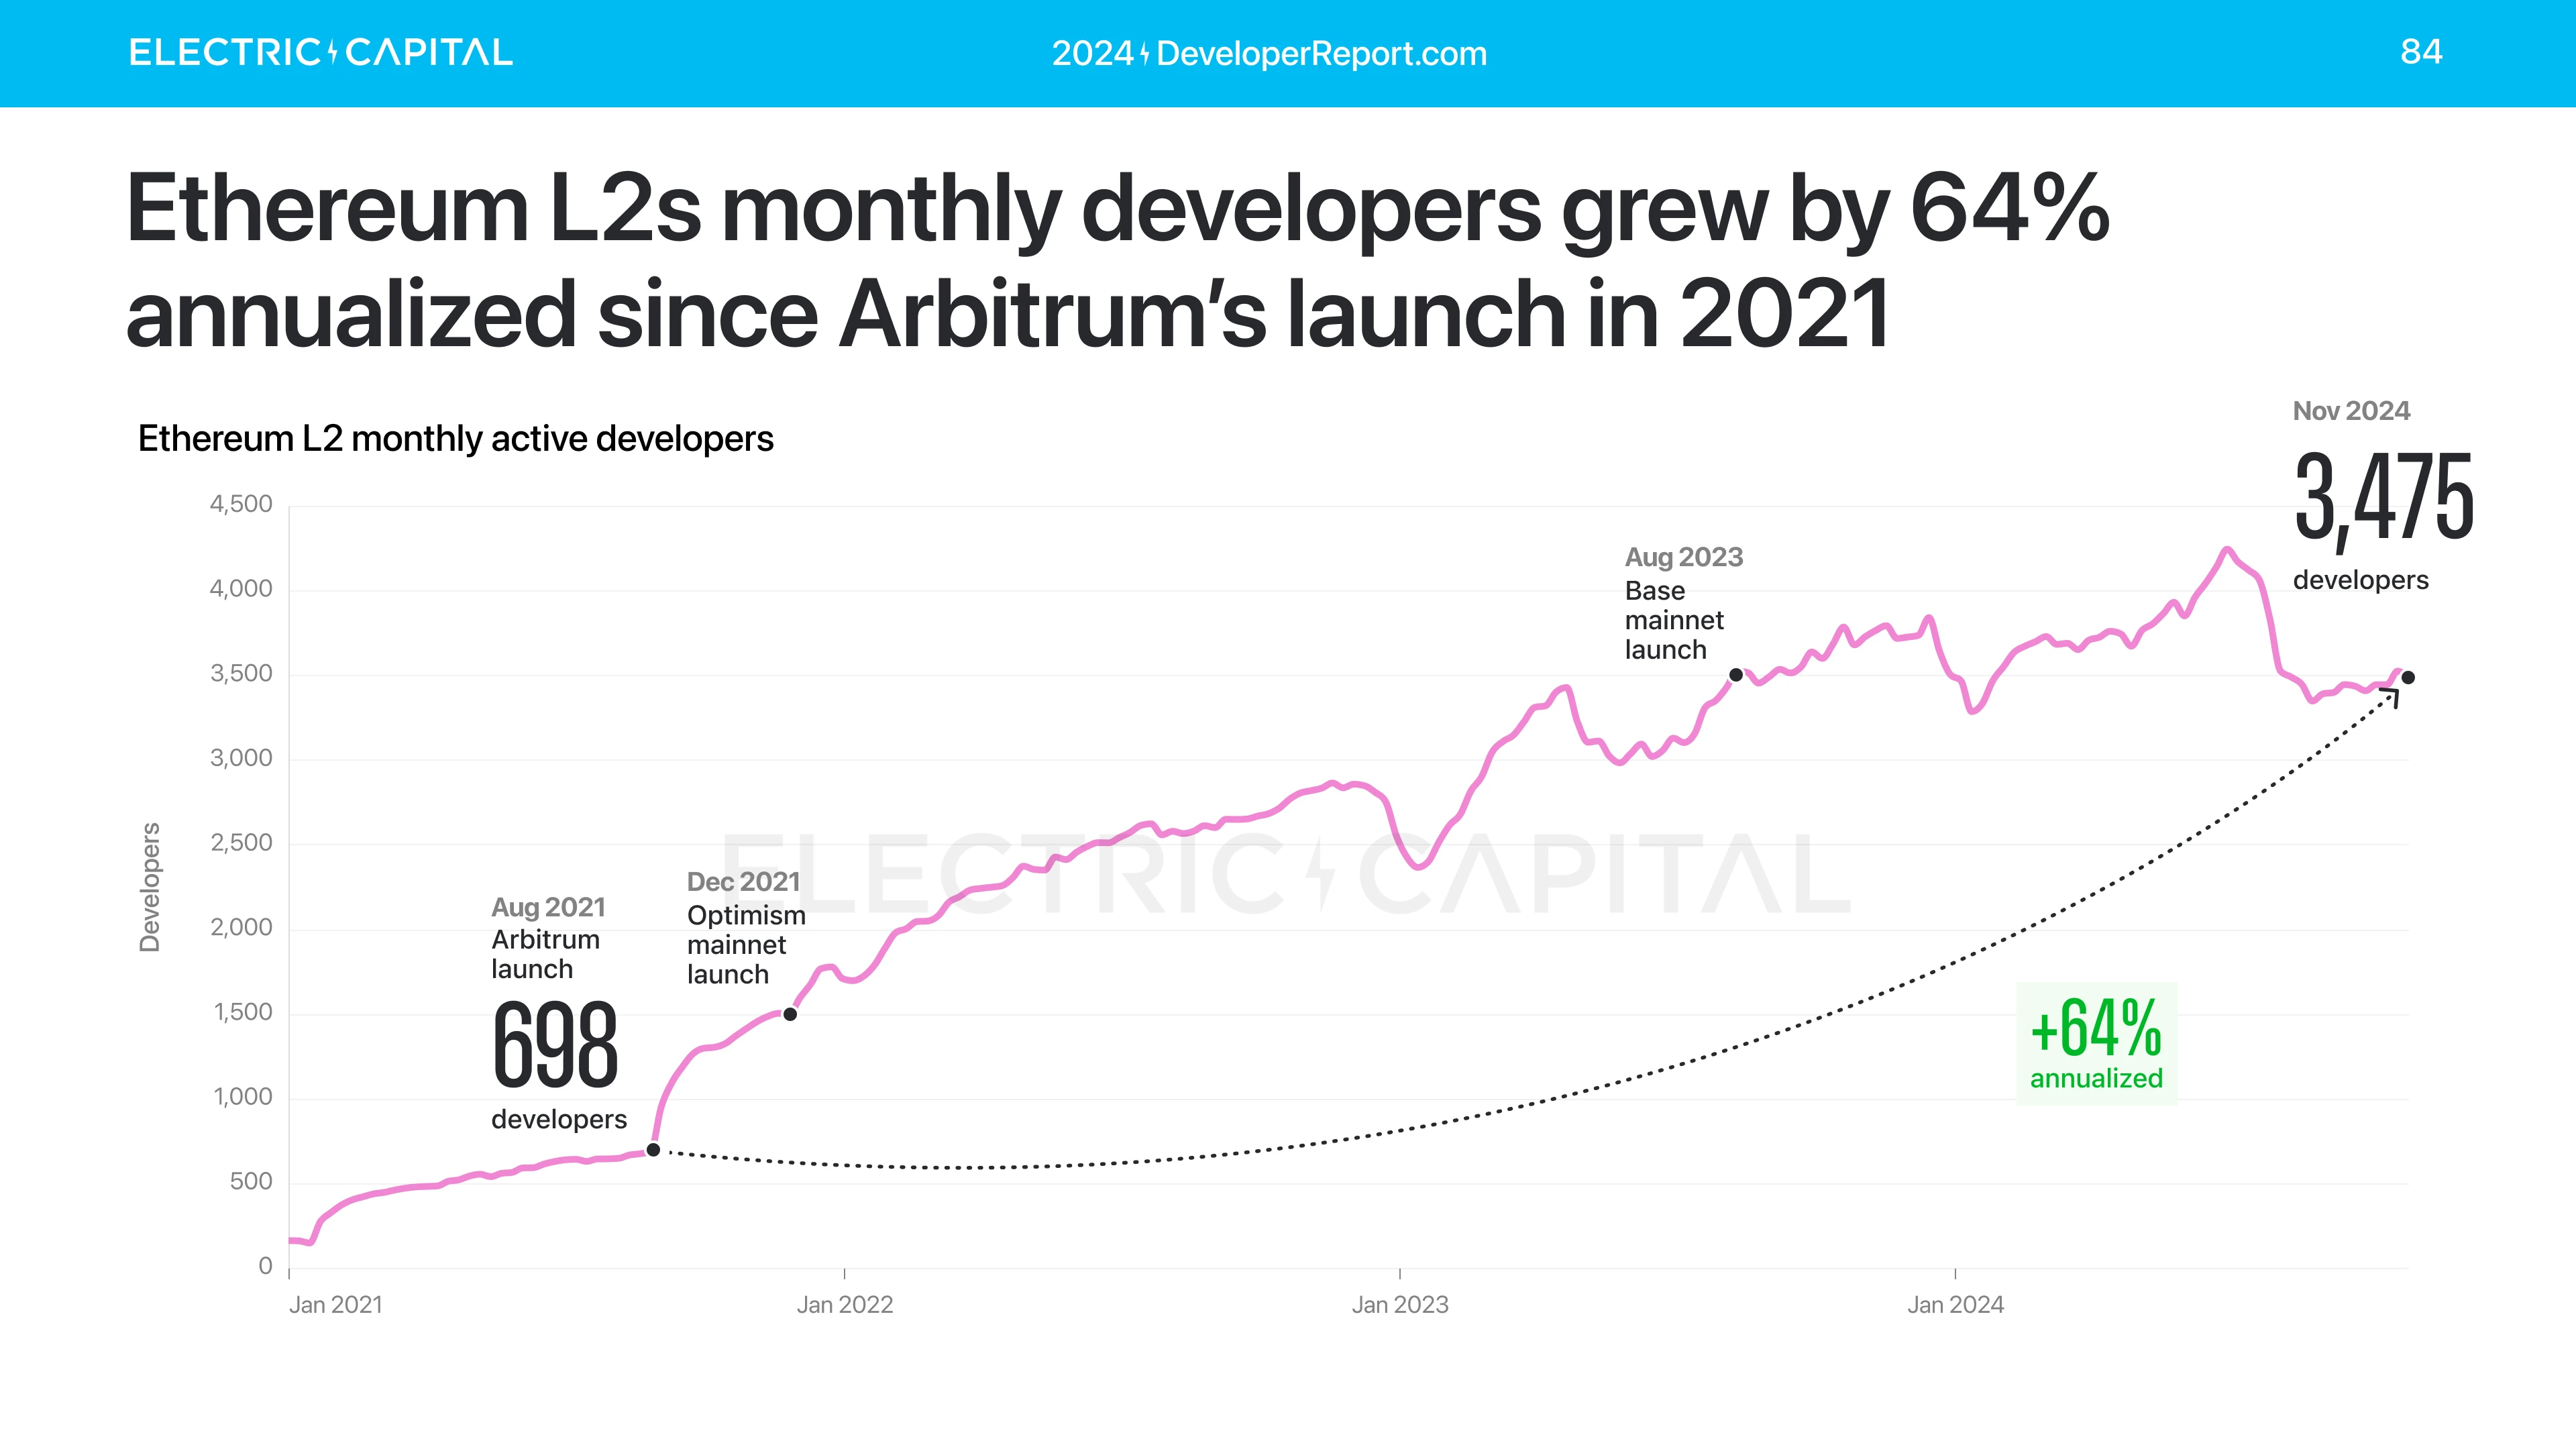
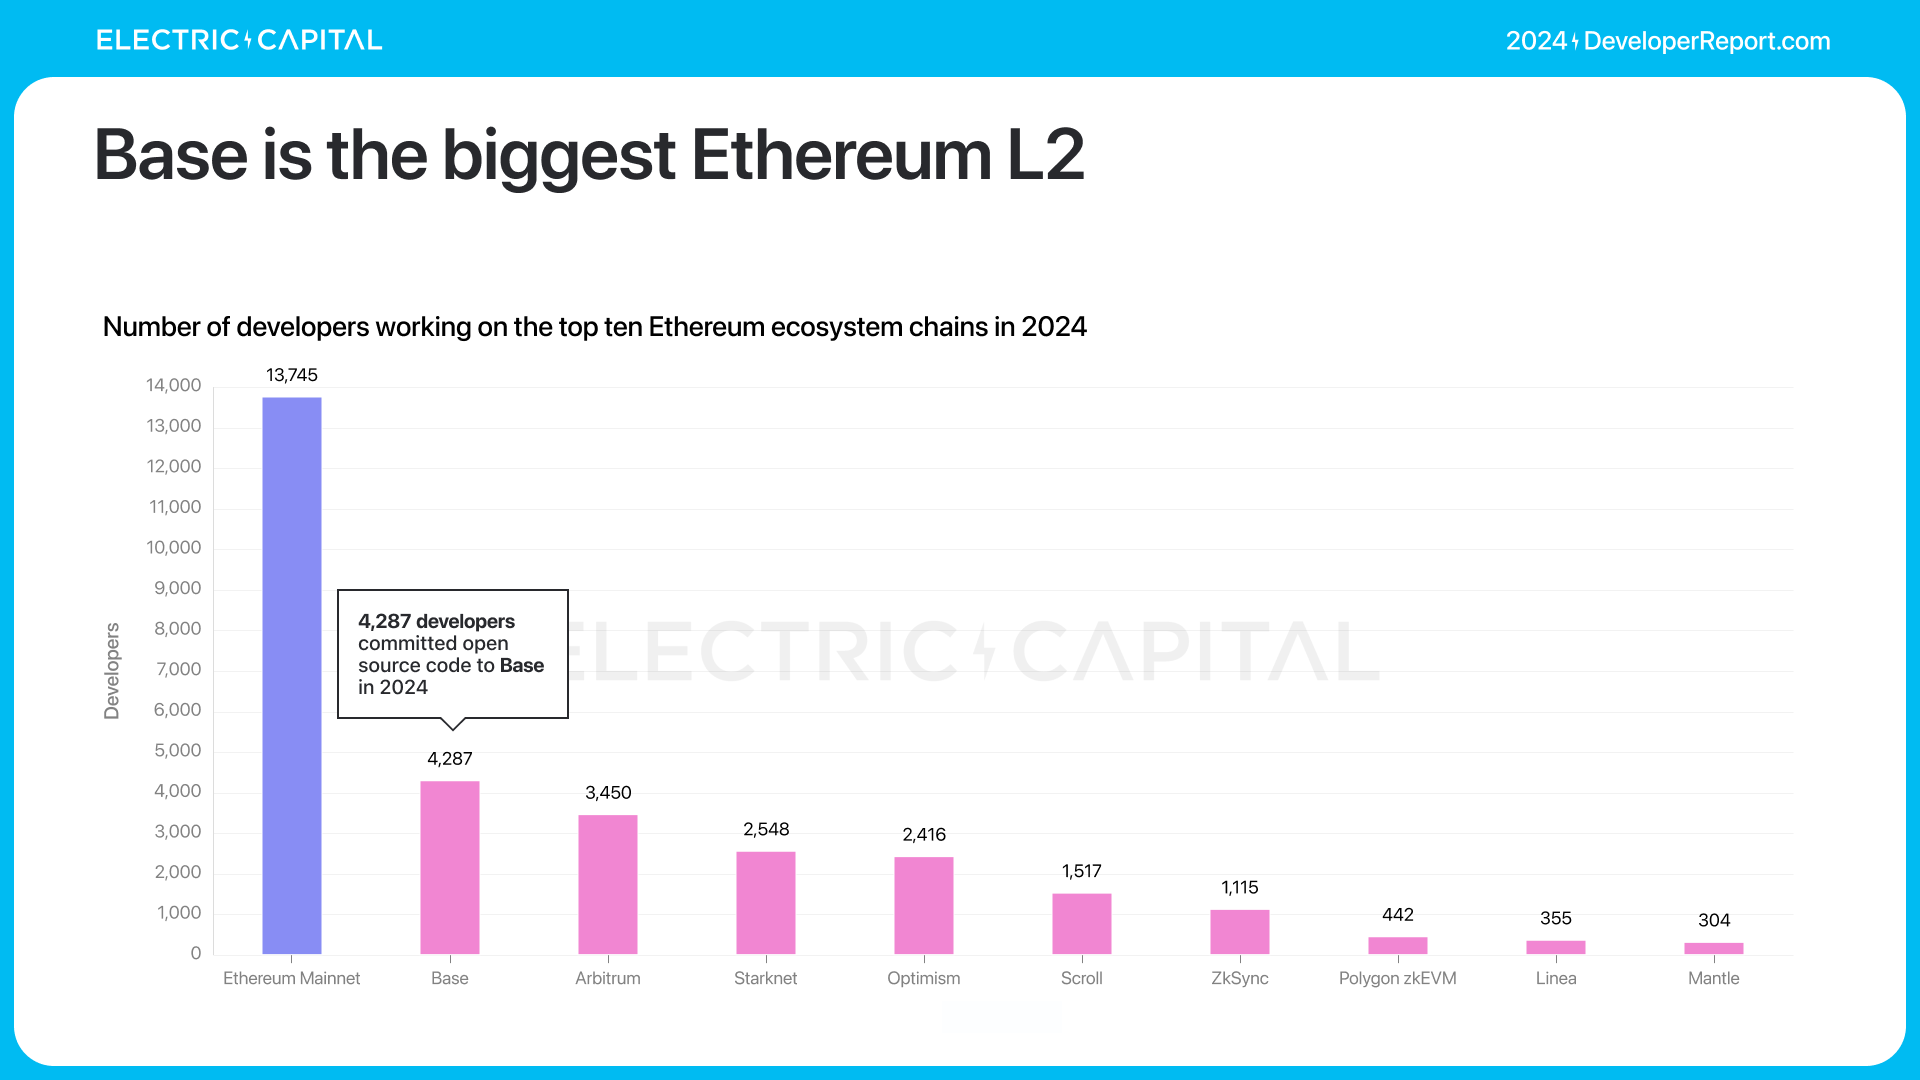
Base is the largest Ethereum L2. Arbitrum, Starknet, and Optimism will have 2,000+ developers in 2024.
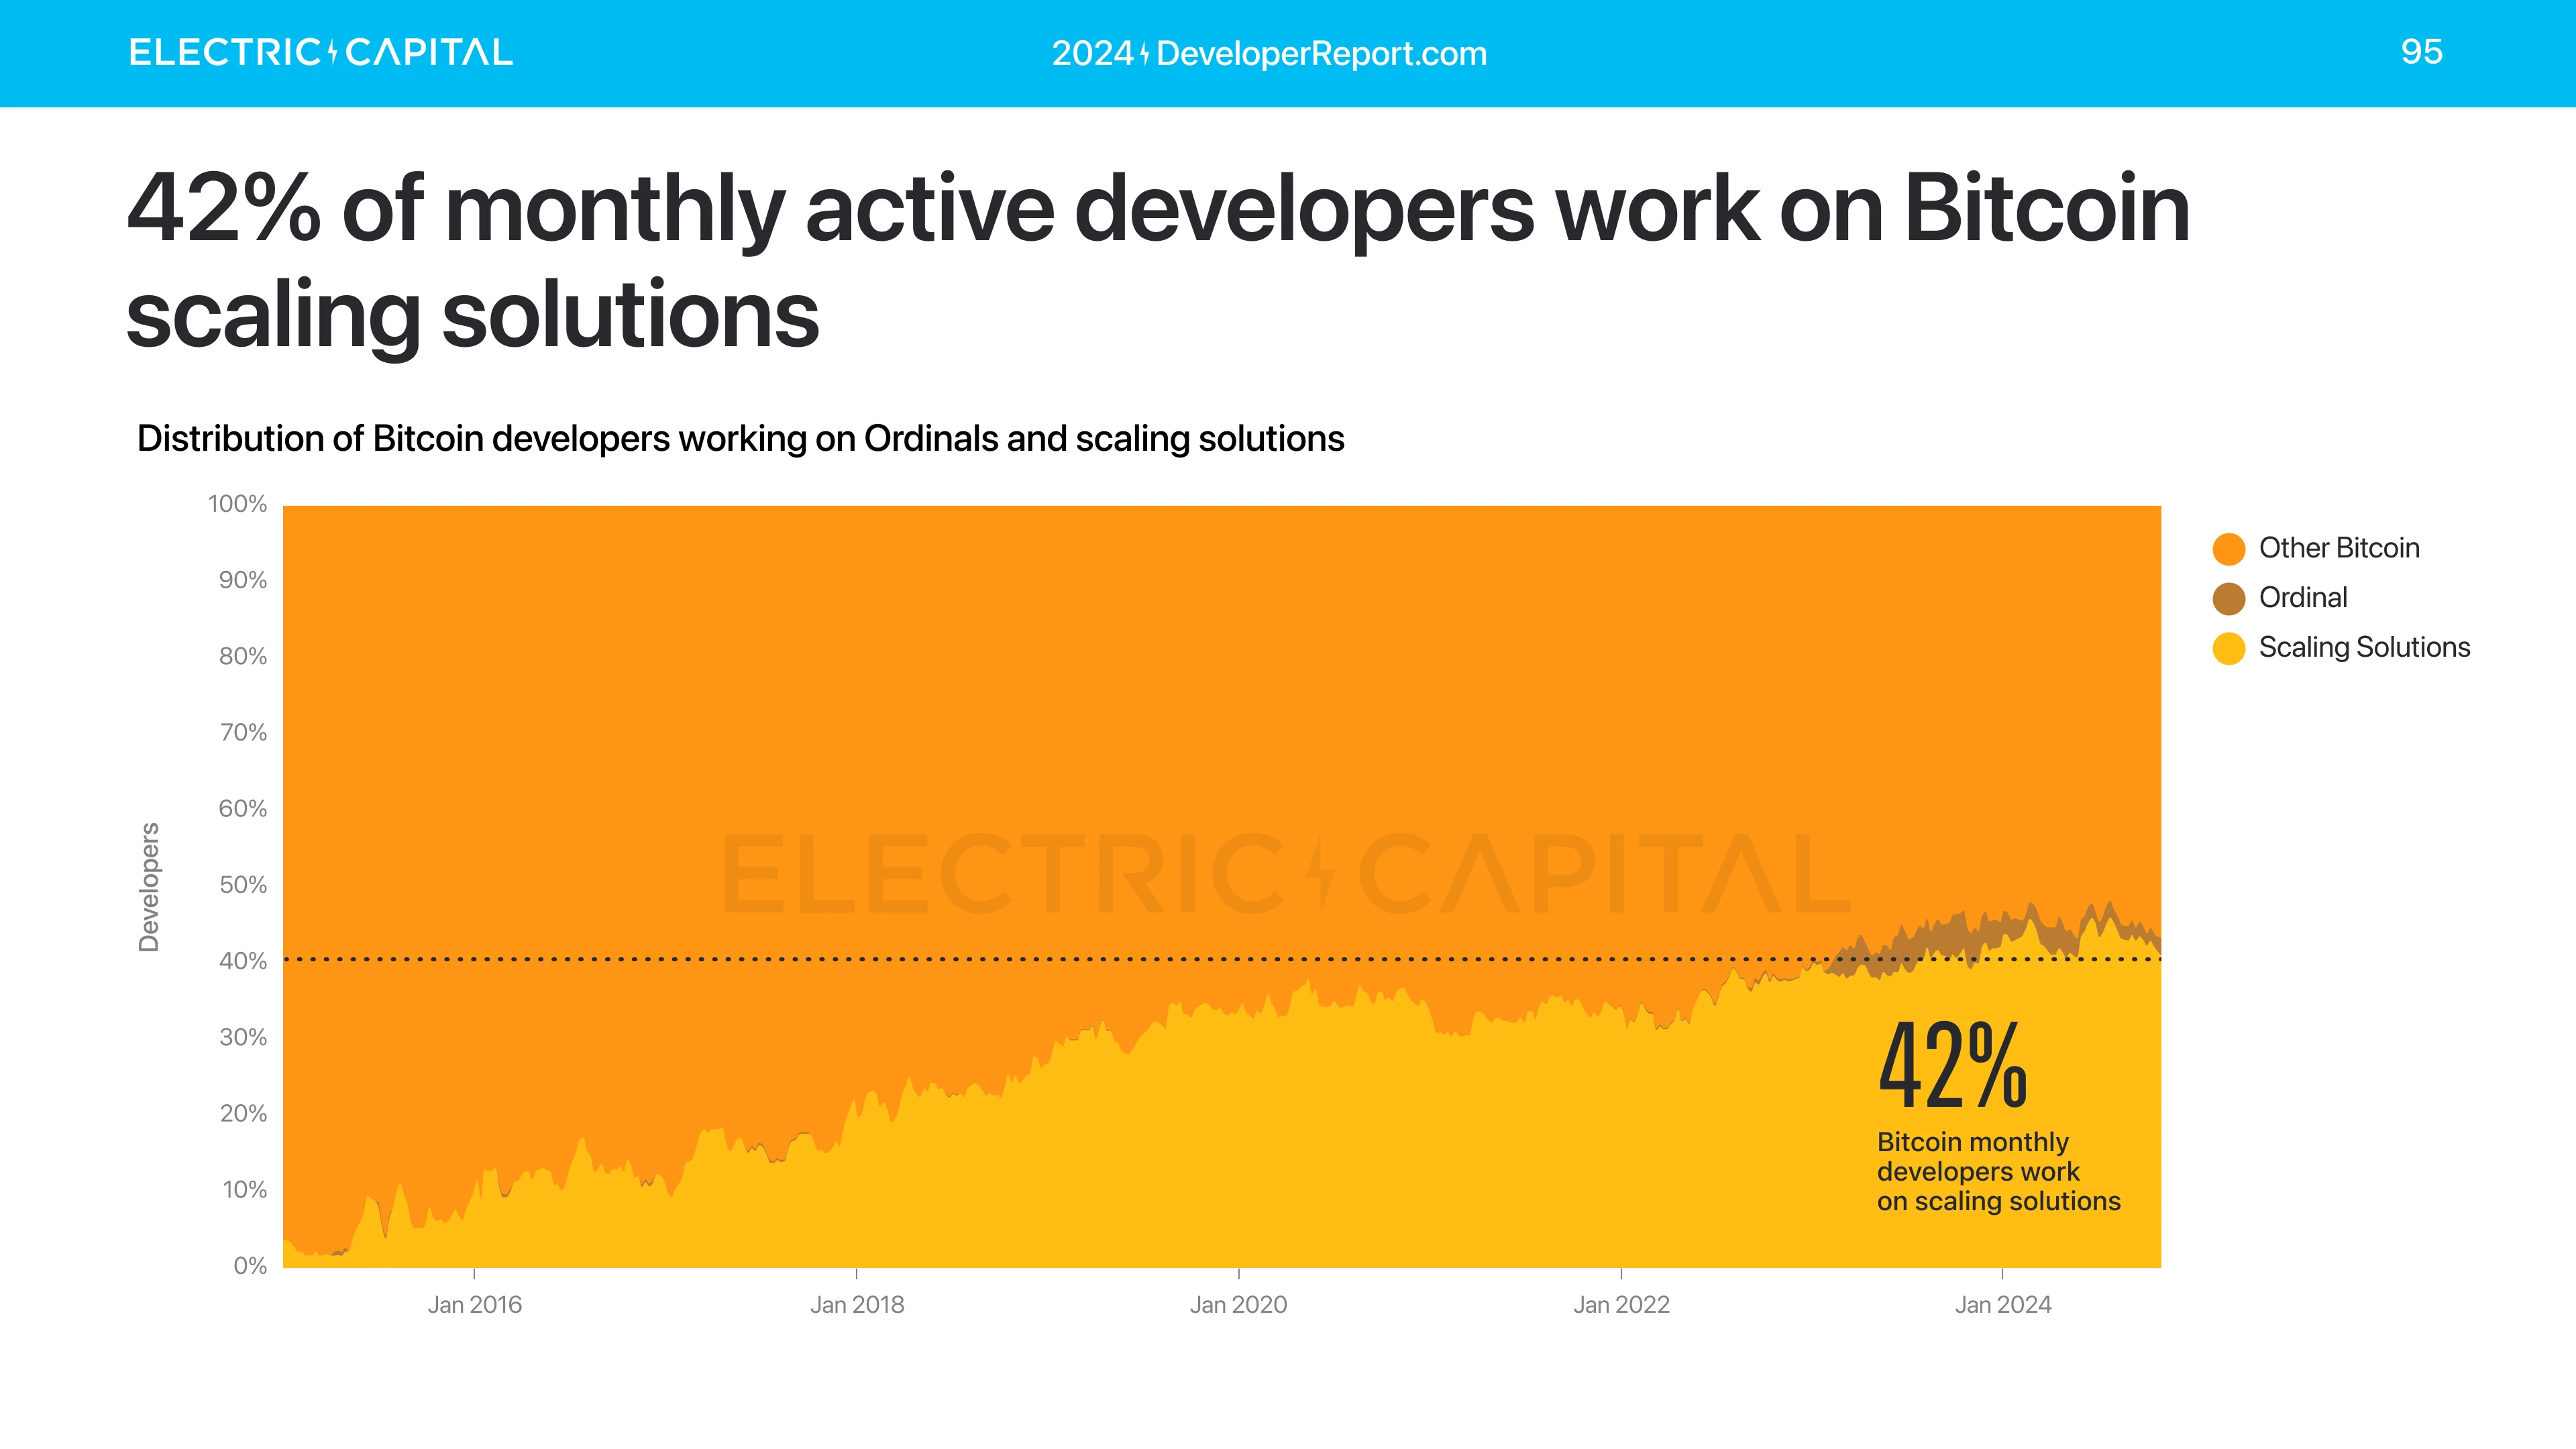
Electric Capital's annual developer report: 39,000 new developers joined, more than half of Ethereum developers are committed to L2

Bitcoin

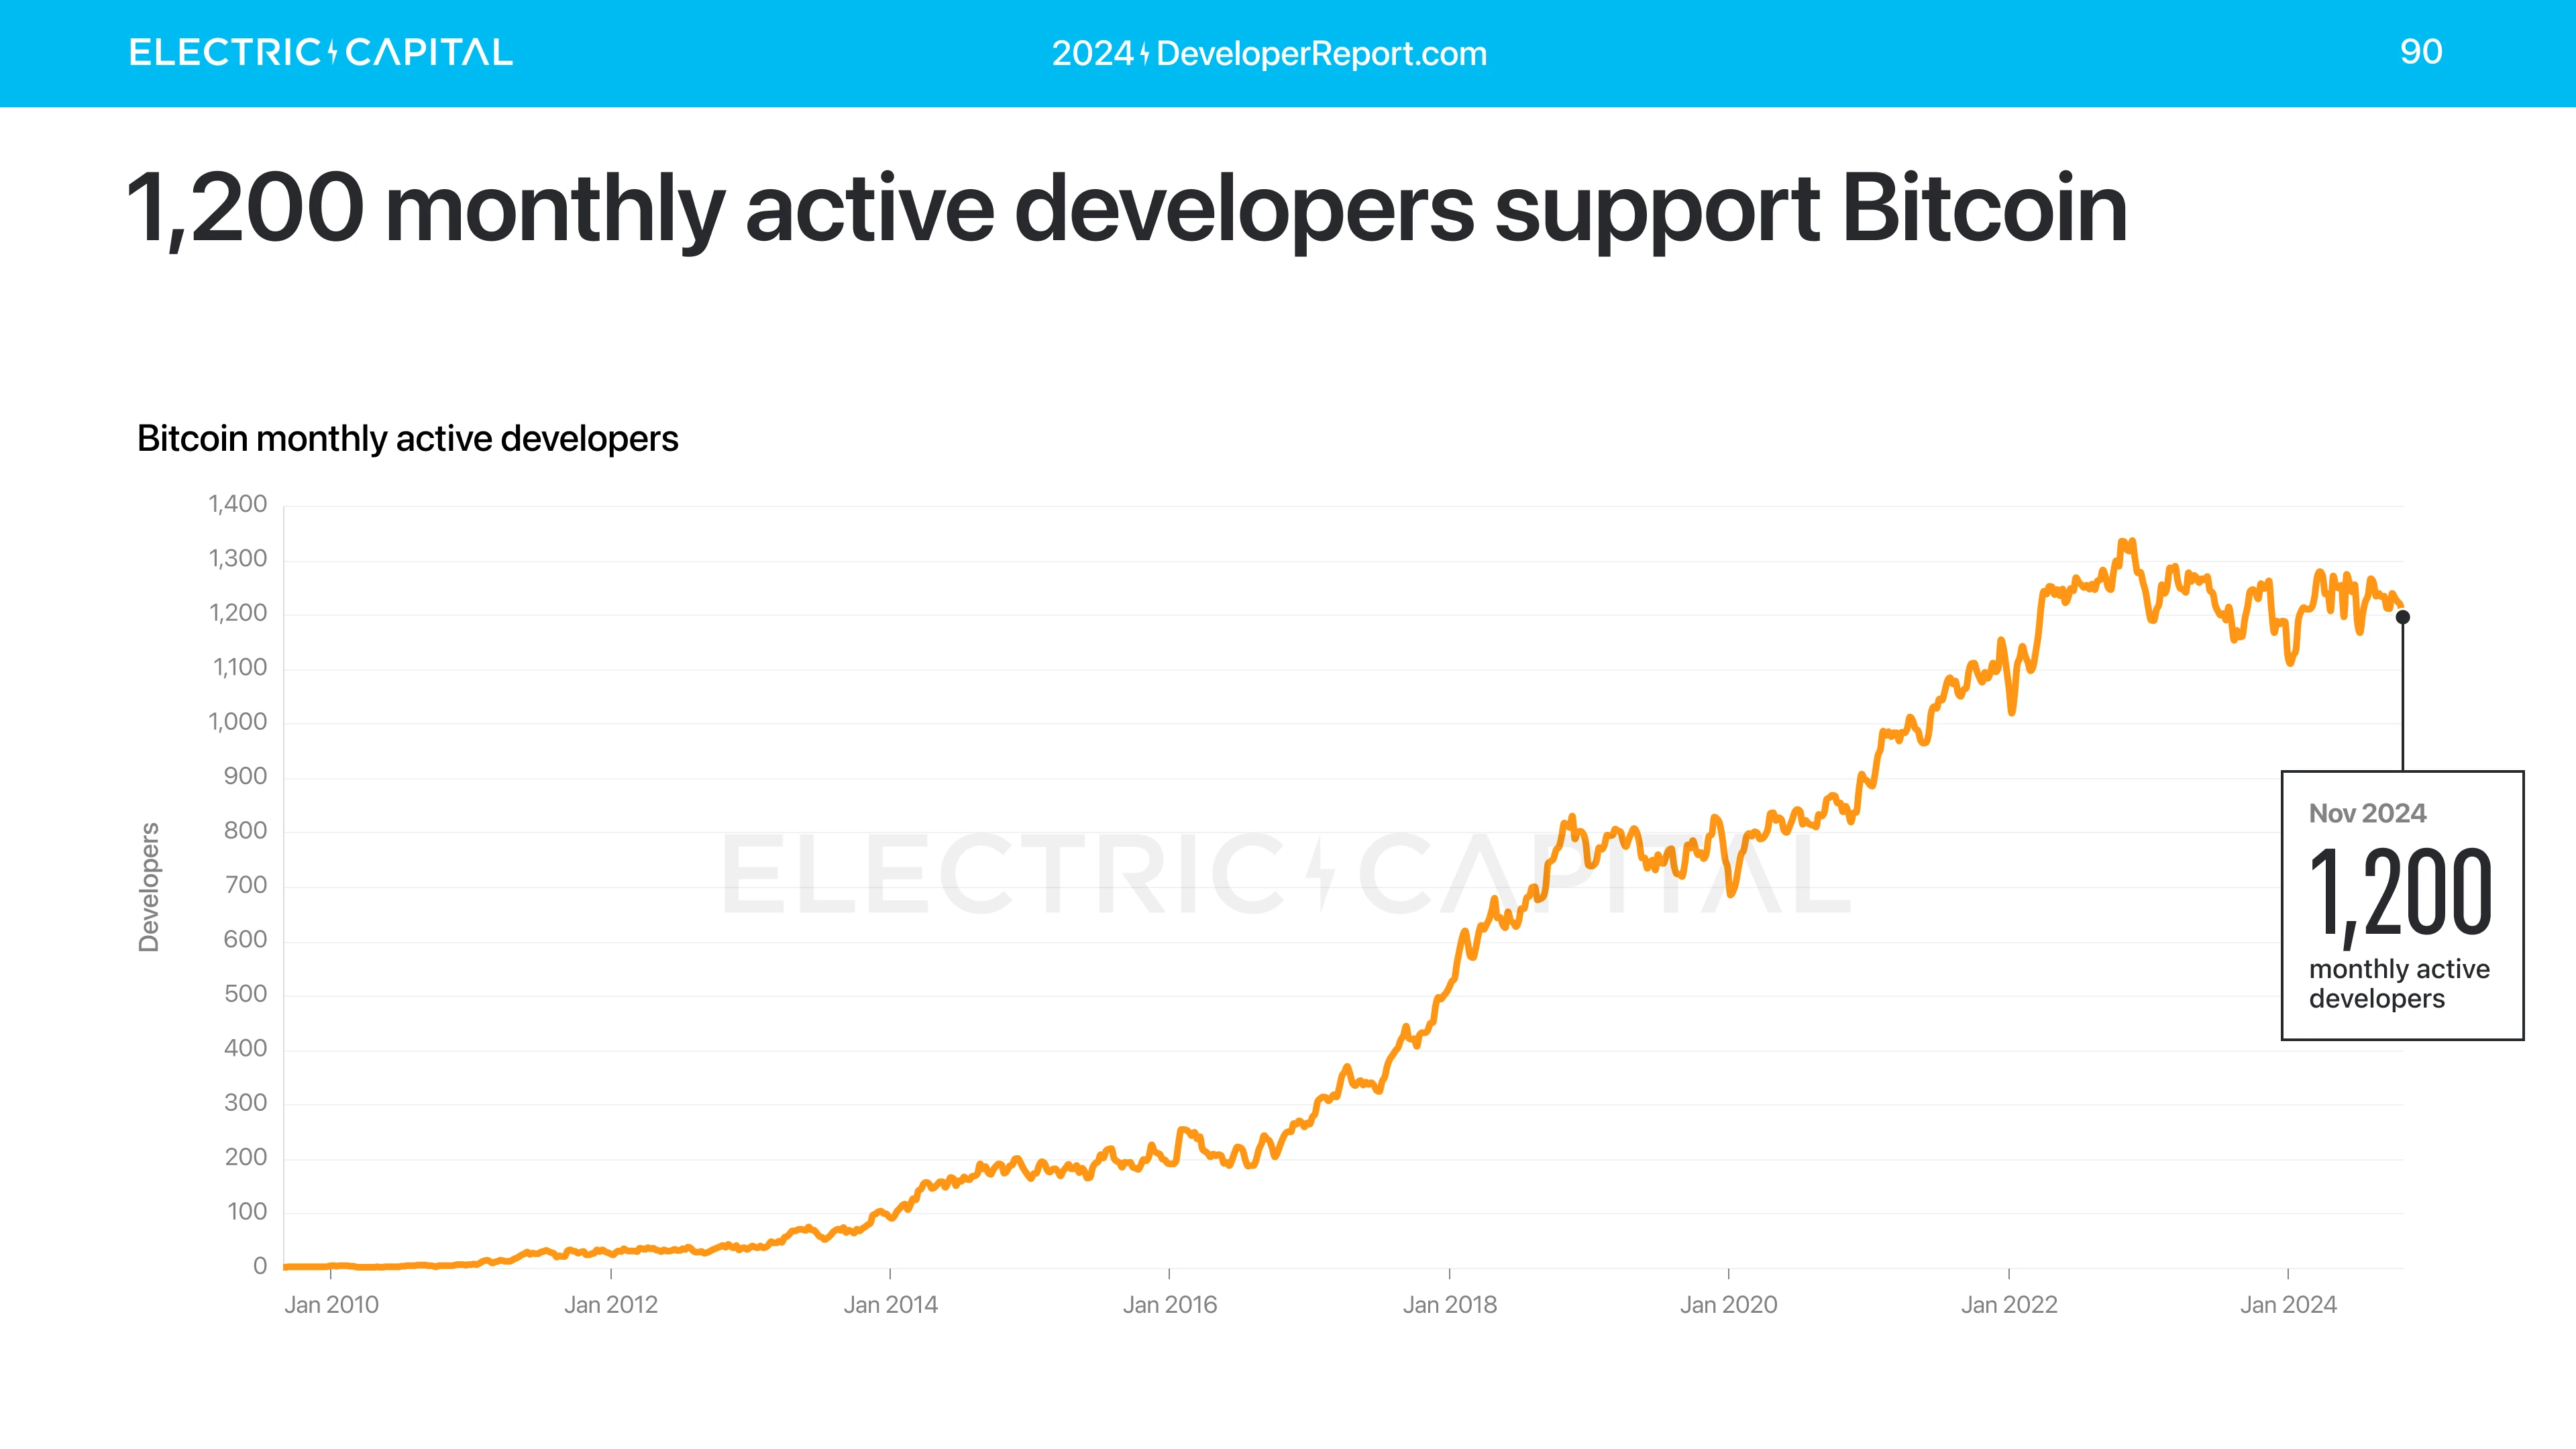
Bitcoin has 1,200 active developers per month, which will remain the same in 2024.

Electric Capital's annual developer report: 39,000 new developers joined, more than half of Ethereum developers are committed to L2

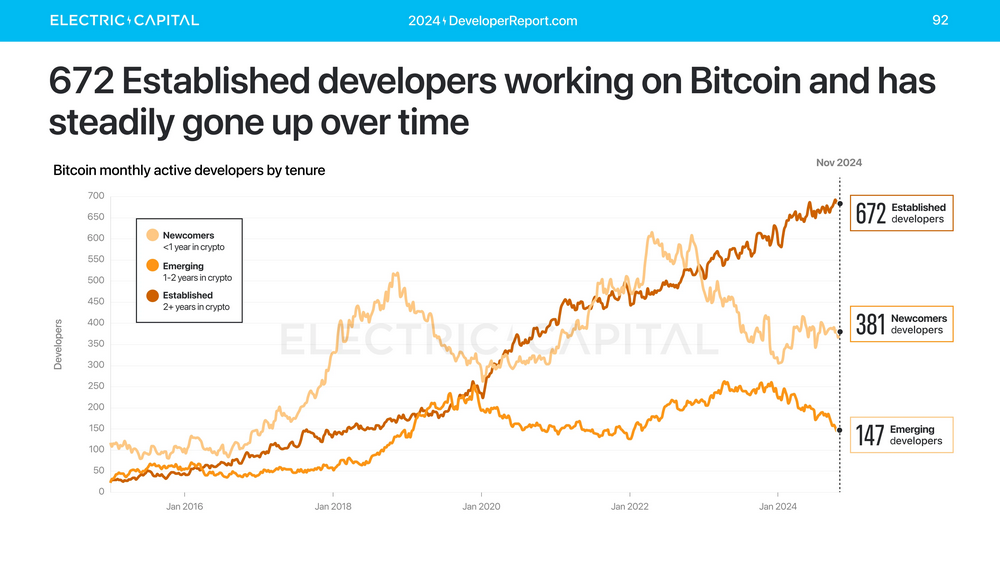
The number of senior Bitcoin developers (working for more than 2 years) has been rising steadily. The highest number of active senior Bitcoin developers per month was 672.

Electric Capital's annual developer report: 39,000 new developers joined, more than half of Ethereum developers are committed to L2

42% of Bitcoin developers (almost half) are working on Bitcoin scaling solutions.
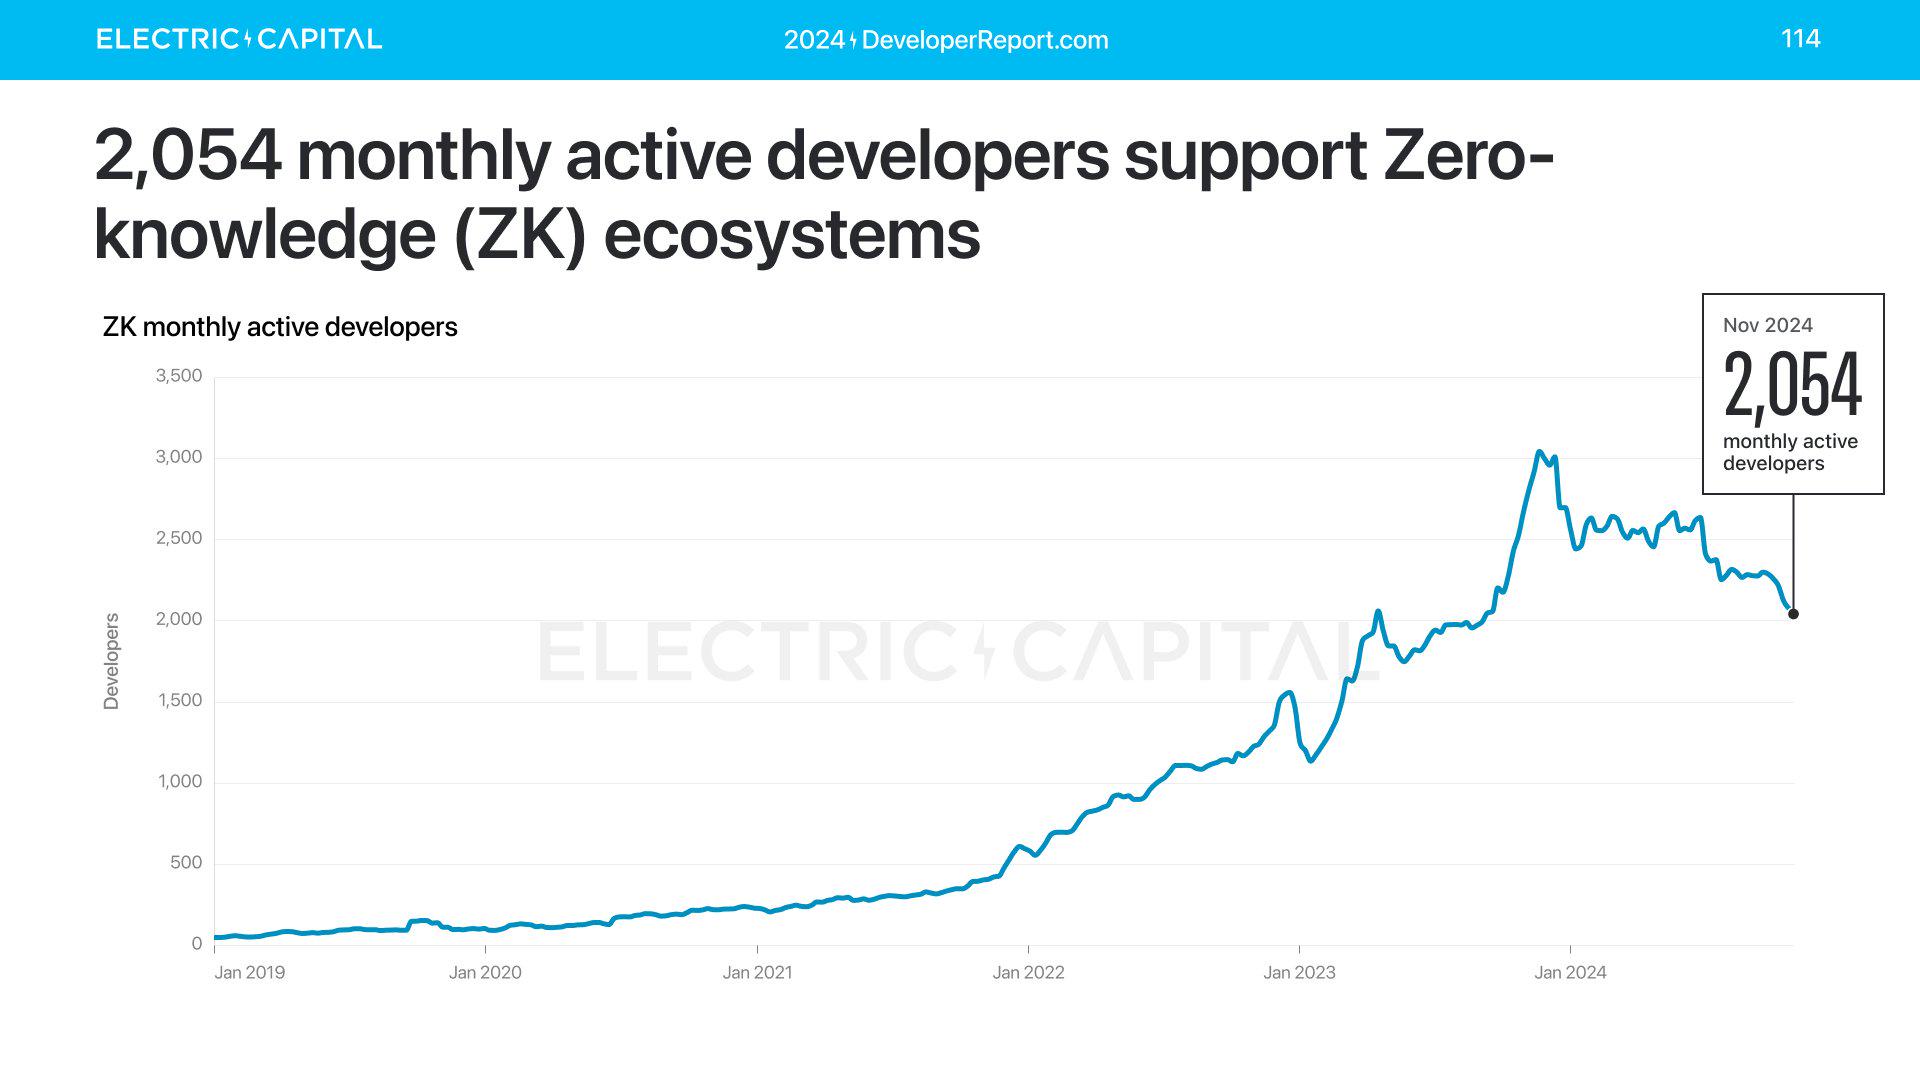
Electric Capital's annual developer report: 39,000 new developers joined, more than half of Ethereum developers are committed to L2

ZK

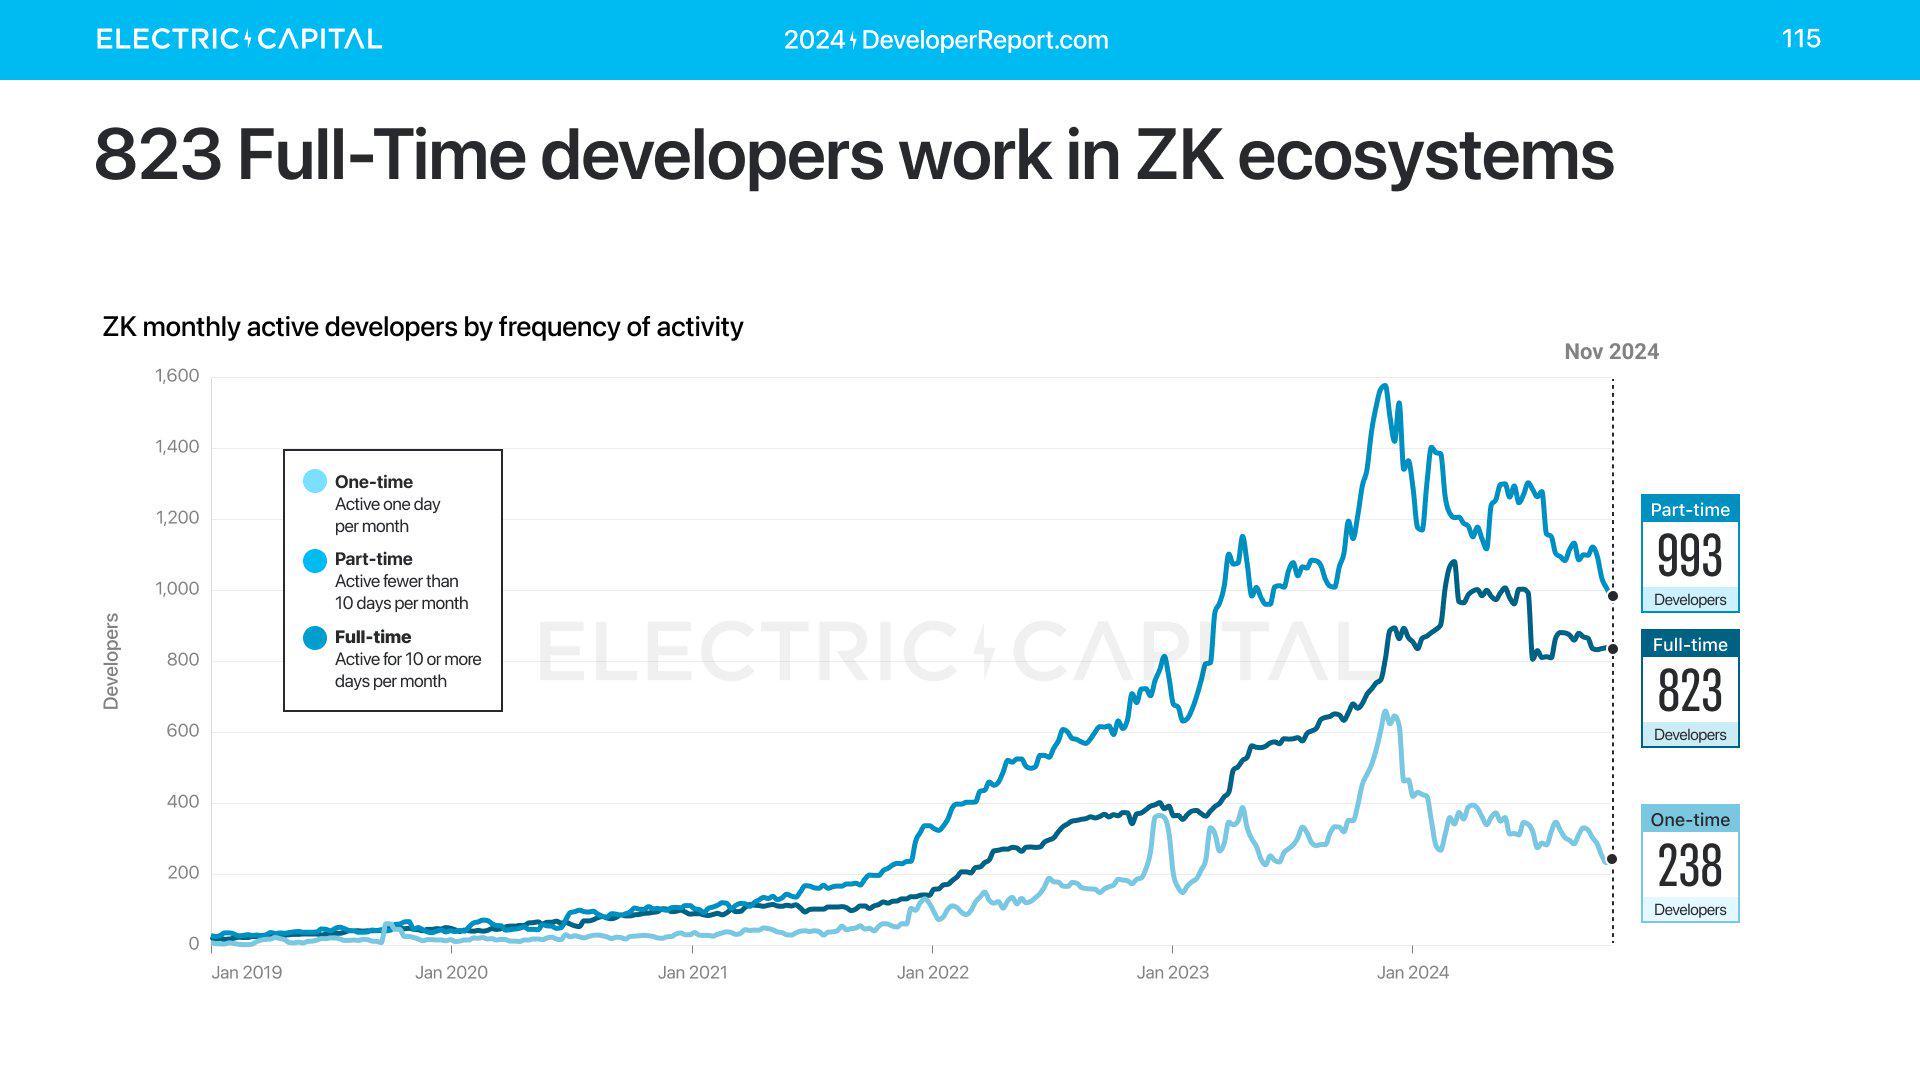
ZK is a developer-centric research area. There are over 2,000 active developers working on ZK each month. 823 of the monthly active developers are full-time, spending more than 10 days per month on it.

Electric Capital's annual developer report: 39,000 new developers joined, more than half of Ethereum developers are committed to L2

Electric Capital's annual developer report: 39,000 new developers joined, more than half of Ethereum developers are committed to L2

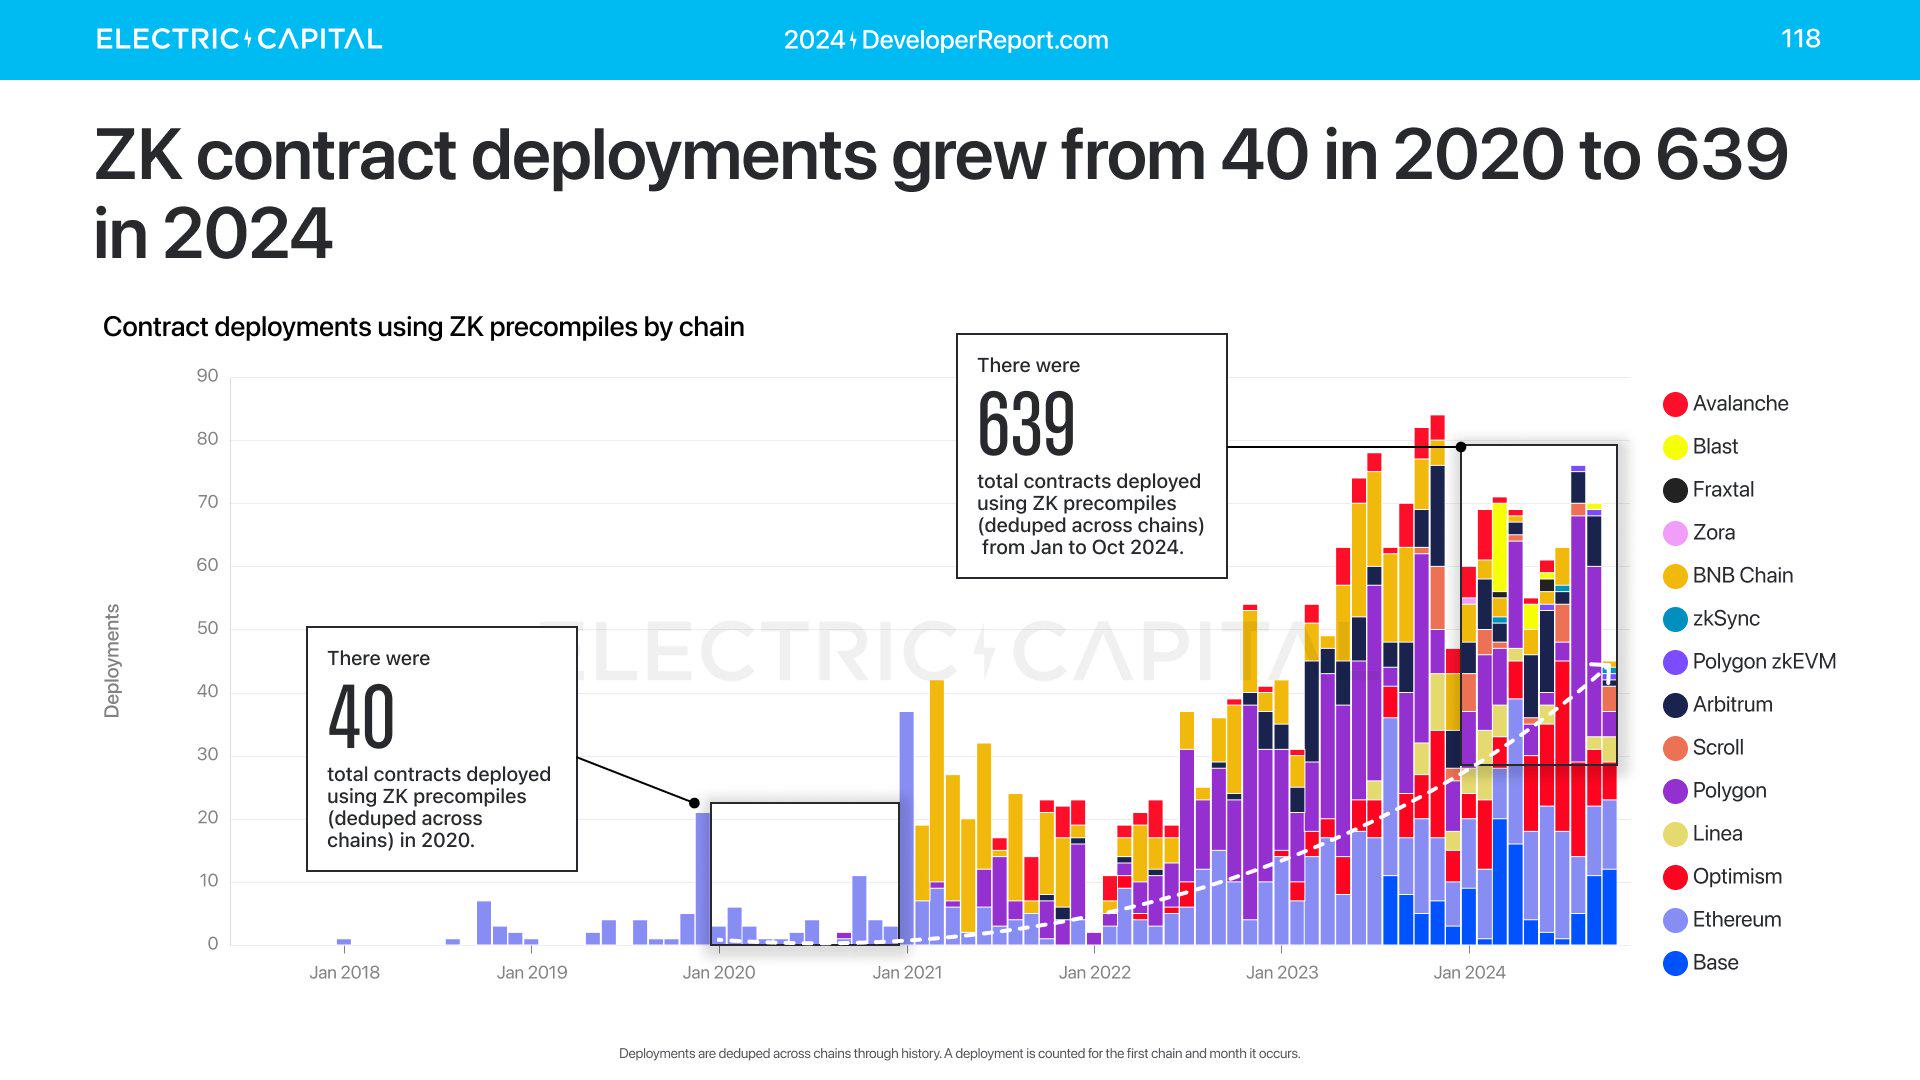
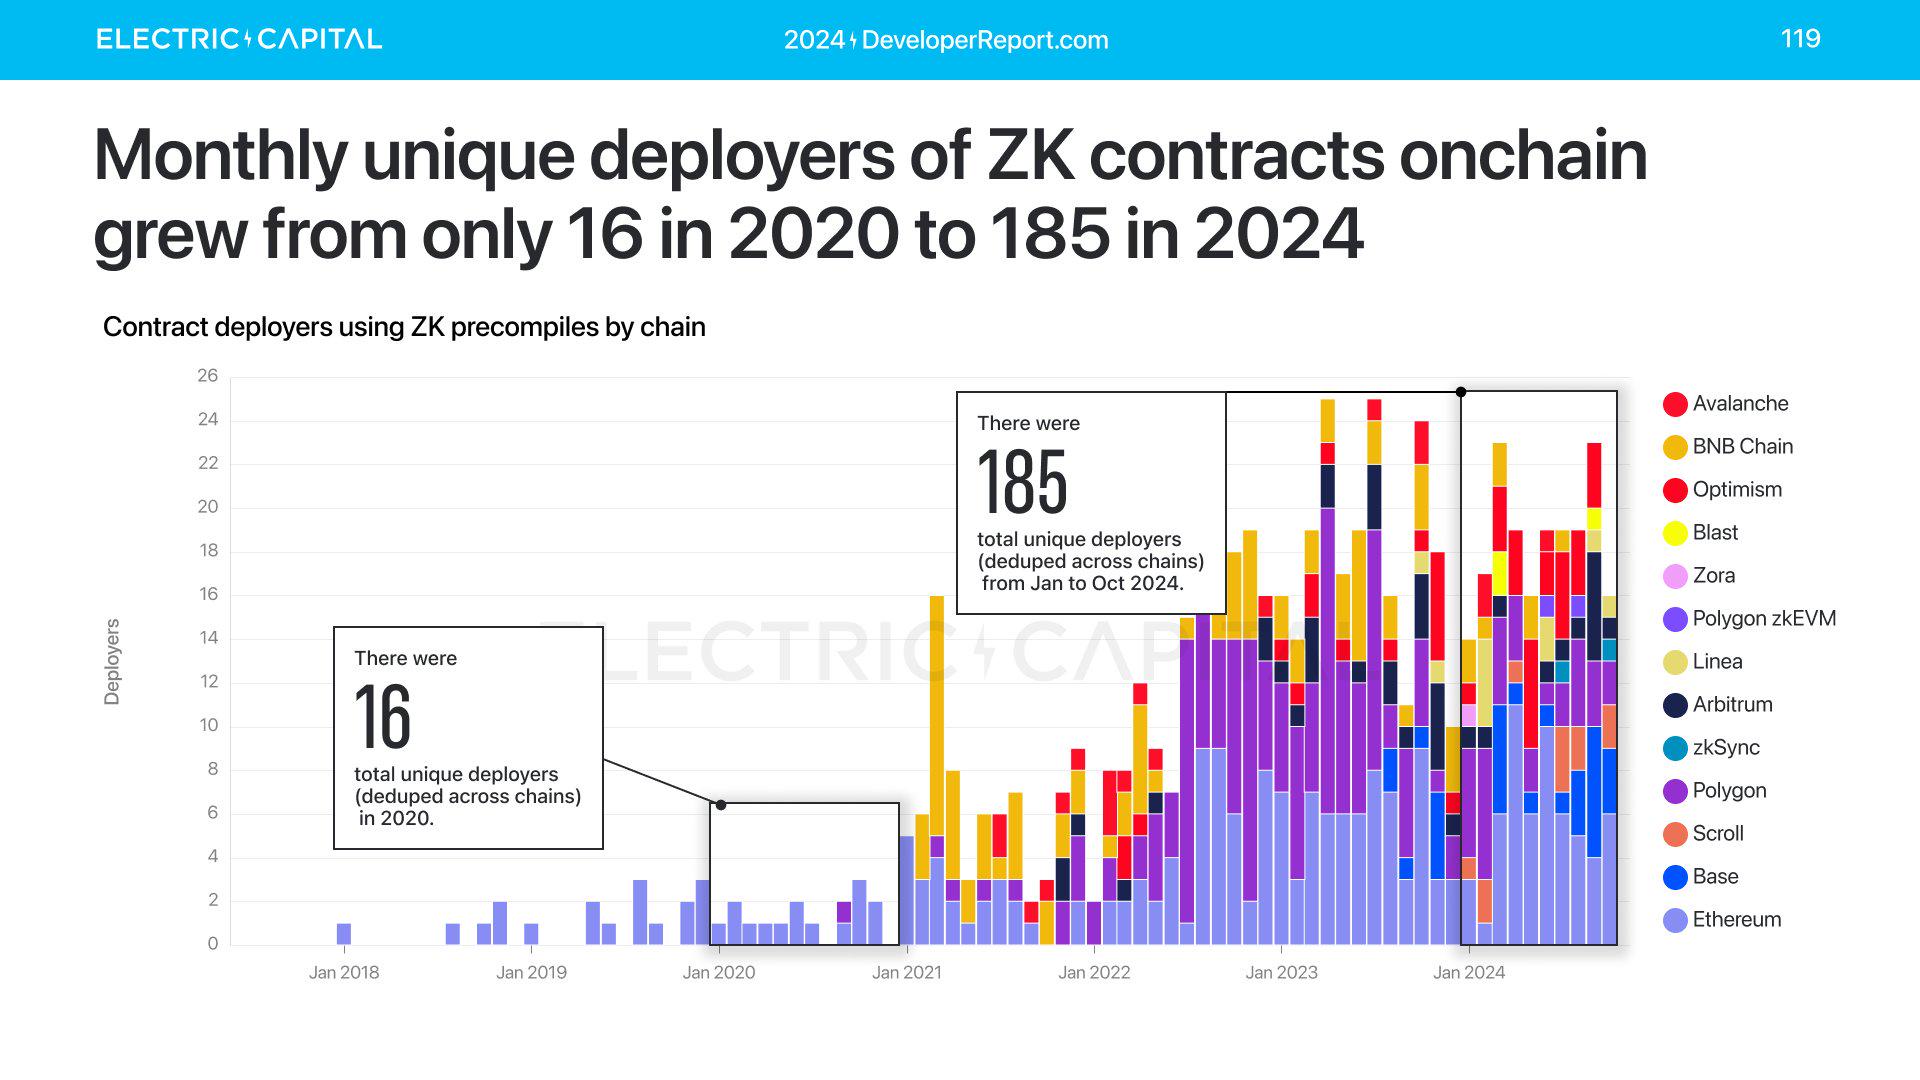
The number of ZK on-chain deployments has also increased from 40 in 2020 to 639 in 2024. The number is not large, but the growth is obvious. The number of deployers is also increasing.

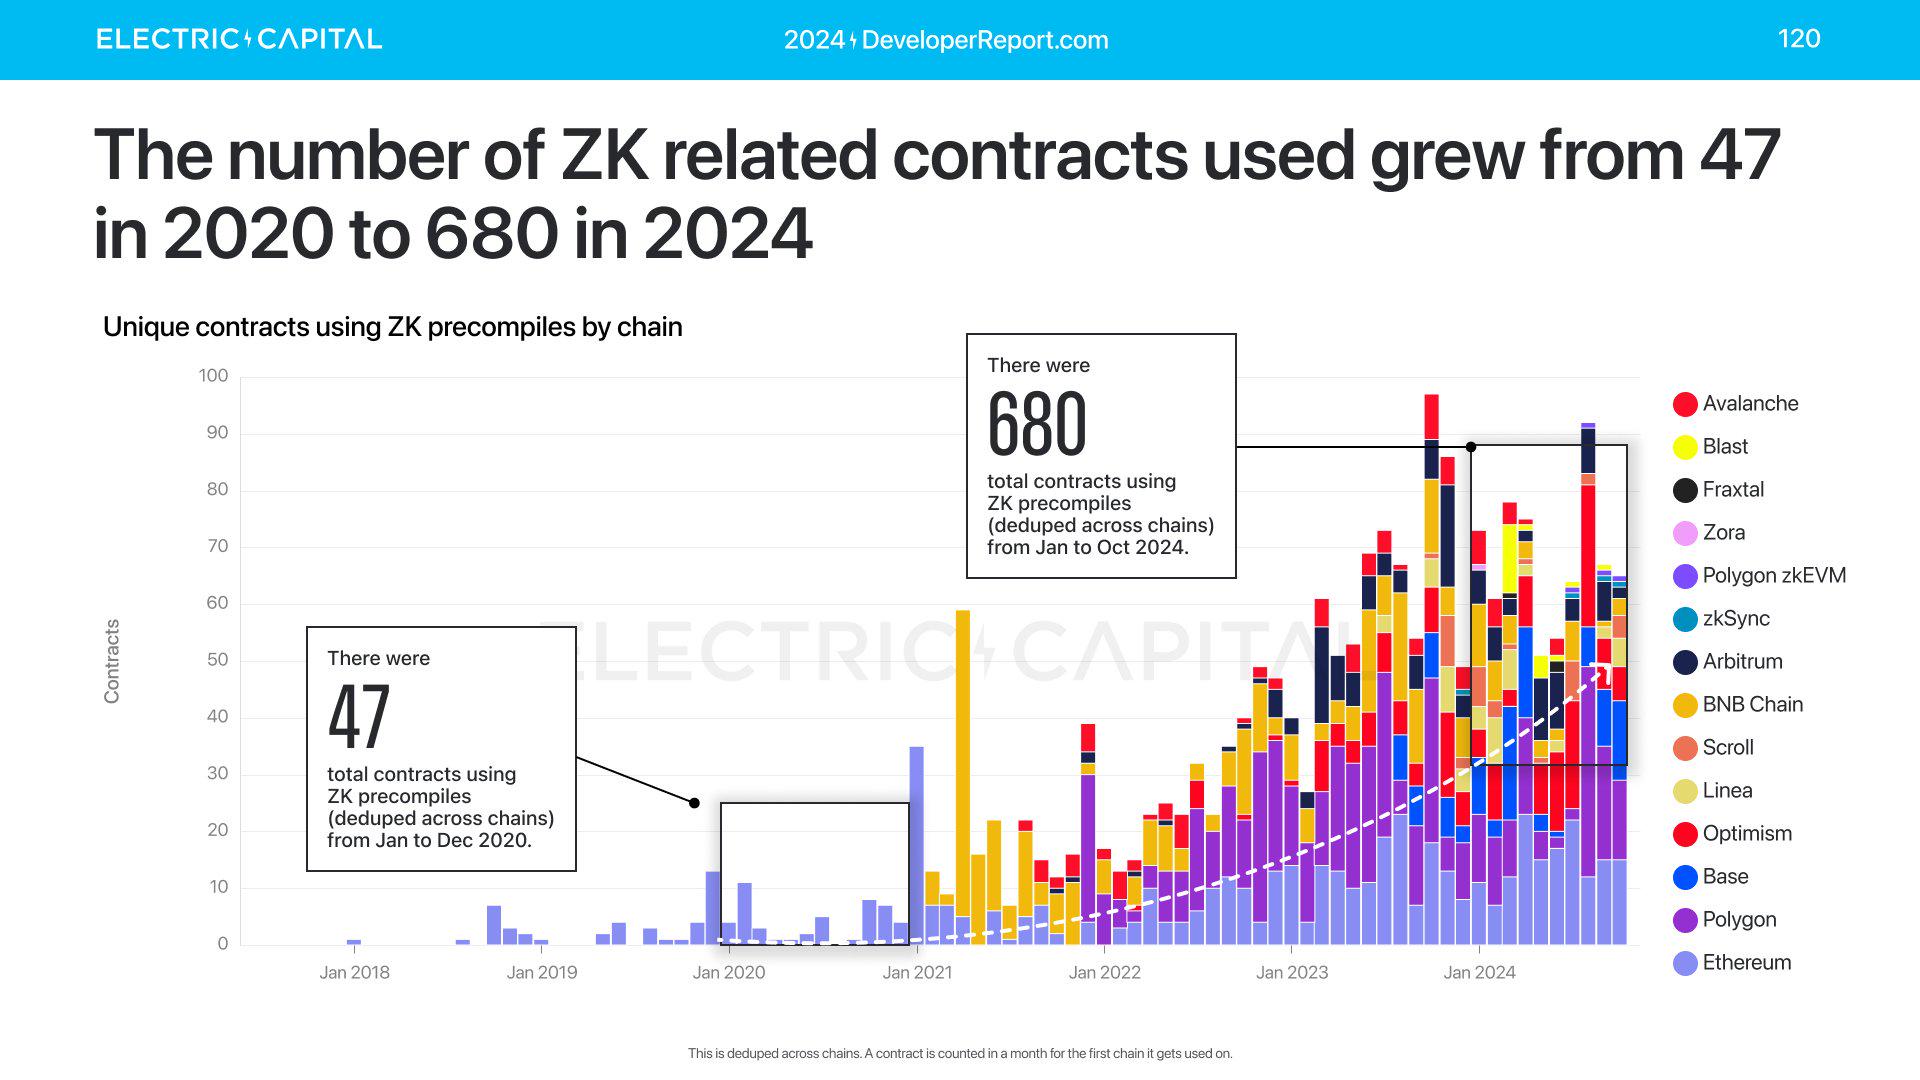
ZK usage is also increasing, with the number of contracts precompiled using ZK growing from 47 in 2020 to 680 this year.

Electric Capital's annual developer report: 39,000 new developers joined, more than half of Ethereum developers are committed to L2

Electric Capital's annual developer report: 39,000 new developers joined, more than half of Ethereum developers are committed to L2

Electric Capital's annual developer report: 39,000 new developers joined, more than half of Ethereum developers are committed to L2

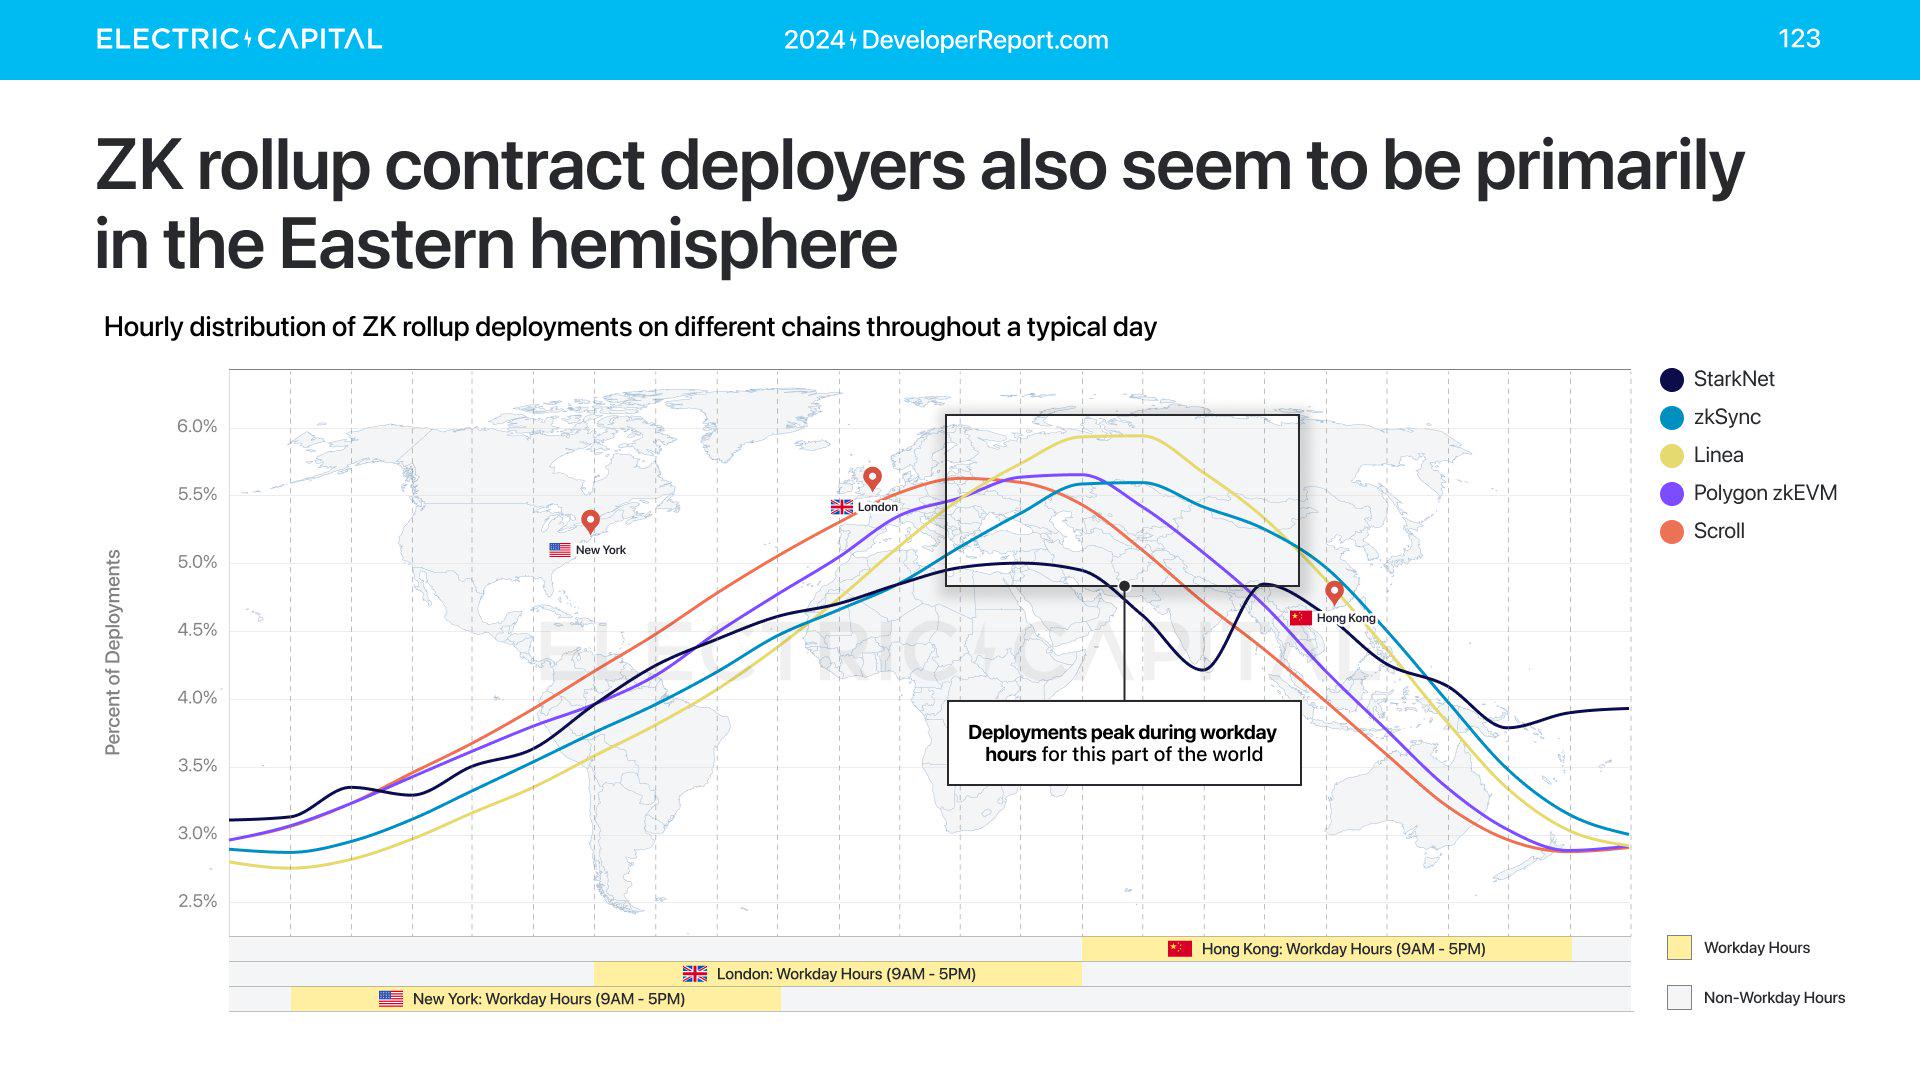
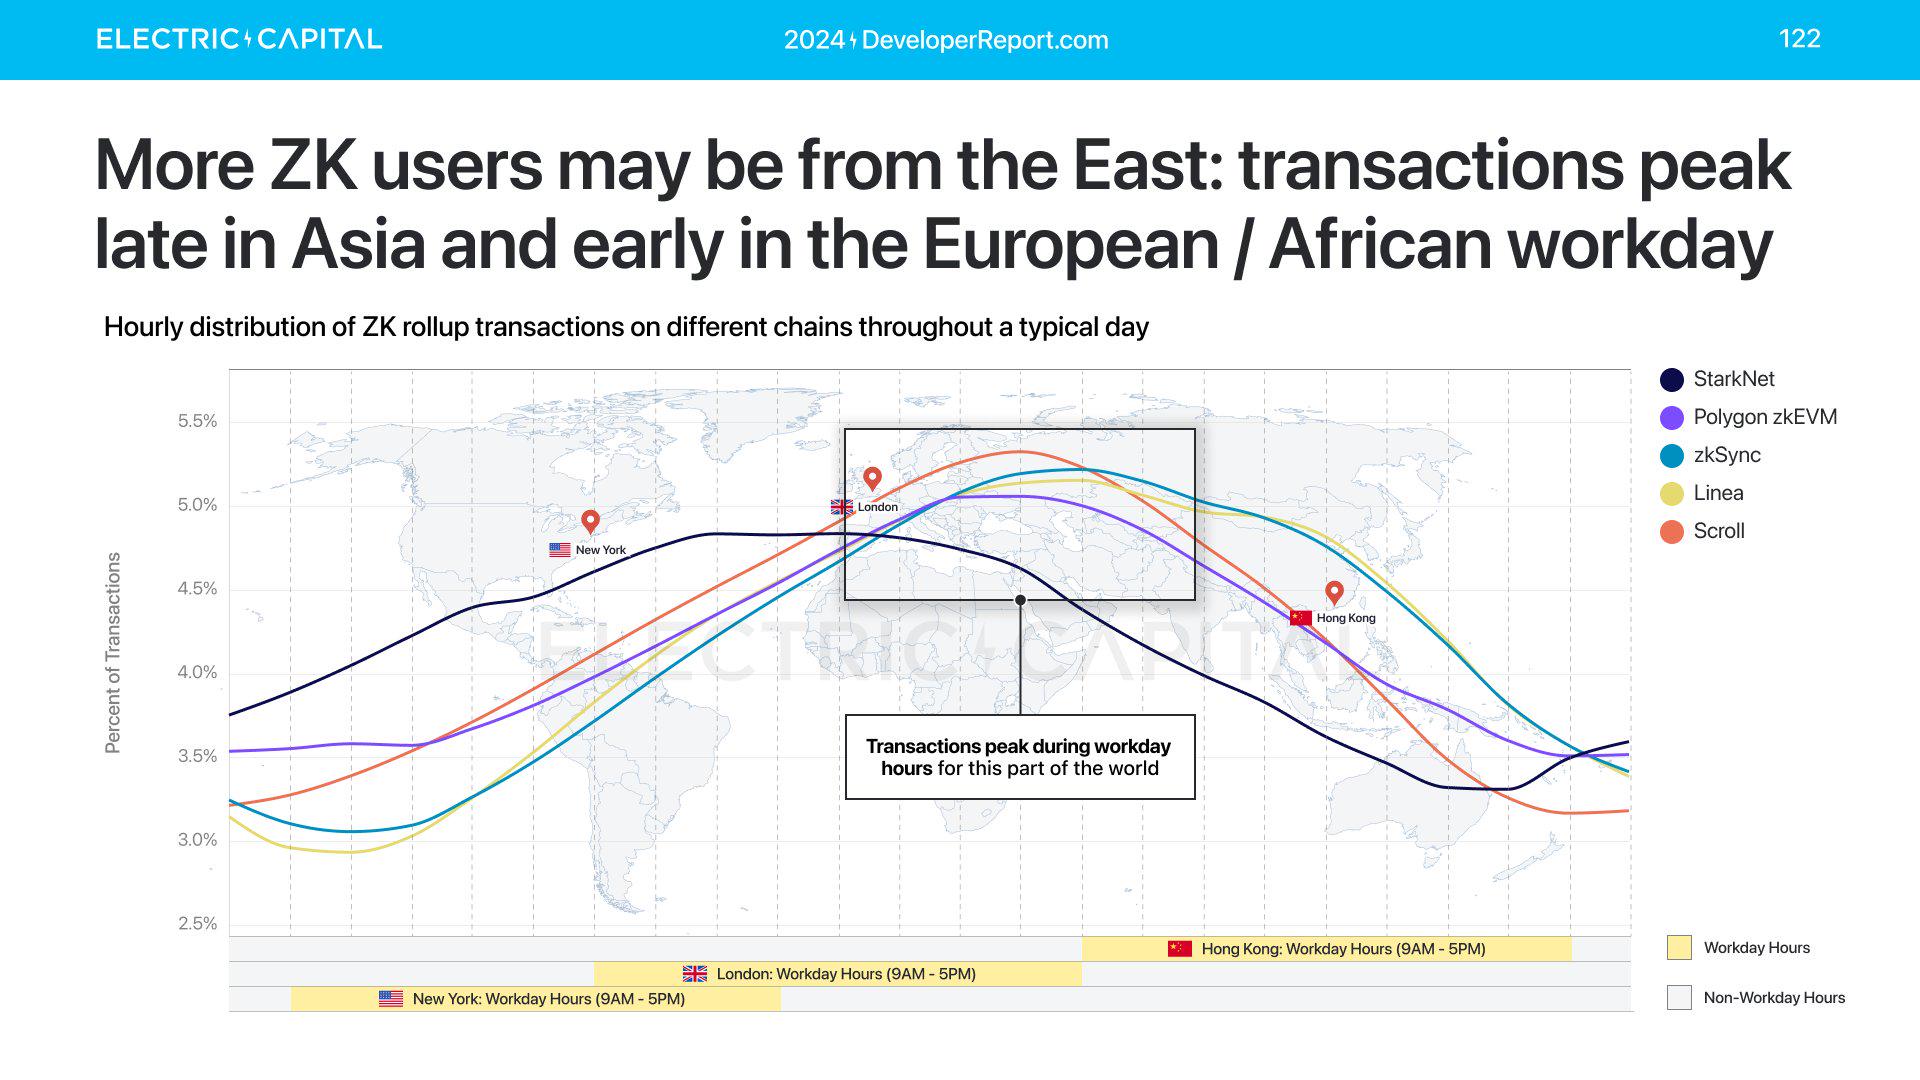
ZK rollup contract deployers are active during Eastern Hemisphere business hours. The same is true for ZK users. ZK users and deployers appear to be concentrated in Eastern Europe, Africa, and Asia in the Eastern Hemisphere.
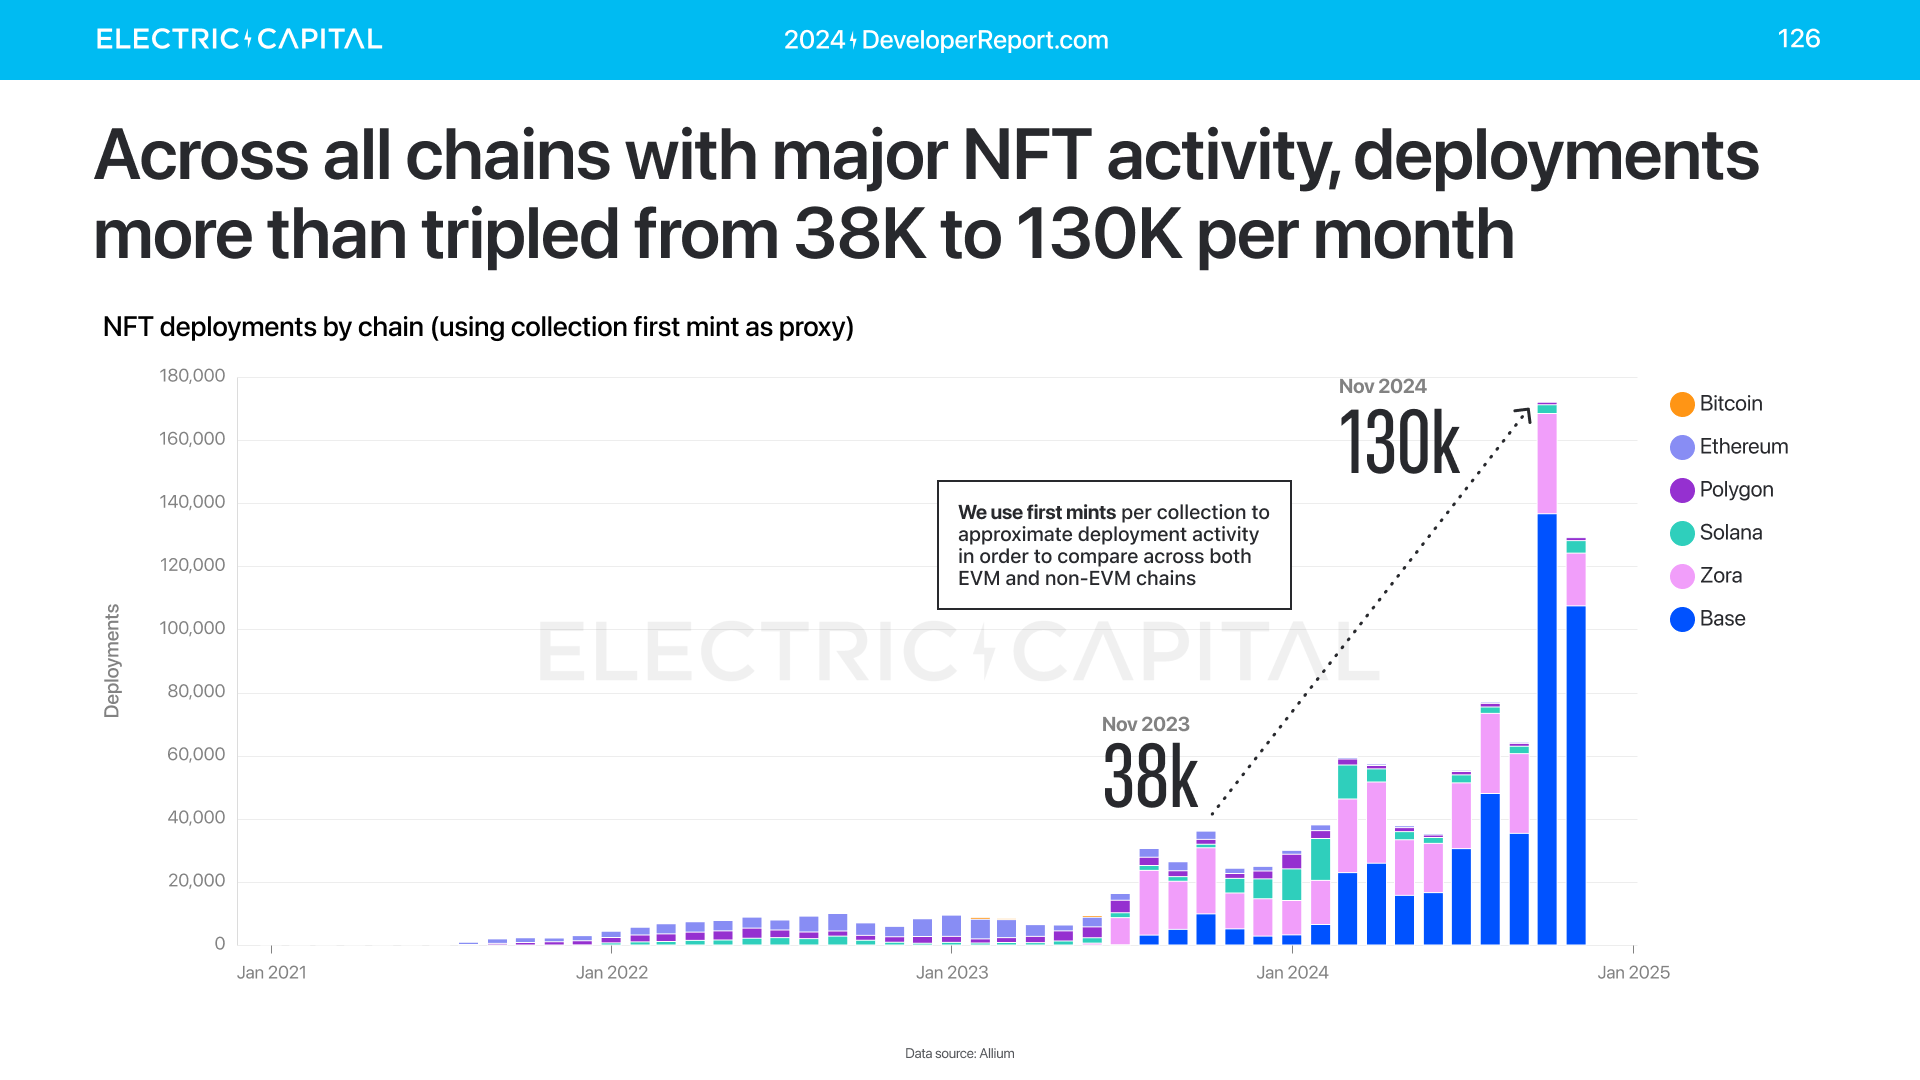
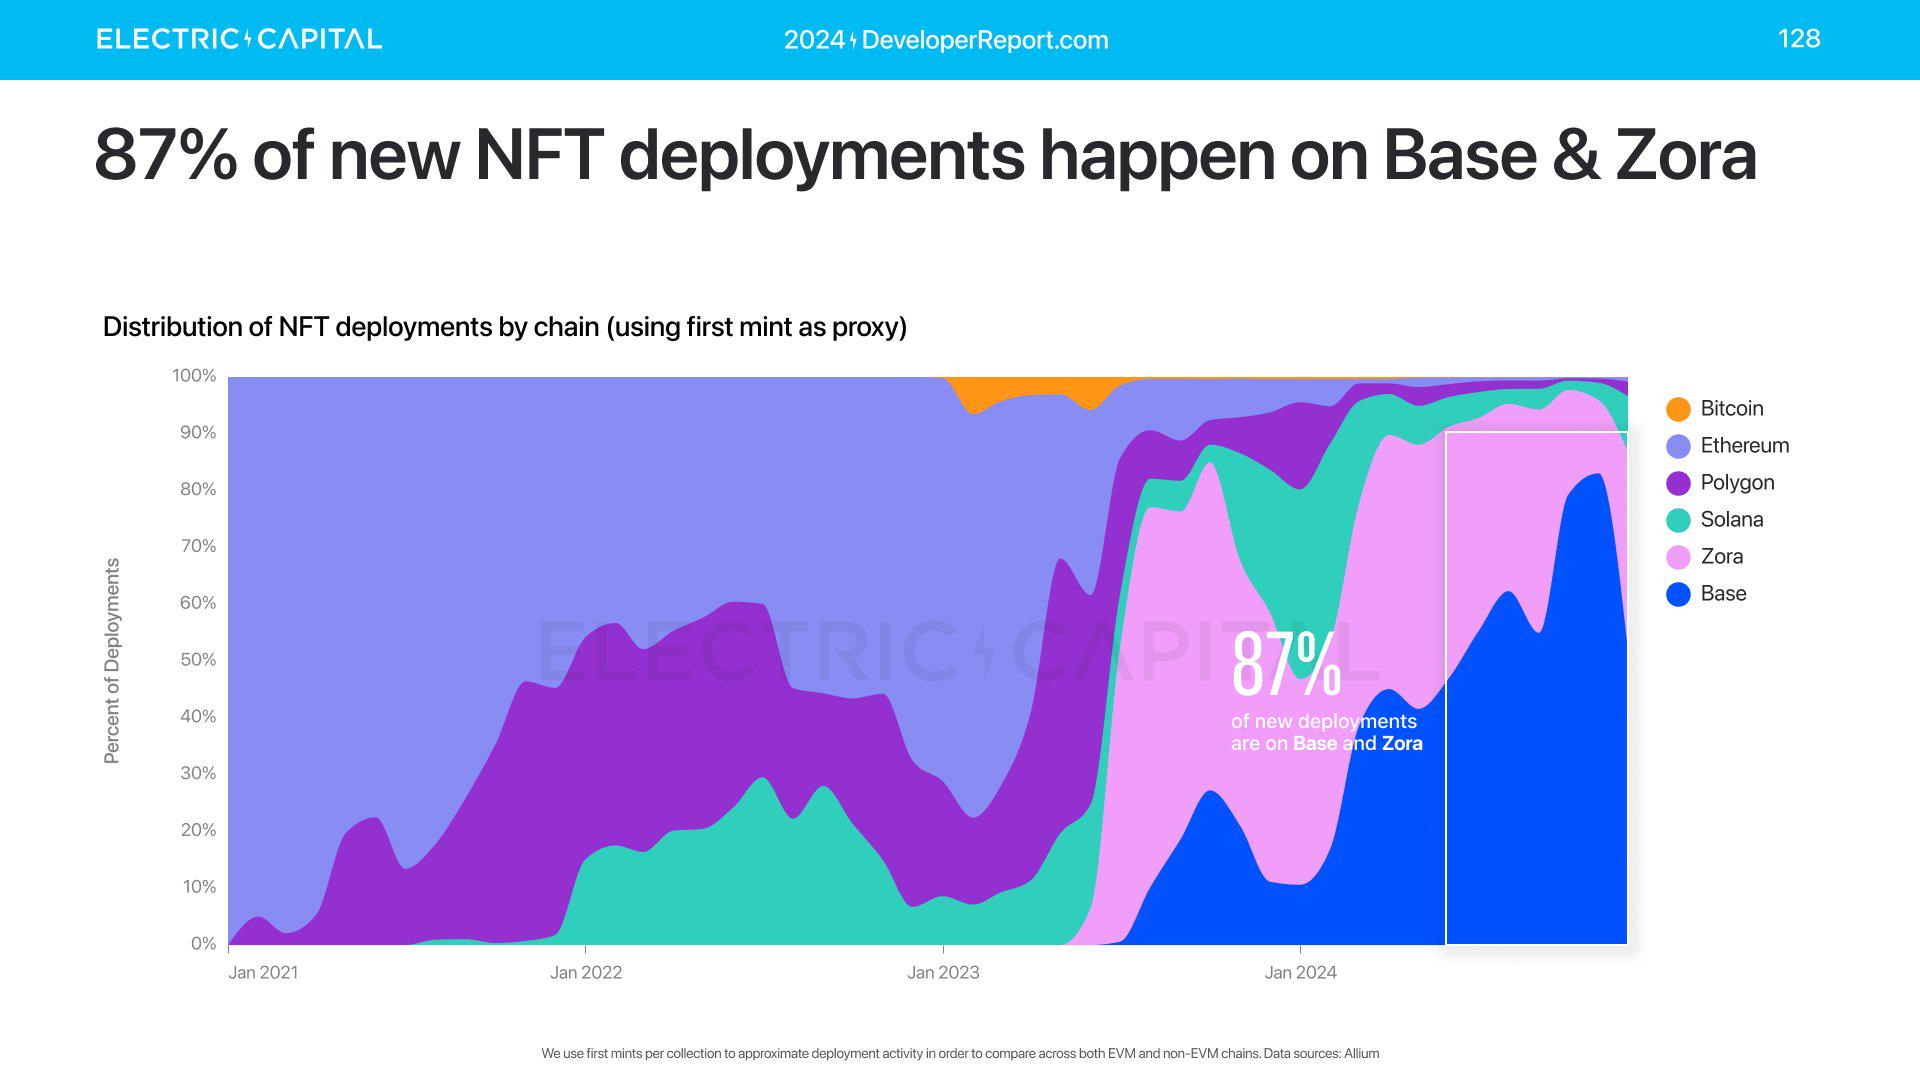
Electric Capital's annual developer report: 39,000 new developers joined, more than half of Ethereum developers are committed to L2

Electric Capital's annual developer report: 39,000 new developers joined, more than half of Ethereum developers are committed to L2

NFT

Across all chains with NFT activity (Bitcoin, Ethereum, Polygon, Solana, Zora, Base), NFT deployers grew more than 3x year-over-year. NFT deployers hit an all-time high. 87% of new deployers occurred on Base and Zora.

Electric Capital's annual developer report: 39,000 new developers joined, more than half of Ethereum developers are committed to L2

Electric Capital's annual developer report: 39,000 new developers joined, more than half of Ethereum developers are committed to L2

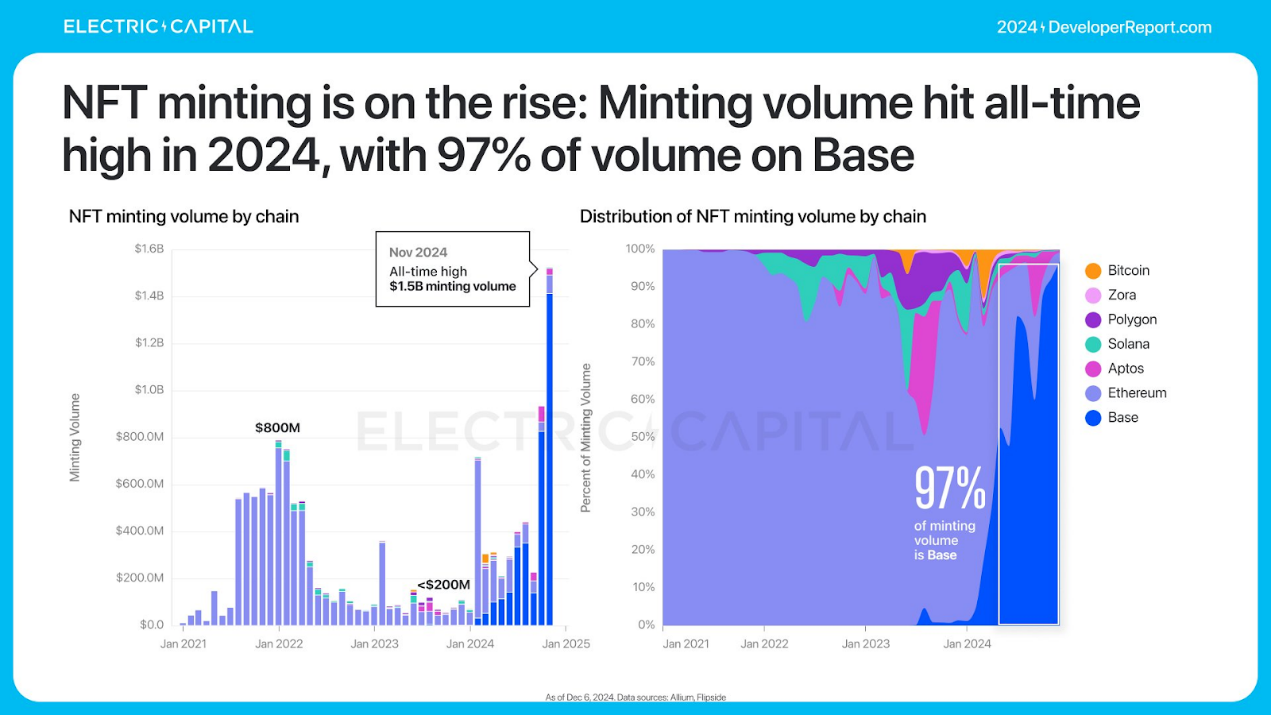
NFT activity has clearly shifted towards minting activity.

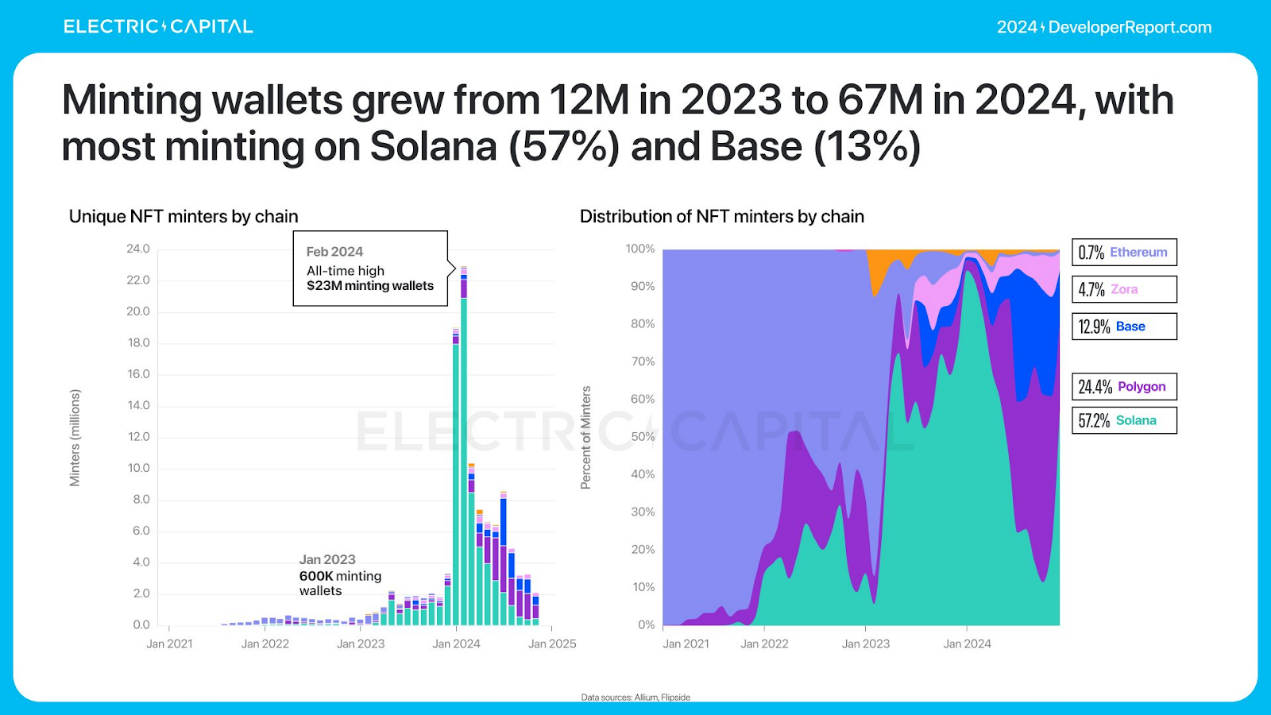
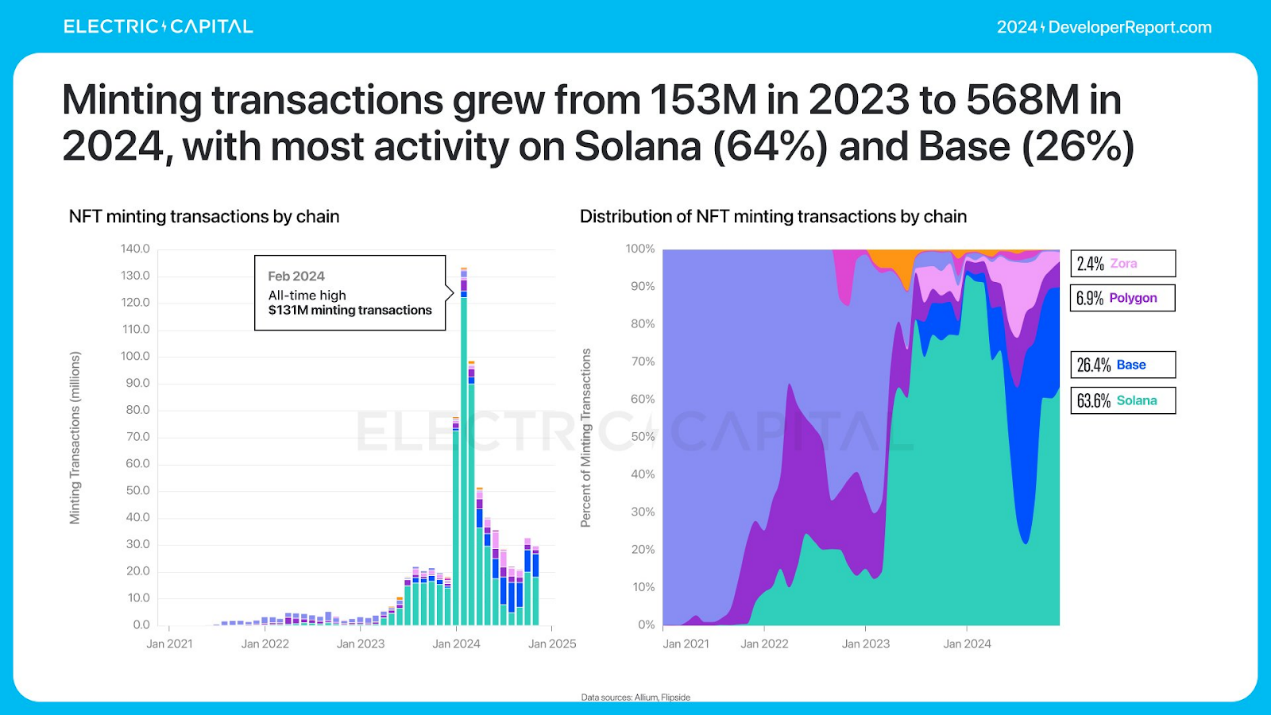
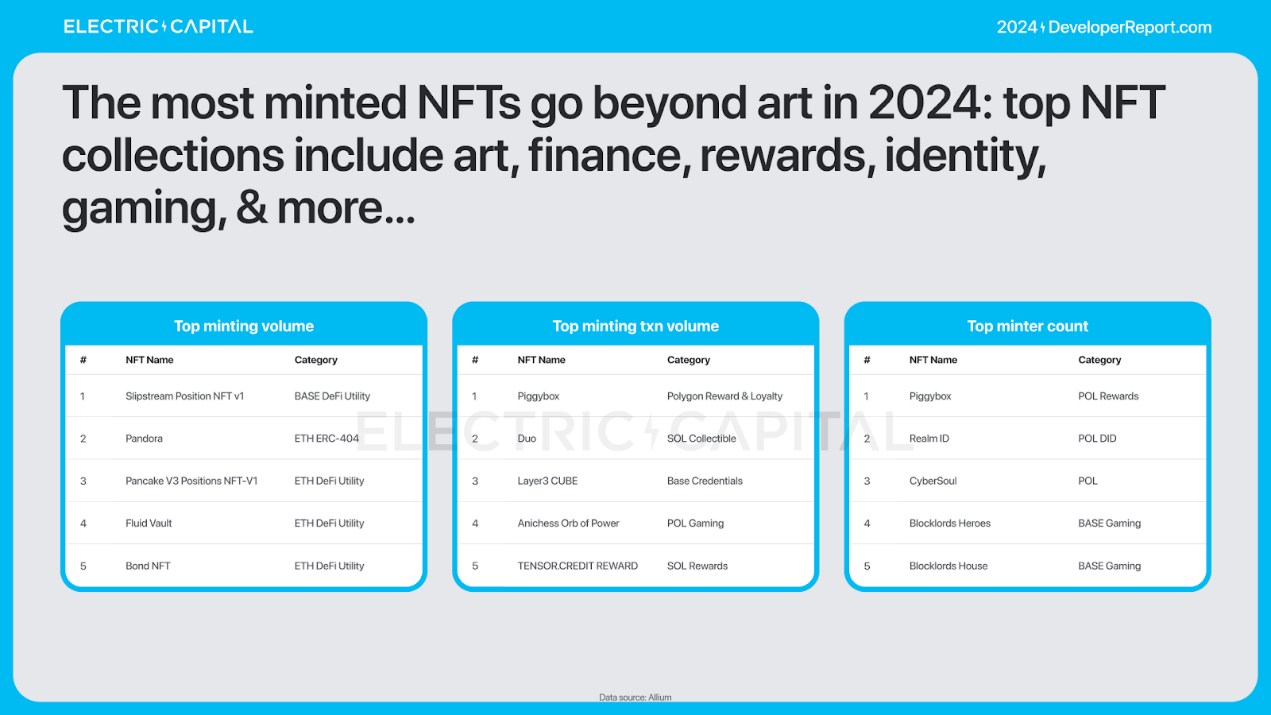
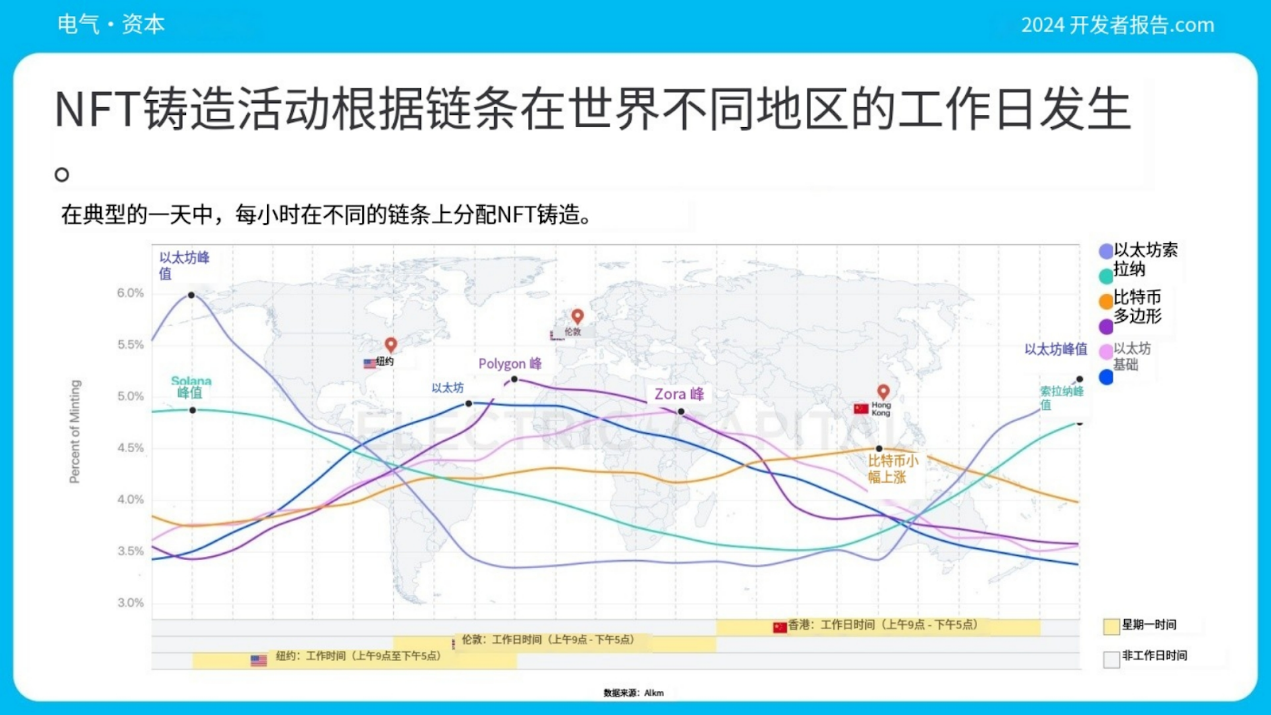
NFT minting hit a new high in 2024, with 97% of it happening on Base. Solana has 57% of minting wallets and accounts for 64% of minting transactions. As NFTs far exceed the scope of art in 2024, minting activity has increased.

Electric Capital's annual developer report: 39,000 new developers joined, more than half of Ethereum developers are committed to L2

Electric Capital's annual developer report: 39,000 new developers joined, more than half of Ethereum developers are committed to L2

Electric Capital's annual developer report: 39,000 new developers joined, more than half of Ethereum developers are committed to L2

Electric Capital's annual developer report: 39,000 new developers joined, more than half of Ethereum developers are committed to L2

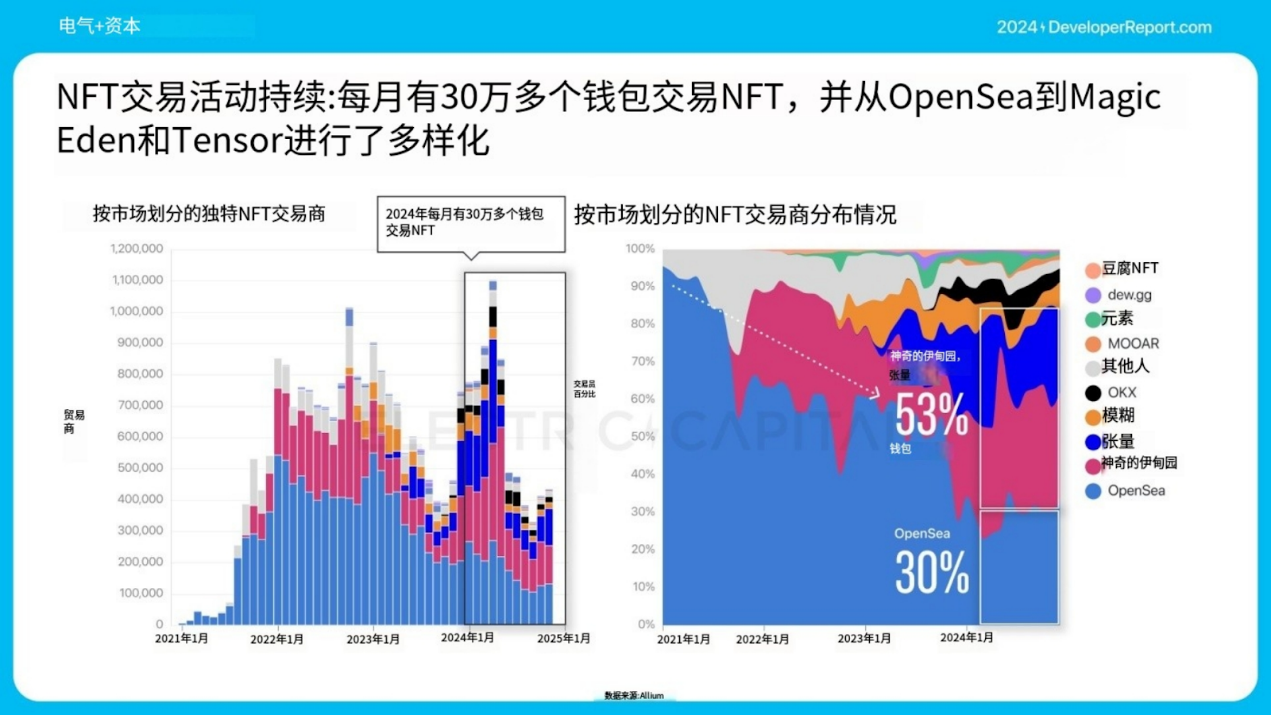
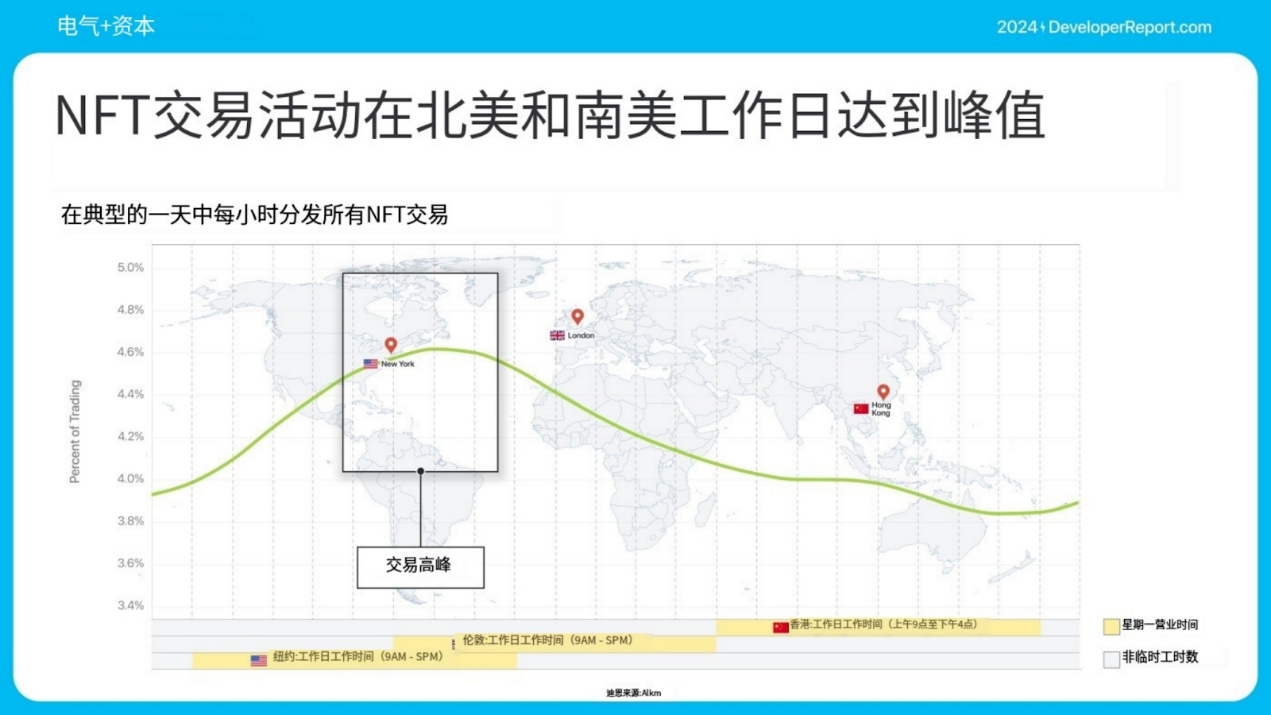
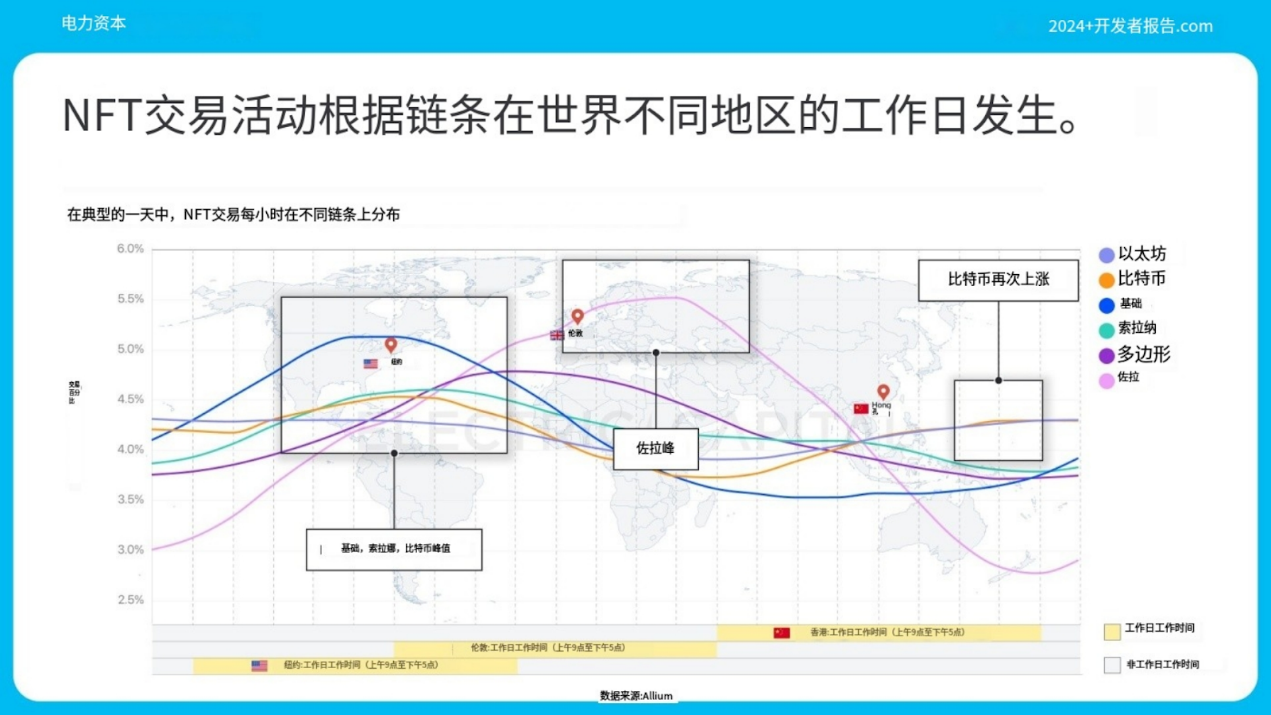
NFT trading remains an important area and has diversified from OpenSea to Magic Eden and Tensor.

Electric Capital's annual developer report: 39,000 new developers joined, more than half of Ethereum developers are committed to L2

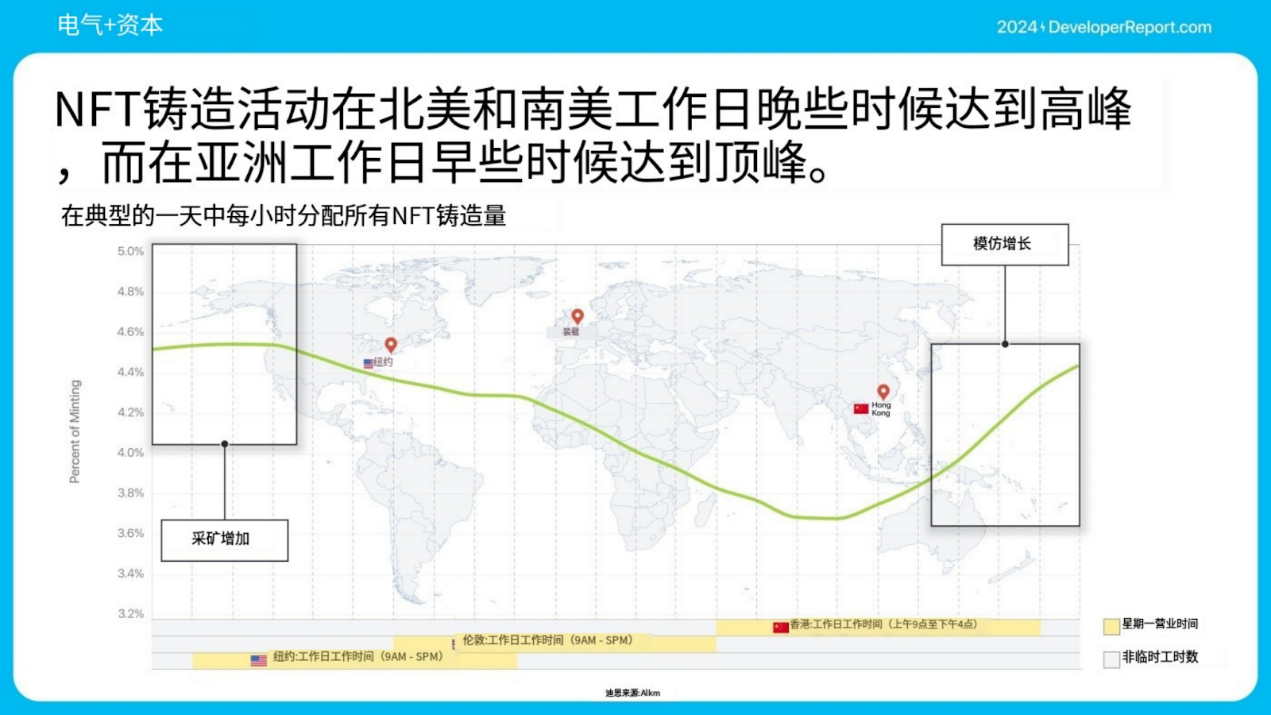
NFT minting and trading volumes peaked in different regions, indicating different user bases.
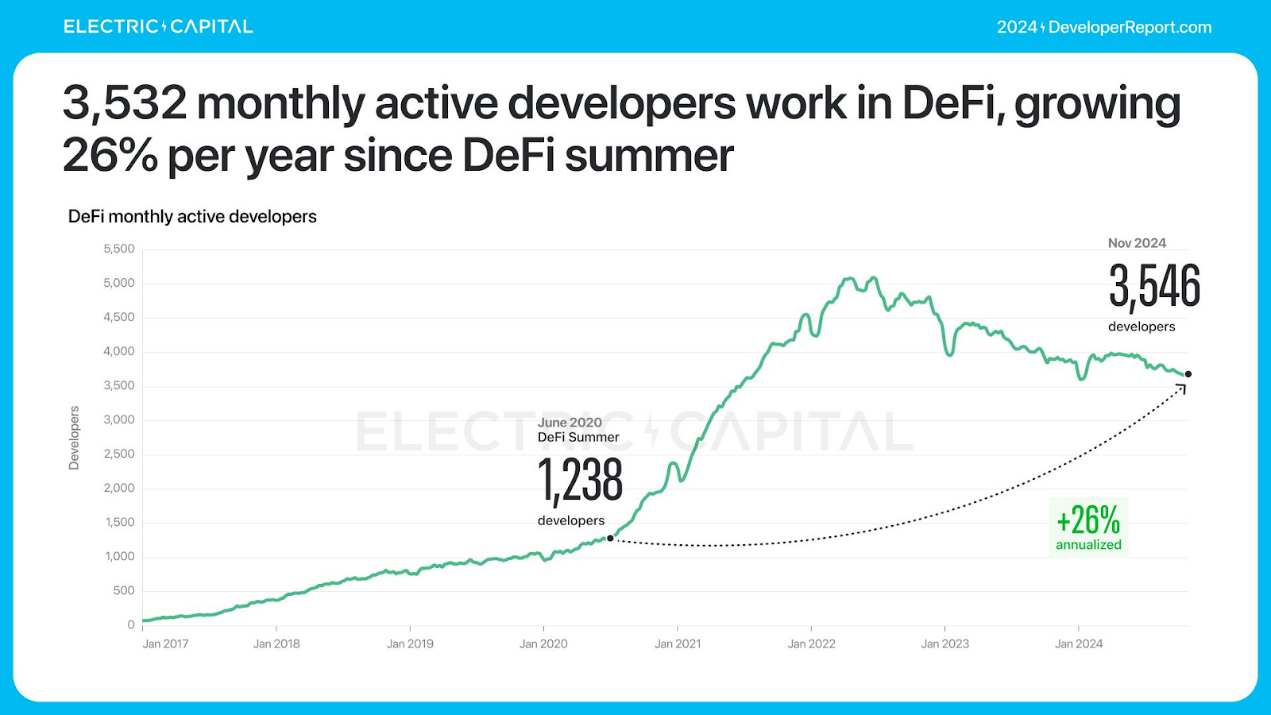
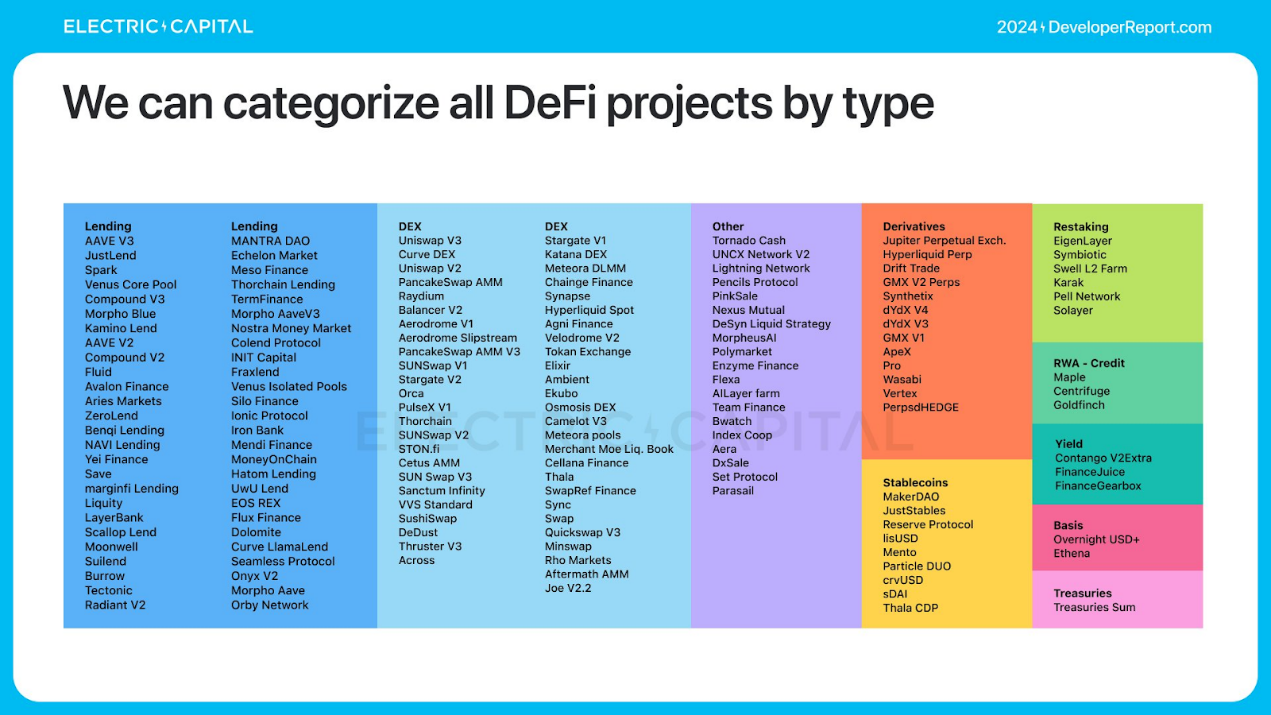
Electric Capital's annual developer report: 39,000 new developers joined, more than half of Ethereum developers are committed to L2

Electric Capital's annual developer report: 39,000 new developers joined, more than half of Ethereum developers are committed to L2

Electric Capital's annual developer report: 39,000 new developers joined, more than half of Ethereum developers are committed to L2

Electric Capital's annual developer report: 39,000 new developers joined, more than half of Ethereum developers are committed to L2

DeFi

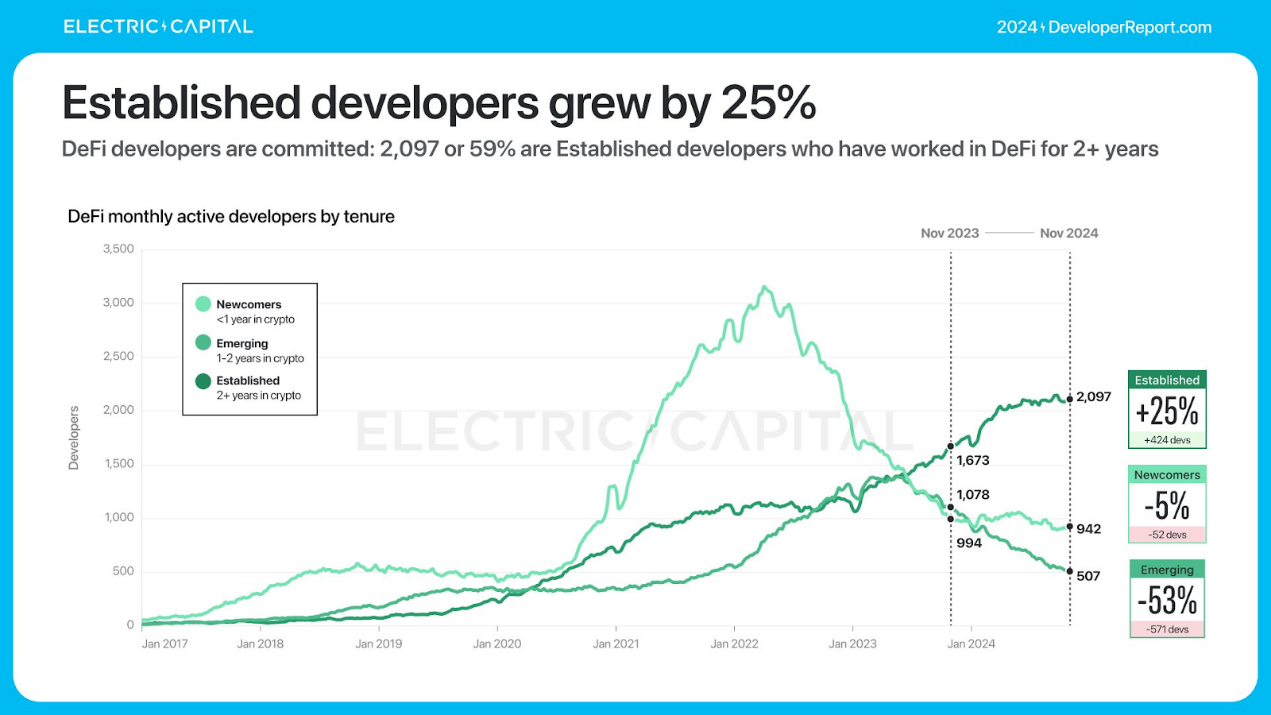
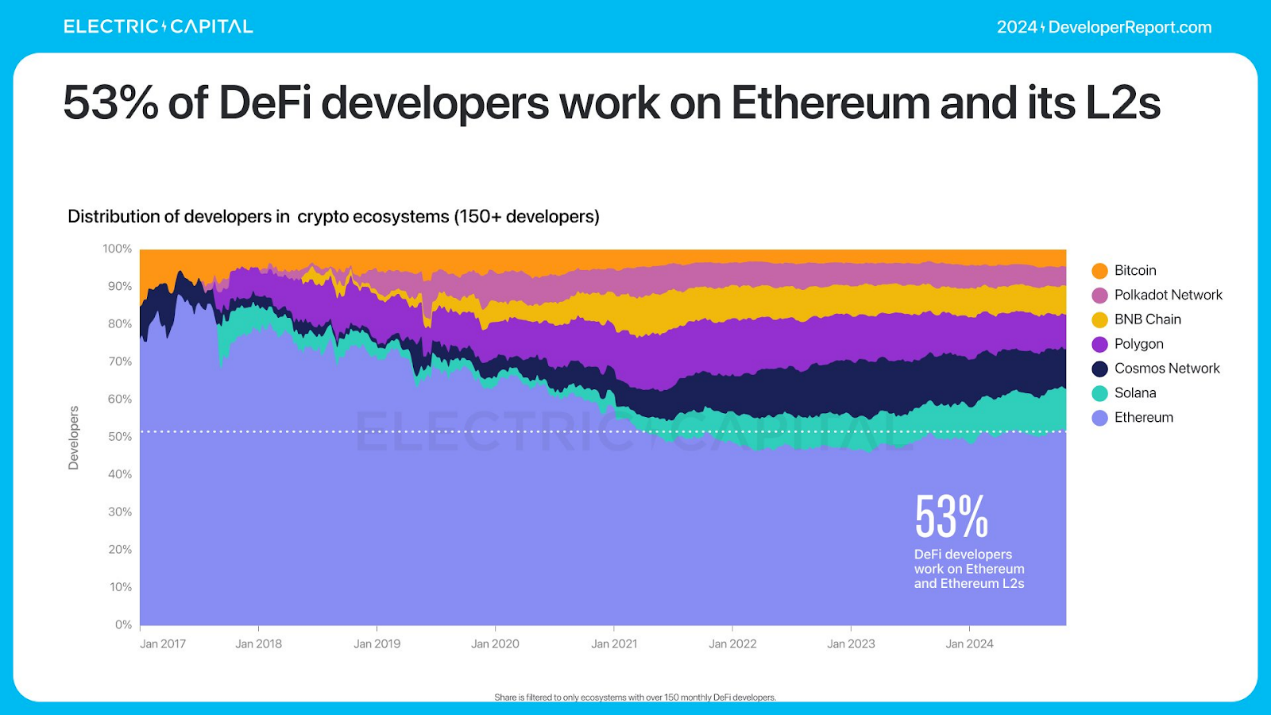
There are 3,532 active developers developing on DeFi every month. DeFi developers are experienced, and 2,097 (59%) have been working on DeFi for more than 2 years. 53% of DeFi developers work on Ethereum and its L2.

Electric Capital's annual developer report: 39,000 new developers joined, more than half of Ethereum developers are committed to L2

Electric Capital's annual developer report: 39,000 new developers joined, more than half of Ethereum developers are committed to L2

Electric Capital's annual developer report: 39,000 new developers joined, more than half of Ethereum developers are committed to L2

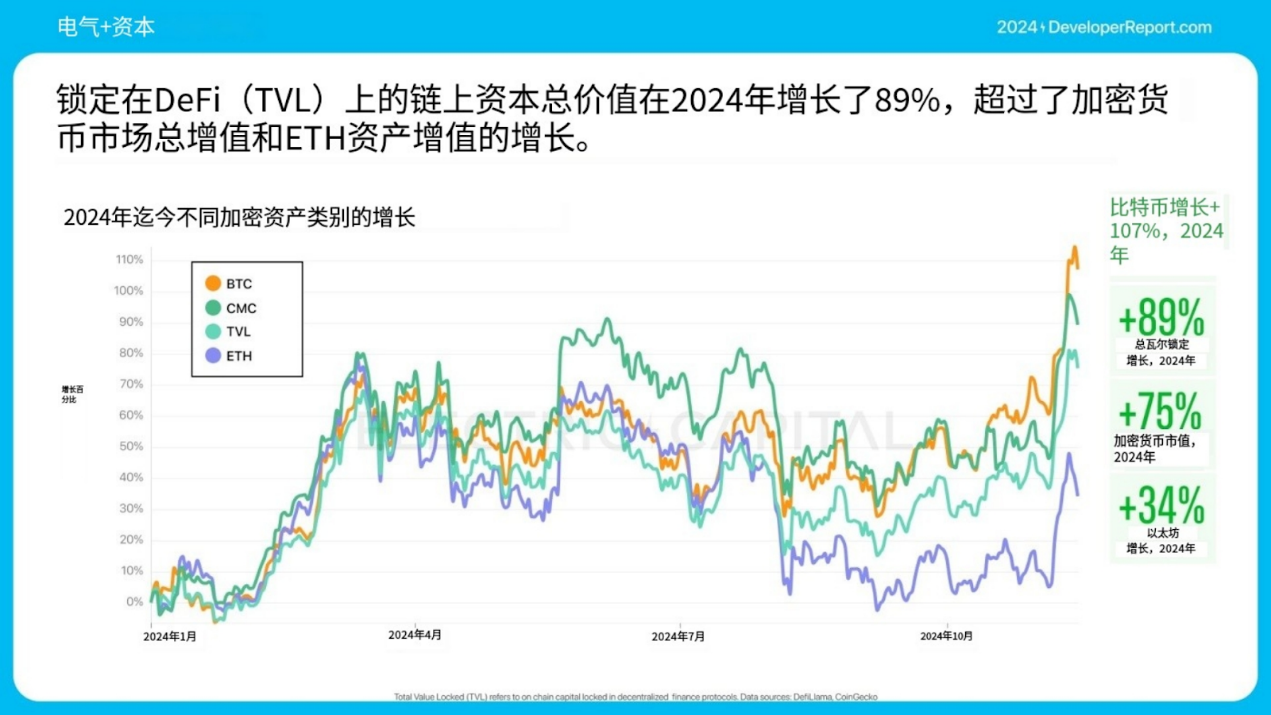
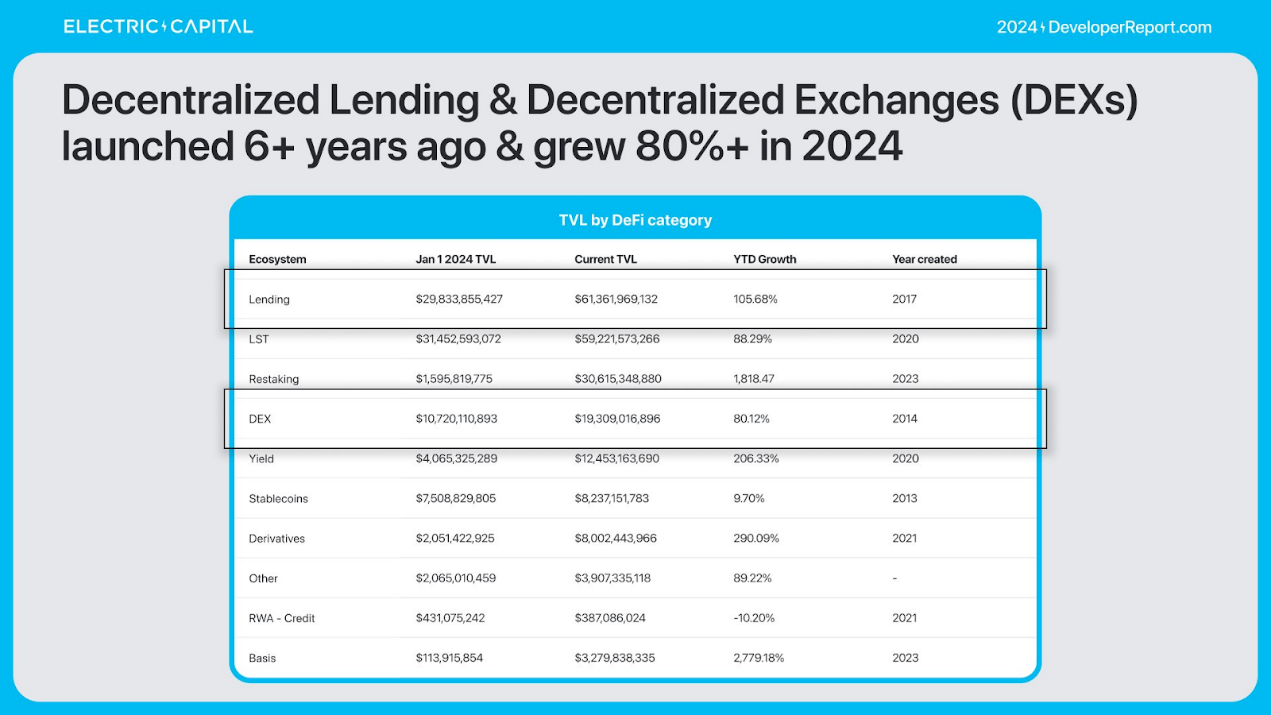
DeFi TVL grew 89% in 2024. Ethereum TVL dominated, 7x the next largest chain. Most TVL has always been on Ethereum.

Electric Capital's annual developer report: 39,000 new developers joined, more than half of Ethereum developers are committed to L2

Electric Capital's annual developer report: 39,000 new developers joined, more than half of Ethereum developers are committed to L2

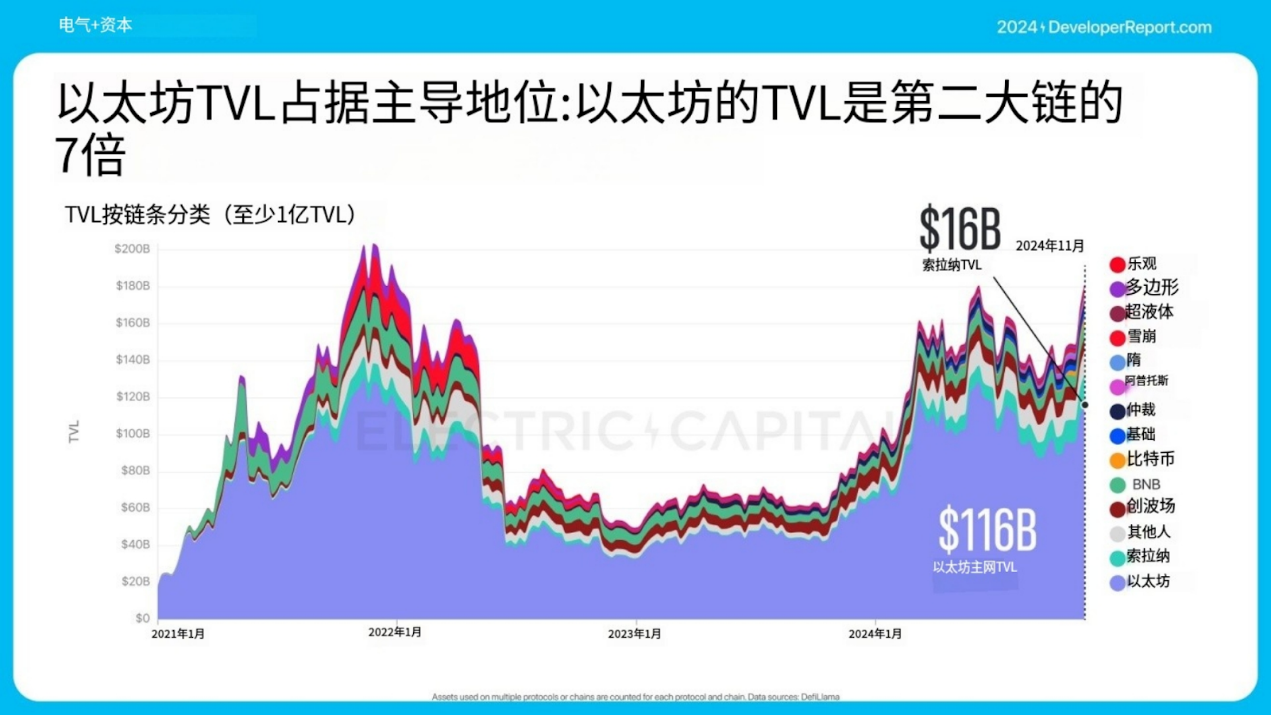
Non-Ethereum TVL increased from 3% to 36% in 3 years, with Solana seeing the largest increase in TVL share.

What drives TVL growth? DeFi developers can be categorized by type.

Electric Capital's annual developer report: 39,000 new developers joined, more than half of Ethereum developers are committed to L2

Last year, TVL of re-staking grew by $29 billion. LRT grew to over 3.5 million ETH. 46% of LRT is actively used in DeFi. Most LRT is deposited in money markets, yield, interest rate derivatives, and bridges.

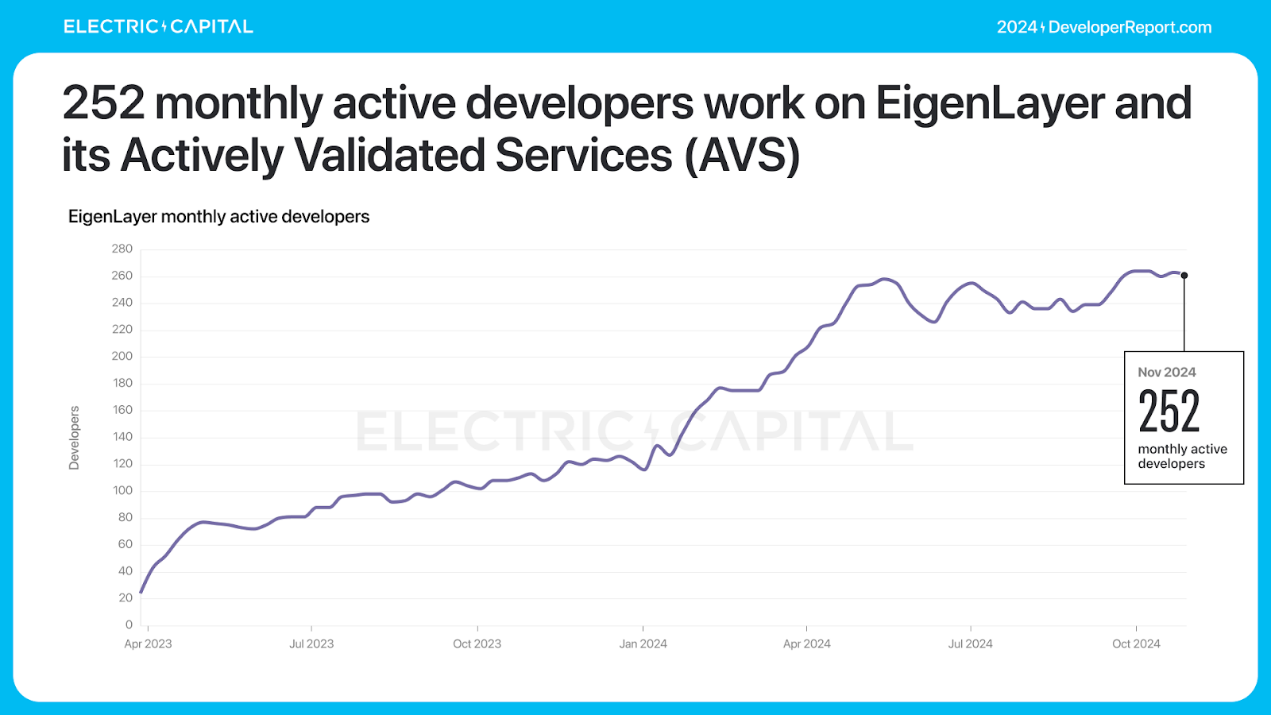
EigenLayer has contributed to the birth of the LRT industry. Eigenlayer ecosystem developers have performed as follows:

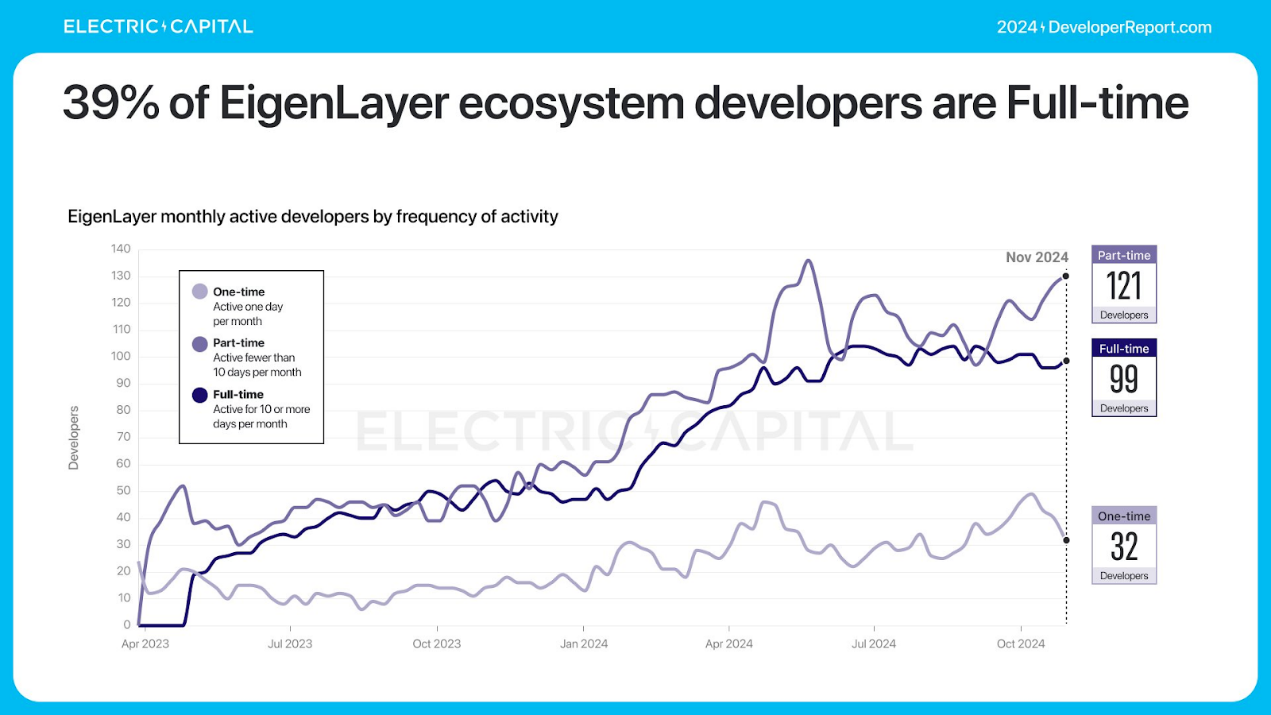
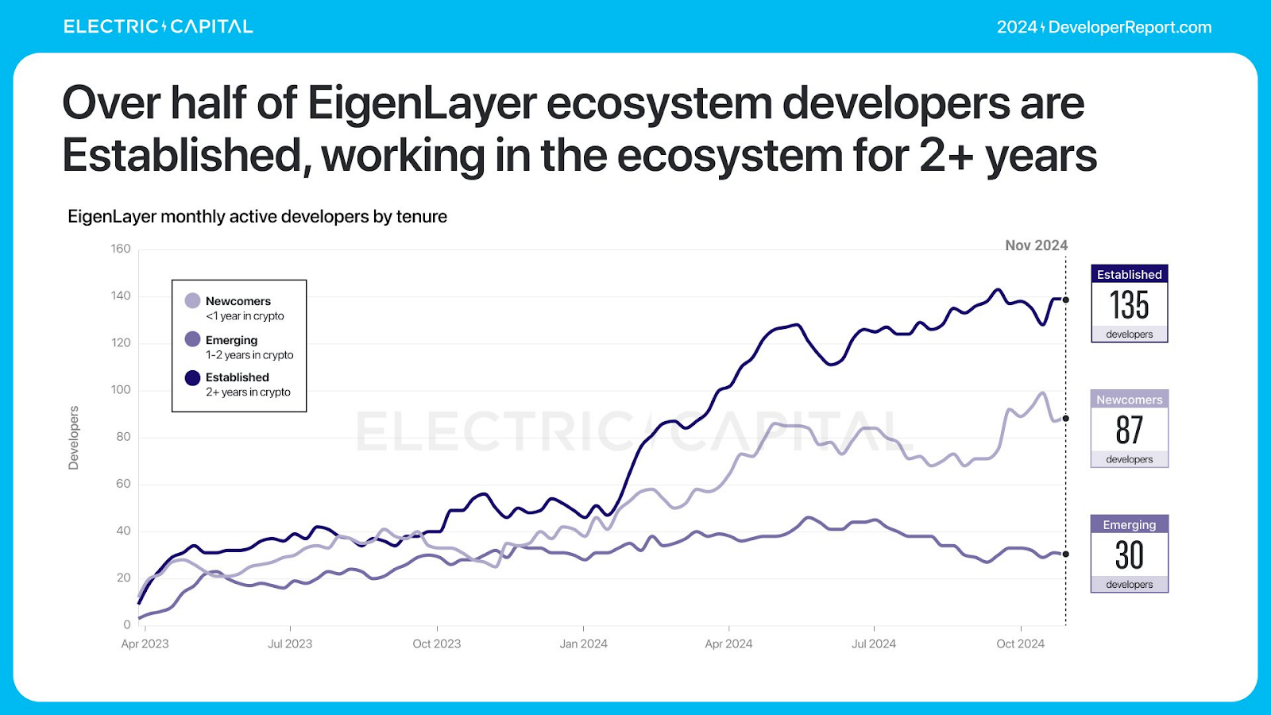
There are 252 active developers per month in the EigenLayer ecosystem. EigenLayer developers are very dedicated: 39% are full-time developers, and more than half of the developers have worked in the ecosystem for more than 2 years.

Electric Capital's annual developer report: 39,000 new developers joined, more than half of Ethereum developers are committed to L2

Electric Capital's annual developer report: 39,000 new developers joined, more than half of Ethereum developers are committed to L2

Electric Capital's annual developer report: 39,000 new developers joined, more than half of Ethereum developers are committed to L2

DEX

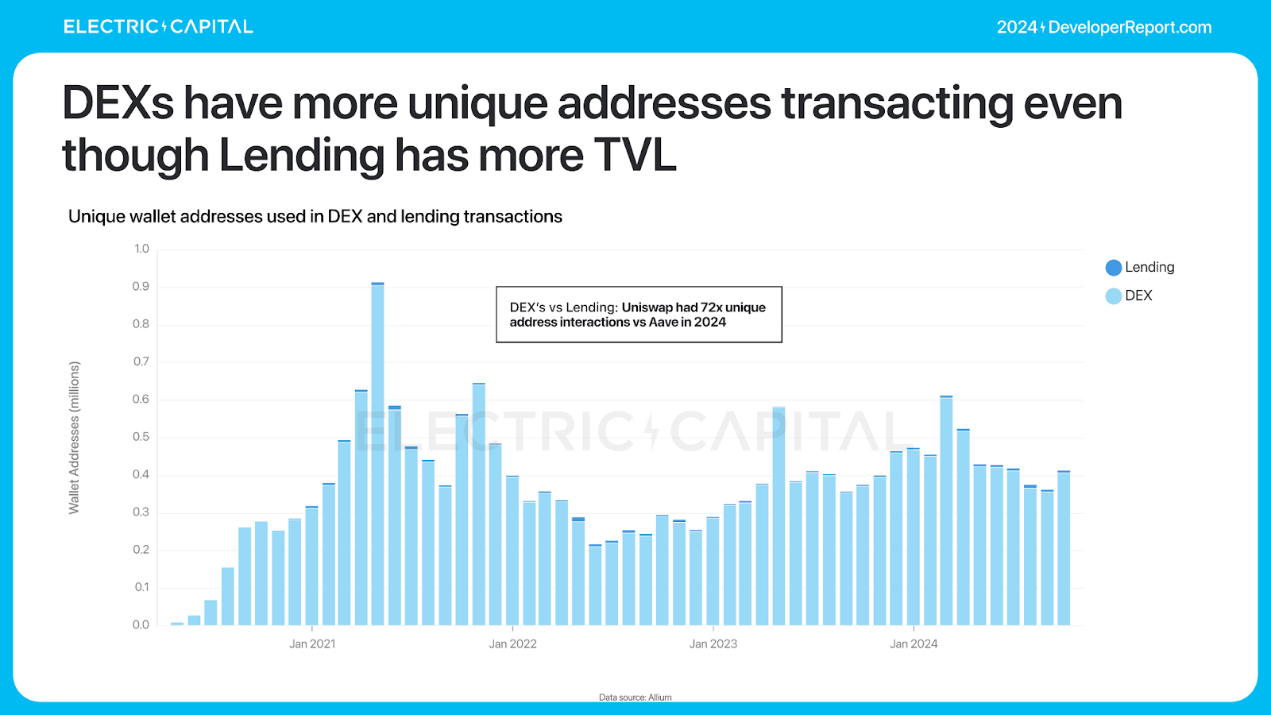
TVL is not the only metric to understand DeFi usage. Despite having 3x more TVL for lending, DEXs have more unique addresses for trading.

Electric Capital's annual developer report: 39,000 new developers joined, more than half of Ethereum developers are committed to L2

Electric Capital's annual developer report: 39,000 new developers joined, more than half of Ethereum developers are committed to L2

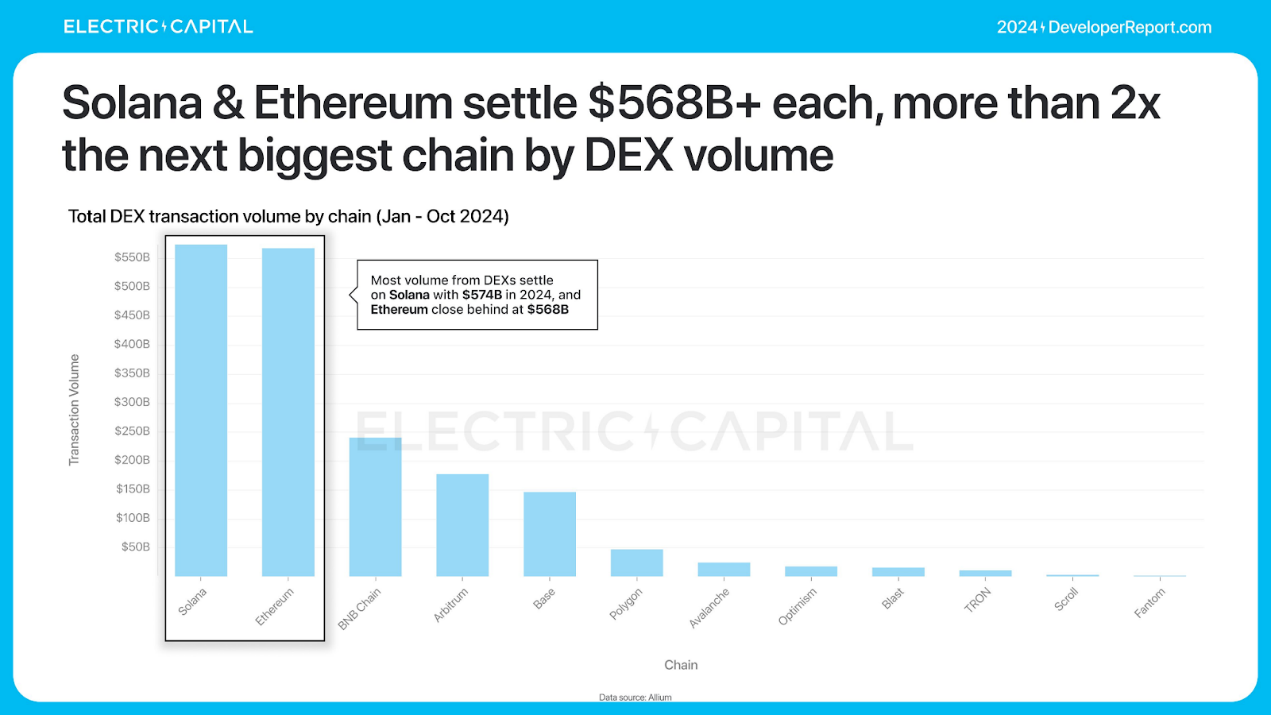
DEX volume nearly doubles to $209 billion per month in 2024. Solana and Ethereum have the largest settlement volumes, more than 2x the next largest blockchain in DEX volume.

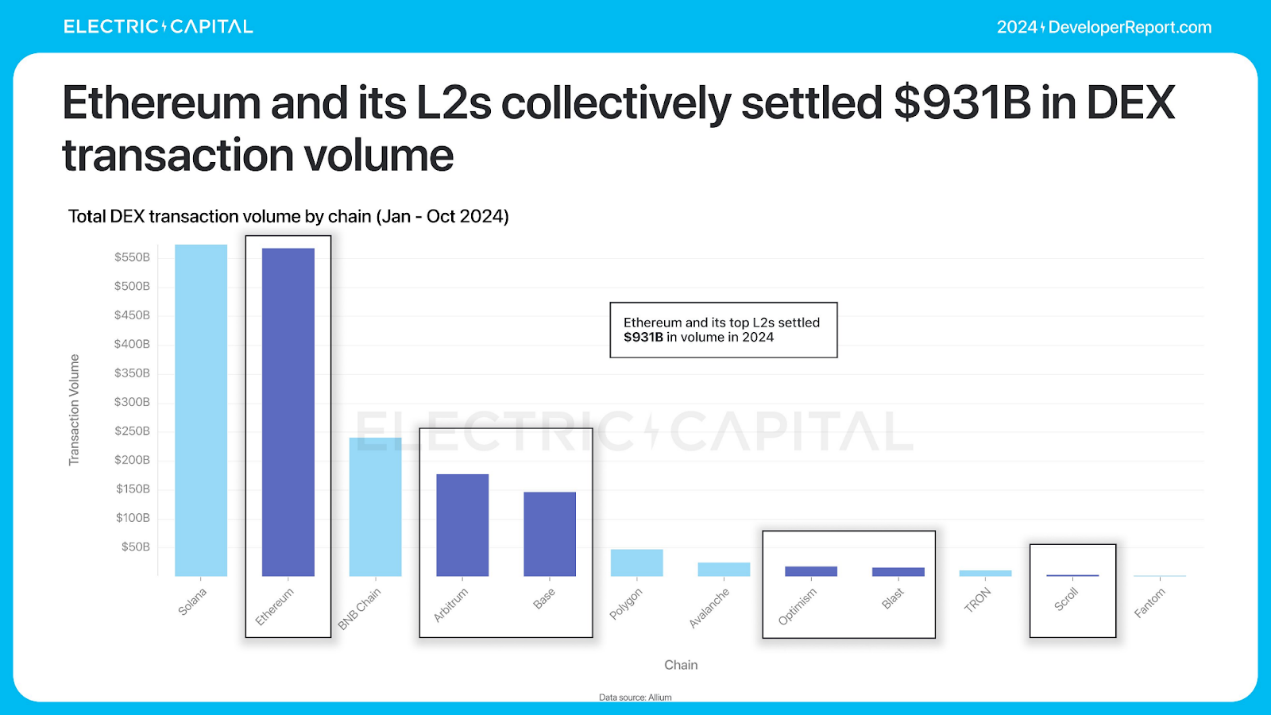
Solana will settle the highest volume at $574 billion in 2024. Ethereum mainnet and its L2 will settle a total of $931 billion in DEX volume.

Electric Capital's annual developer report: 39,000 new developers joined, more than half of Ethereum developers are committed to L2

Electric Capital's annual developer report: 39,000 new developers joined, more than half of Ethereum developers are committed to L2

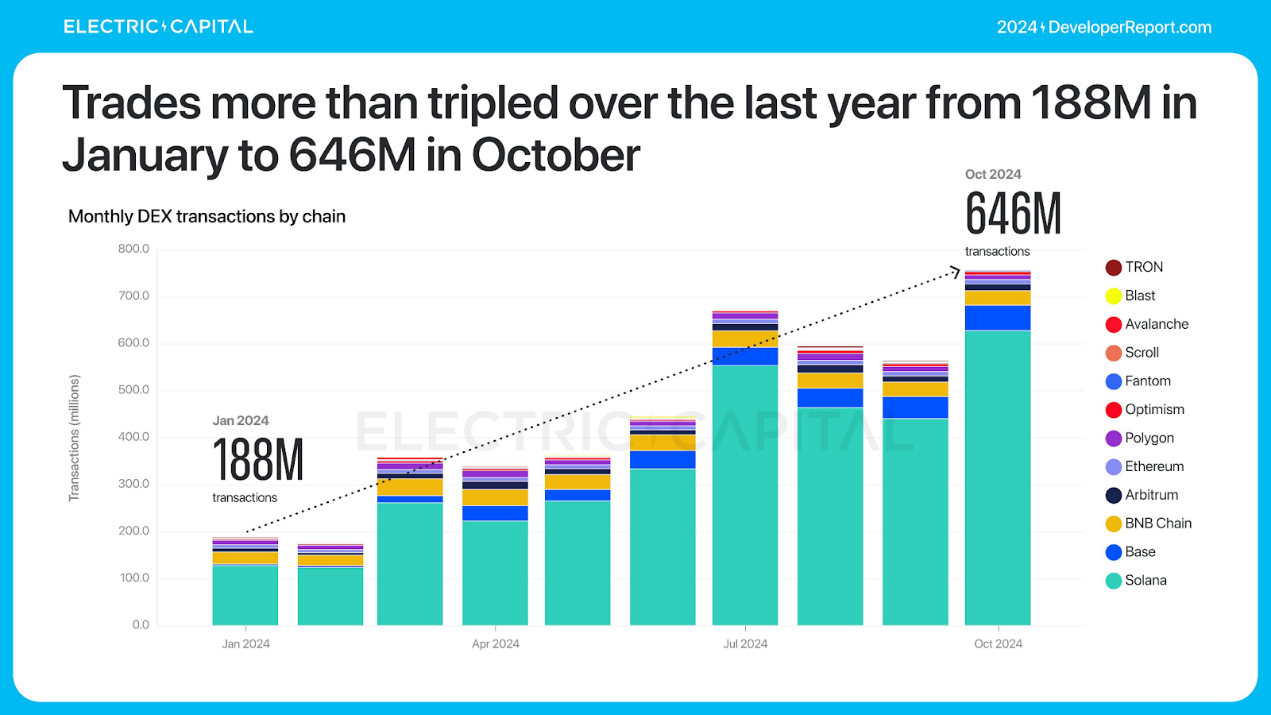
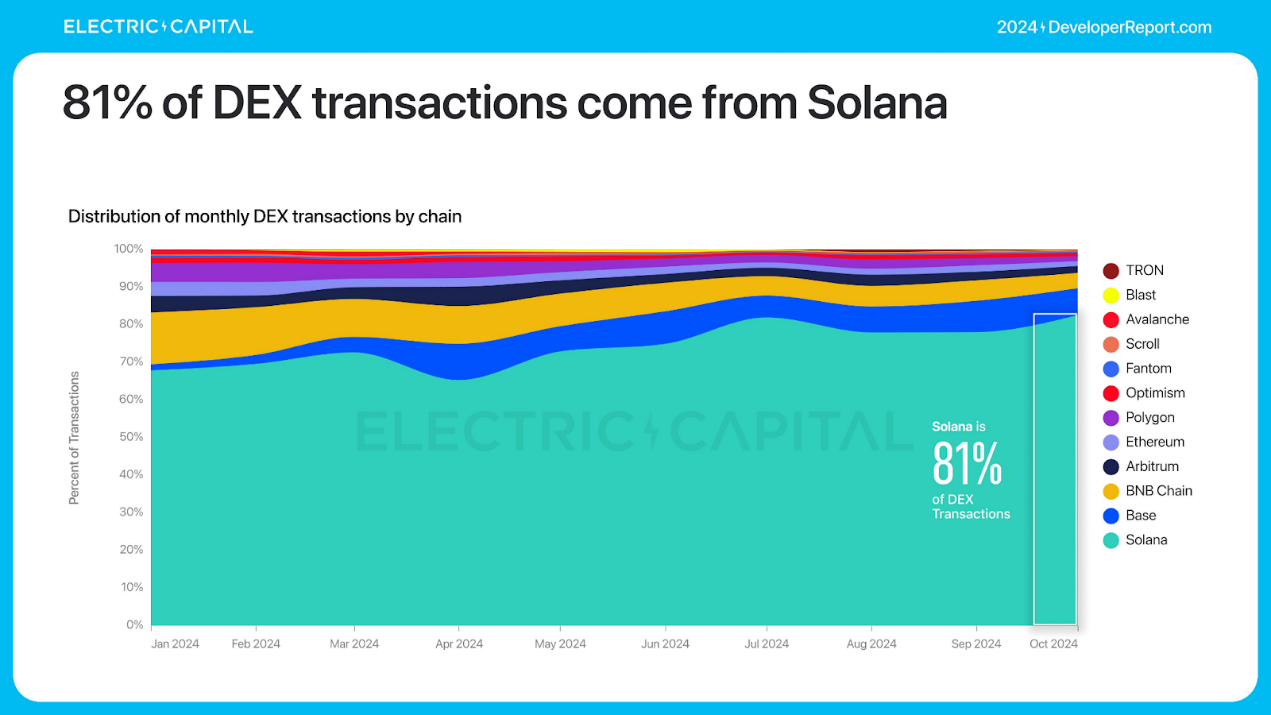
Solana dominates the low-fee DEX use case. Transaction volume more than tripled in 2024, reaching 646 million transactions per month. 81% of DEX transactions come from Solana.

Electric Capital's annual developer report: 39,000 new developers joined, more than half of Ethereum developers are committed to L2

Electric Capital's annual developer report: 39,000 new developers joined, more than half of Ethereum developers are committed to L2

DEX can be used to understand the usage of DeFi because financial activities often start or end with DEX.

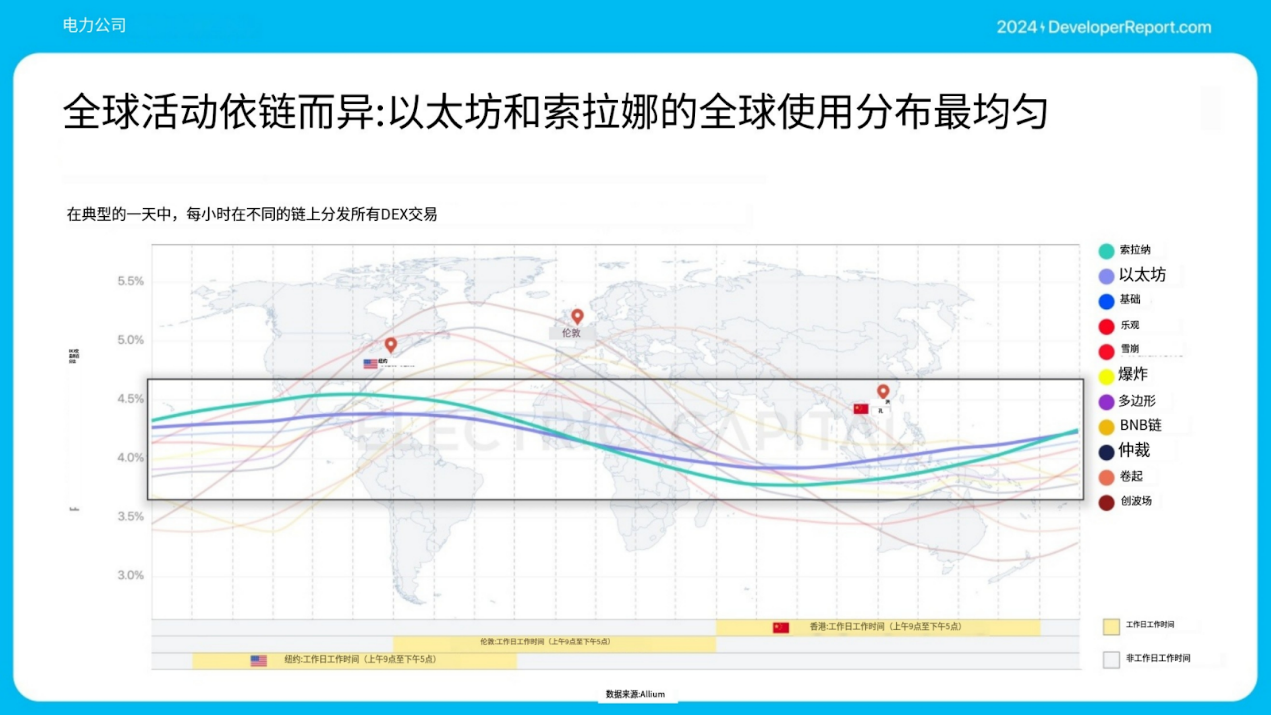
Global activity varies by chain, with the flatter the activity, the more widespread the usage. Ethereum and Solana have the most evenly distributed usage.

Electric Capital's annual developer report: 39,000 new developers joined, more than half of Ethereum developers are committed to L2

Electric Capital's annual developer report: 39,000 new developers joined, more than half of Ethereum developers are committed to L2

Stablecoins

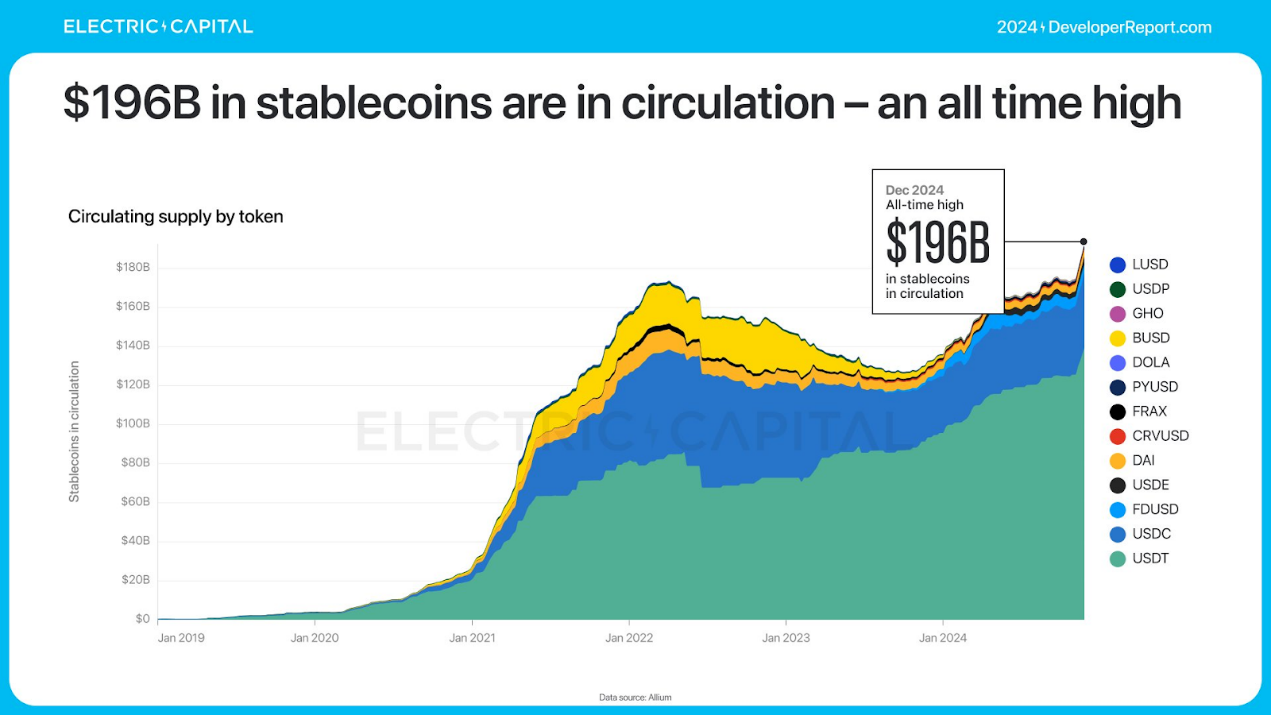
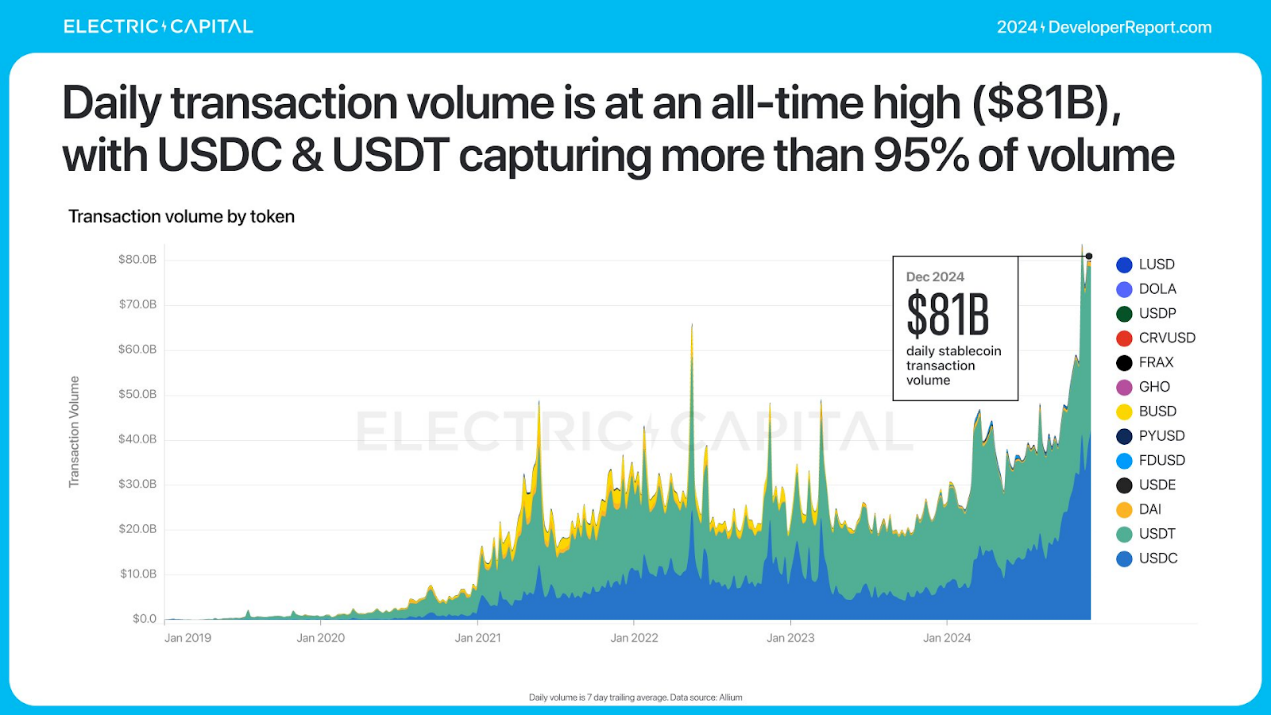
Stablecoins are one of the largest use cases for cryptocurrencies worldwide. Stablecoin usage is at an all-time high: $196 billion worth of stablecoins in circulation and $81 billion in daily trading volume, both of which are all-time highs for stablecoins. USDC and USDT account for 95% of trading volume.

Electric Capital's annual developer report: 39,000 new developers joined, more than half of Ethereum developers are committed to L2

Electric Capital's annual developer report: 39,000 new developers joined, more than half of Ethereum developers are committed to L2

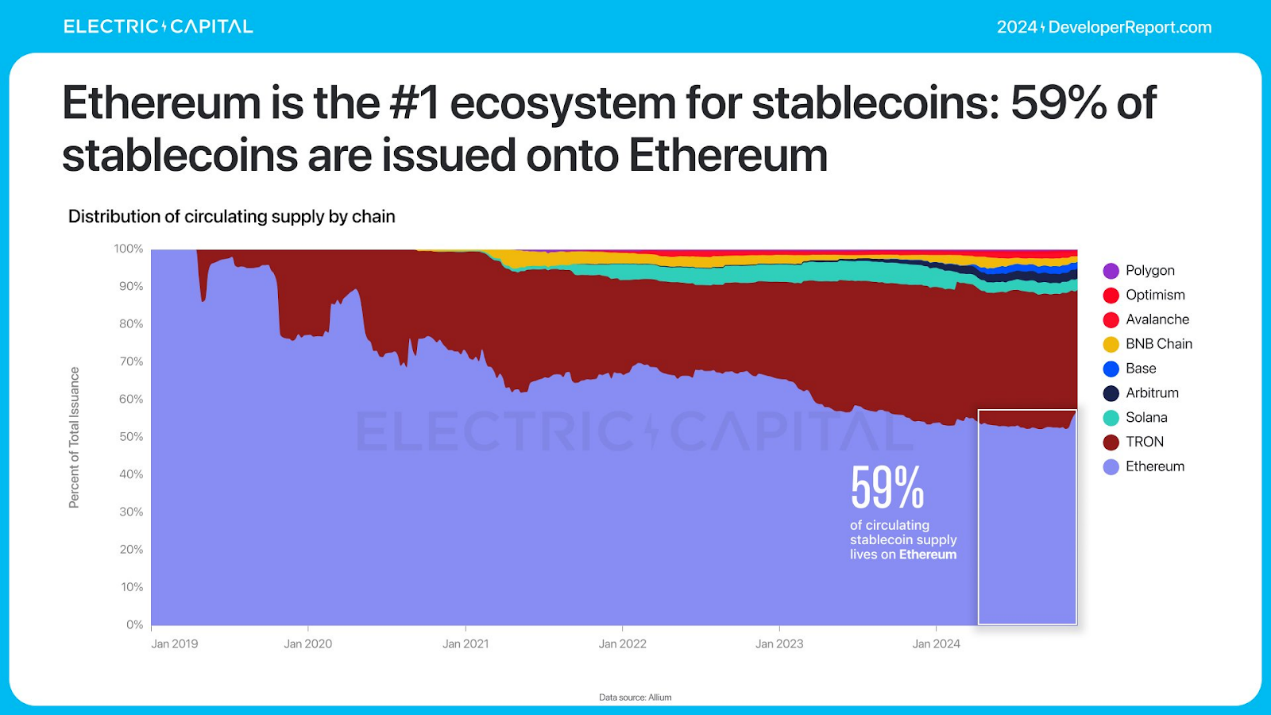
Ethereum is the largest stablecoin ecosystem, with 59% of stablecoins issued on Ethereum.

Electric Capital's annual developer report: 39,000 new developers joined, more than half of Ethereum developers are committed to L2

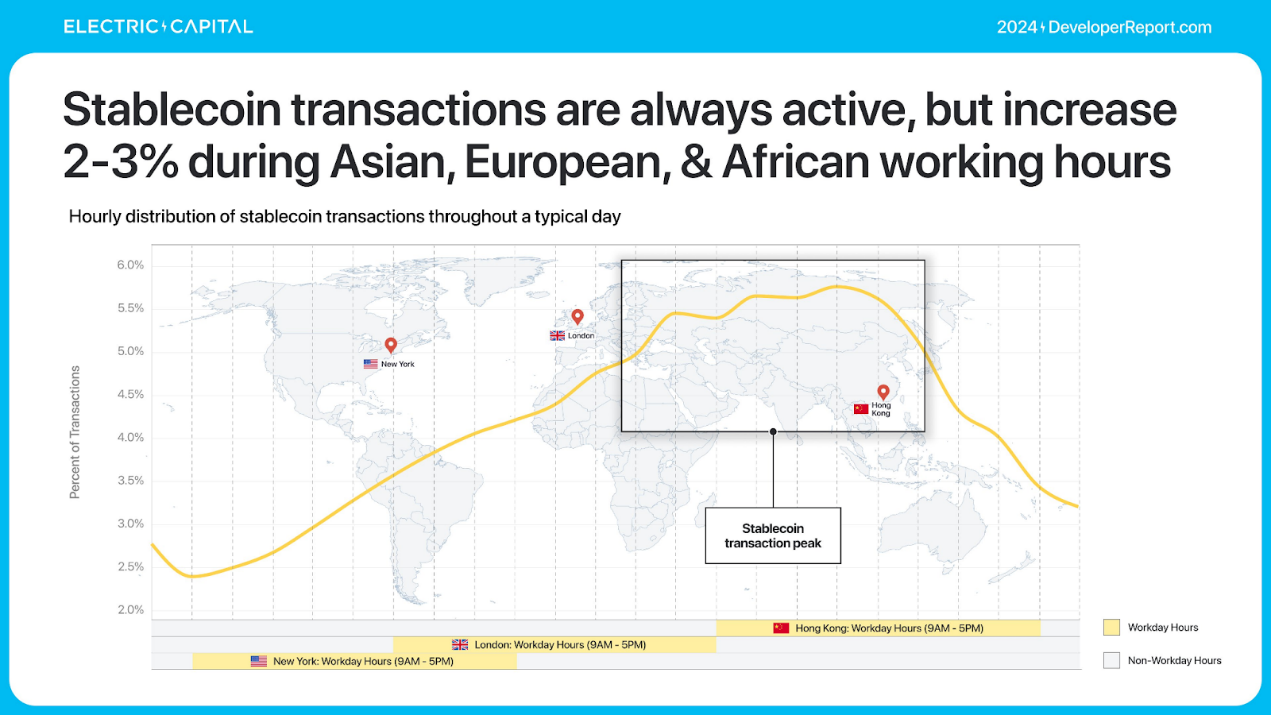
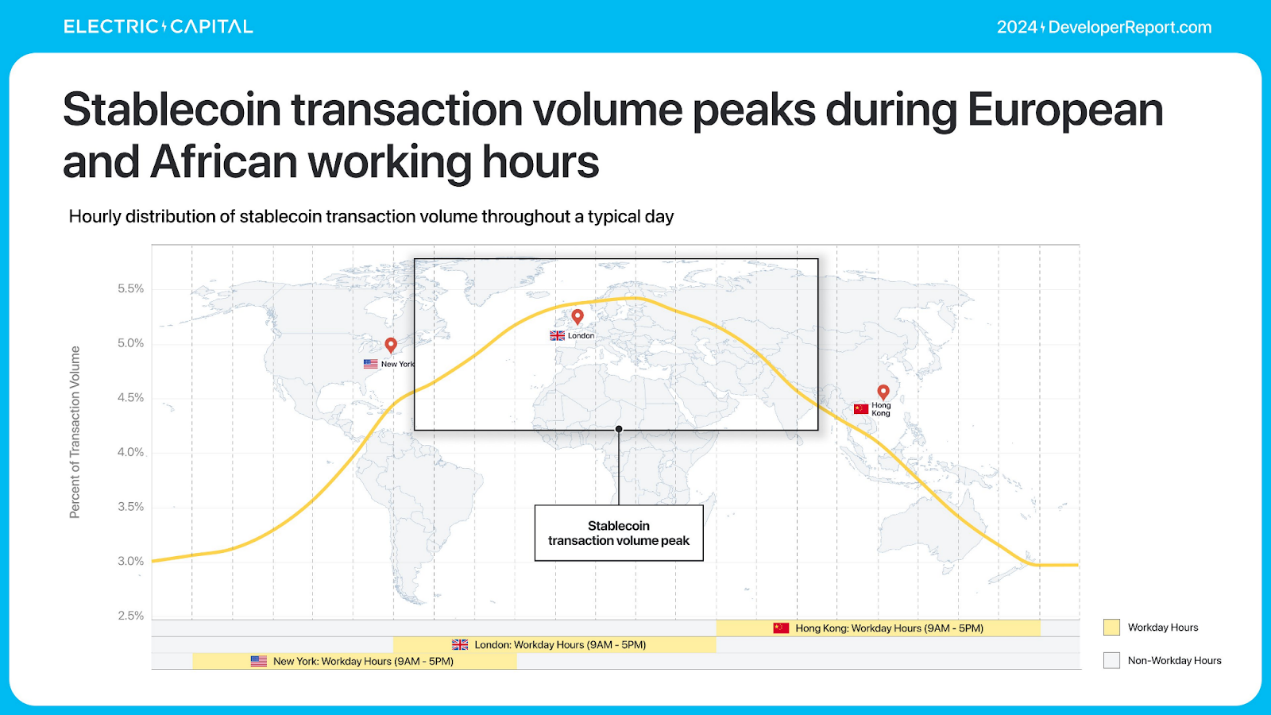
Stablecoins are always active, but are active 2-3% more in Asia, Europe, and Africa.

Although stablecoin trading peaks during Eastern time, volume is more skewed toward the West.
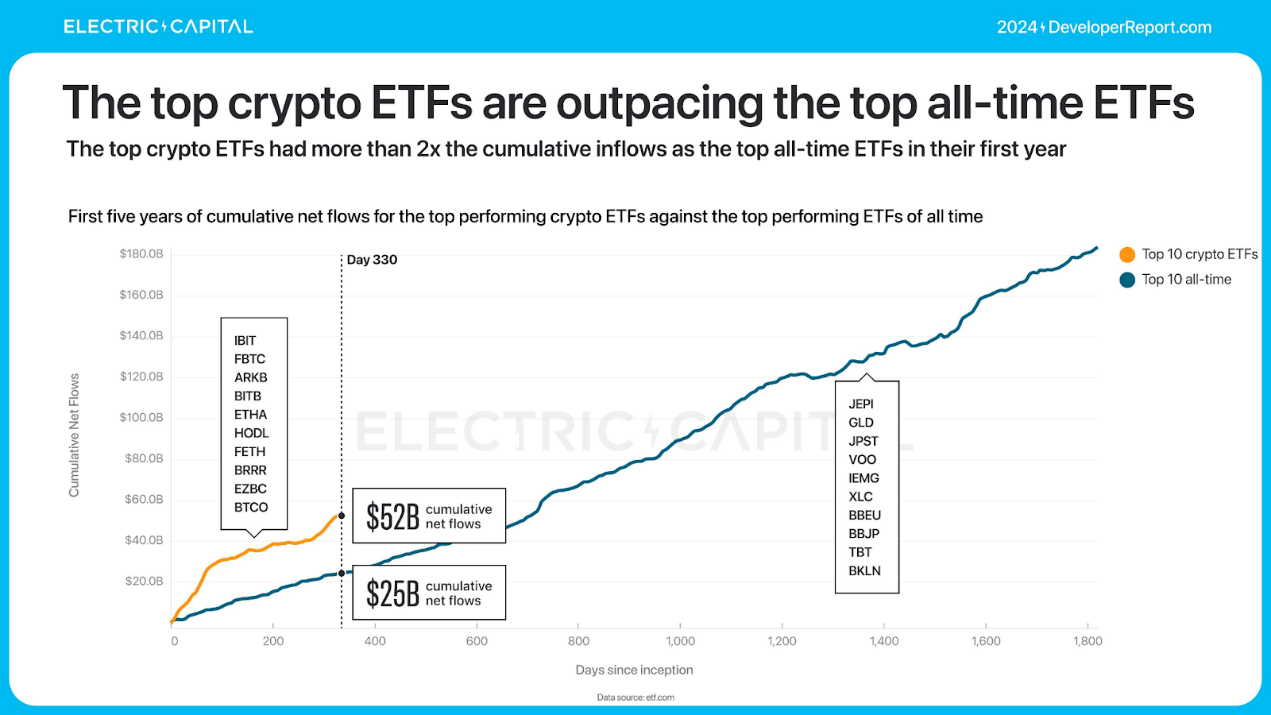
Electric Capital's annual developer report: 39,000 new developers joined, more than half of Ethereum developers are committed to L2

Electric Capital's annual developer report: 39,000 new developers joined, more than half of Ethereum developers are committed to L2

ETF

The launch of Bitcoin and Ethereum ETFs this year has made it easy for off-chain capital to access on-chain assets. The Bitcoin ETF has attracted over $50 billion in net inflows, making it one of the most successful ETFs ever.

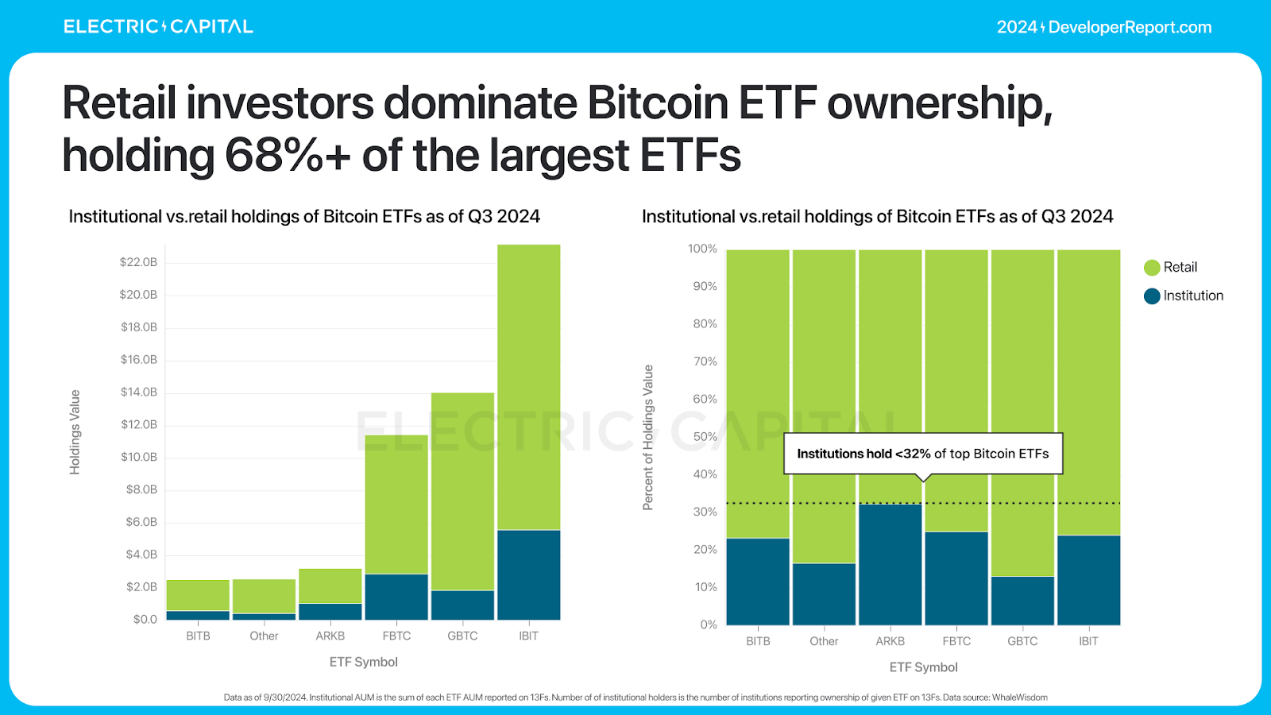
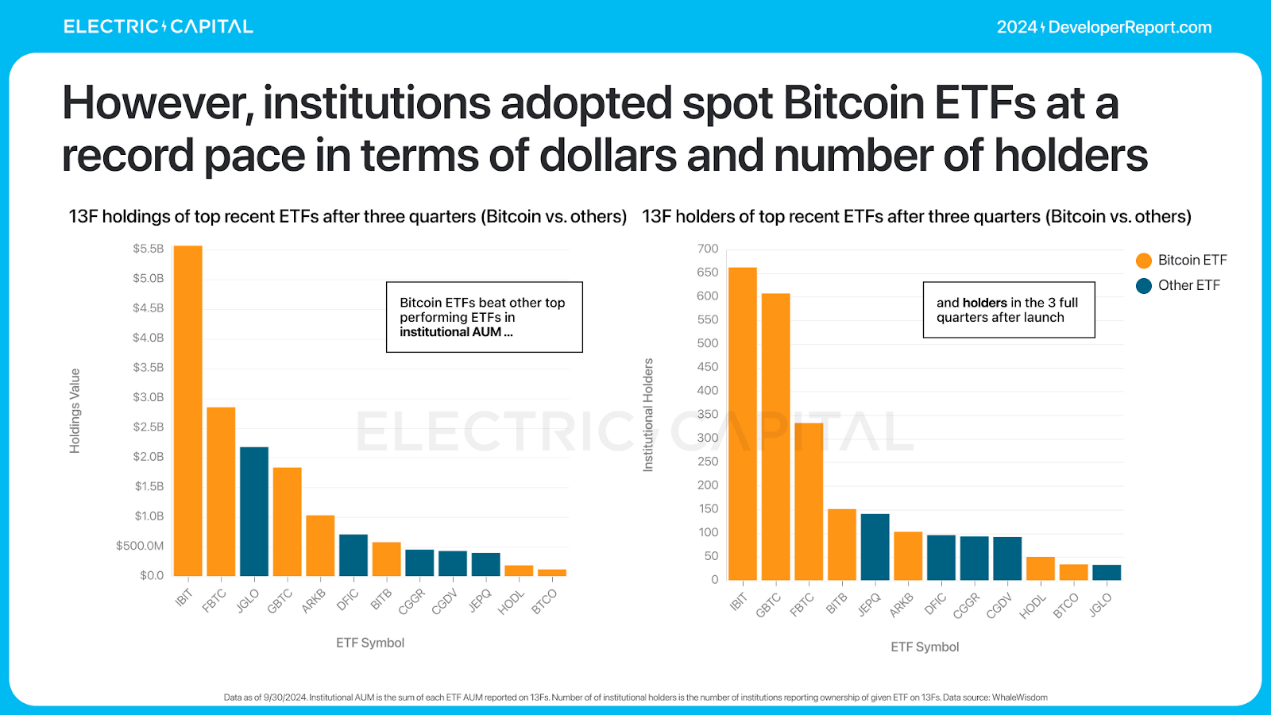
Most of the Bitcoin ETF trading volume is driven by retail investors. Given that spot Bitcoin ETFs are still in their infancy, institutional investors are still adopting the ETF at a record pace.

Electric Capital's annual developer report: 39,000 new developers joined, more than half of Ethereum developers are committed to L2

Electric Capital's annual developer report: 39,000 new developers joined, more than half of Ethereum developers are committed to L2

The Ethereum ETF was launched in July this year.

Ethereum ETF currently holds $13 billion in AUM and attracted $3.5 billion in net inflows. This is consistent with the most successful ETF launch pace since 2022 (excluding Bitcoin ETF). This is also mainly driven by retail investors.

Electric Capital's annual developer report: 39,000 new developers joined, more than half of Ethereum developers are committed to L2

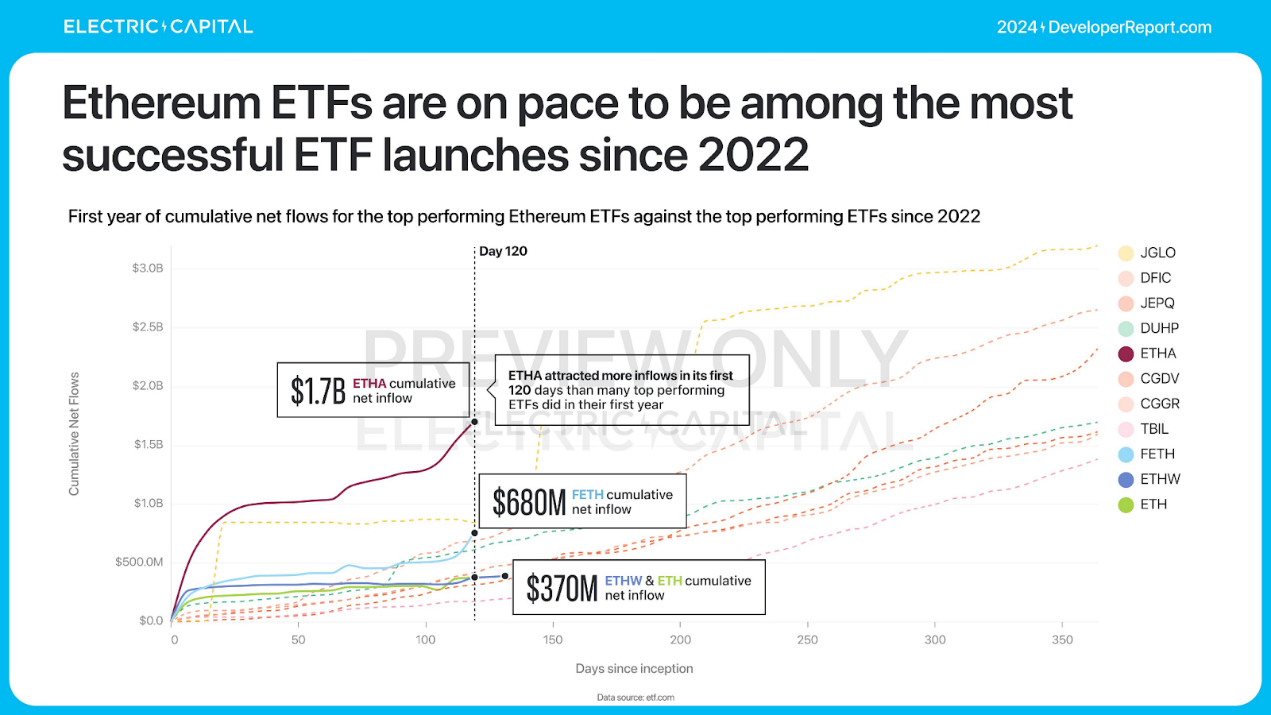
Bitcoin and Ethereum ETFs set records. Their first-year cumulative inflows are now more than double the best ETFs of all time.

Electric Capital's annual developer report: 39,000 new developers joined, more than half of Ethereum developers are committed to L2

Related reading: Electric Capital 2023 Developer Report: 30% choose multi-chain development, Scroll and ICP grow faster

Disclaimer: The articles reposted on this site are sourced from public platforms and are provided for informational purposes only. They do not necessarily reflect the views of MEXC. All rights remain with the original authors. If you believe any content infringes on third-party rights, please contact [email protected] for removal. MEXC makes no guarantees regarding the accuracy, completeness, or timeliness of the content and is not responsible for any actions taken based on the information provided. The content does not constitute financial, legal, or other professional advice, nor should it be considered a recommendation or endorsement by MEXC.

You May Also Like

Over 60% of crypto press releases linked to high-risk or scam projects: Report

Over 60% of crypto press releases linked to high-risk or scam projects: Report

A data analysis shows crypto press release wires are dominated by scam-linked projects, hype-driven content and low-impact announcements, raising concerns about
Share
Crypto.news2026/02/04 22:02
ArtGis Finance Partners with MetaXR to Expand its DeFi Offerings in the Metaverse

ArtGis Finance Partners with MetaXR to Expand its DeFi Offerings in the Metaverse

By using this collaboration, ArtGis utilizes MetaXR’s infrastructure to widen access to its assets and enable its customers to interact with the metaverse.
Share
Blockchainreporter2025/09/18 00:07
Crucial US Stock Market Update: What Wednesday’s Mixed Close Reveals

Crucial US Stock Market Update: What Wednesday’s Mixed Close Reveals

BitcoinWorld Crucial US Stock Market Update: What Wednesday’s Mixed Close Reveals The financial world often keeps us on our toes, and Wednesday was no exception. Investors watched closely as the US stock market concluded the day with a mixed performance across its major indexes. This snapshot offers a crucial glimpse into current investor sentiment and economic undercurrents, prompting many to ask: what exactly happened? Understanding the Latest US Stock Market Movements On Wednesday, the closing bell brought a varied picture for the US stock market. While some indexes celebrated gains, others registered slight declines, creating a truly mixed bag for investors. The Dow Jones Industrial Average showed resilience, climbing by a notable 0.57%. This positive movement suggests strength in some of the larger, more established companies. Conversely, the S&P 500, a broader benchmark often seen as a barometer for the overall market, experienced a modest dip of 0.1%. The technology-heavy Nasdaq Composite also saw a slight retreat, sliding by 0.33%. This particular index often reflects investor sentiment towards growth stocks and the tech sector. These divergent outcomes highlight the complex dynamics currently at play within the American economy. It’s not simply a matter of “up” or “down” for the entire US stock market; rather, it’s a nuanced landscape where different sectors and company types are responding to unique pressures and opportunities. Why Did the US Stock Market See Mixed Results? When the US stock market delivers a mixed performance, it often points to a tug-of-war between various economic factors. Several elements could have contributed to Wednesday’s varied closings. For instance, positive corporate earnings reports from certain industries might have bolstered the Dow. At the same time, concerns over inflation, interest rate policies by the Federal Reserve, or even global economic uncertainties could have pressured growth stocks, affecting the S&P 500 and Nasdaq. Key considerations often include: Economic Data: Recent reports on employment, manufacturing, or consumer spending can sway market sentiment. Corporate Announcements: Strong or weak earnings forecasts from influential companies can significantly impact their respective sectors. Interest Rate Expectations: The prospect of higher or lower interest rates directly influences borrowing costs for businesses and consumer spending, affecting future profitability. Geopolitical Events: Global tensions or trade policies can introduce uncertainty, causing investors to become more cautious. Understanding these underlying drivers is crucial for anyone trying to make sense of daily market fluctuations in the US stock market. Navigating Volatility in the US Stock Market A mixed close, while not a dramatic downturn, serves as a reminder that market volatility is a constant companion for investors. For those involved in the US stock market, particularly individuals managing their portfolios, these days underscore the importance of a well-thought-out strategy. It’s important not to react impulsively to daily movements. Instead, consider these actionable insights: Diversification: Spreading investments across different sectors and asset classes can help mitigate risk when one area underperforms. Long-Term Perspective: Focusing on long-term financial goals rather than short-term gains can help weather daily market swings. Stay Informed: Keeping abreast of economic news and company fundamentals provides context for market behavior. Consult Experts: Financial advisors can offer personalized guidance based on individual risk tolerance and objectives. Even small movements in major indexes can signal shifts that require attention, guiding future investment decisions within the dynamic US stock market. What’s Next for the US Stock Market? Looking ahead, investors will be keenly watching for further economic indicators and corporate announcements to gauge the direction of the US stock market. Upcoming inflation data, statements from the Federal Reserve, and quarterly earnings reports will likely provide more clarity. The interplay of these factors will continue to shape investor confidence and, consequently, the performance of the Dow, S&P 500, and Nasdaq. Remaining informed and adaptive will be key to understanding the market’s trajectory. Conclusion: Wednesday’s mixed close in the US stock market highlights the intricate balance of forces influencing financial markets. While the Dow showed strength, the S&P 500 and Nasdaq experienced slight declines, reflecting a nuanced economic landscape. This reminds us that understanding the ‘why’ behind these movements is as important as the movements themselves. As always, a thoughtful, informed approach remains the best strategy for navigating the complexities of the market. Frequently Asked Questions (FAQs) Q1: What does a “mixed close” mean for the US stock market? A1: A mixed close indicates that while some major stock indexes advanced, others declined. It suggests that different sectors or types of companies within the US stock market are experiencing varying influences, rather than a uniform market movement. Q2: Which major indexes were affected on Wednesday? A2: On Wednesday, the Dow Jones Industrial Average gained 0.57%, while the S&P 500 edged down 0.1%, and the Nasdaq Composite slid 0.33%, illustrating the mixed performance across the US stock market. Q3: What factors contribute to a mixed stock market performance? A3: Mixed performances in the US stock market can be influenced by various factors, including specific corporate earnings, economic data releases, shifts in interest rate expectations, and broader geopolitical events that affect different market segments uniquely. Q4: How should investors react to mixed market signals? A4: Investors are generally advised to maintain a long-term perspective, diversify their portfolios, stay informed about economic news, and avoid impulsive decisions. Consulting a financial advisor can also provide personalized guidance for navigating the US stock market. Q5: What indicators should investors watch for future US stock market trends? A5: Key indicators to watch include upcoming inflation reports, statements from the Federal Reserve regarding monetary policy, and quarterly corporate earnings reports. These will offer insights into the future direction of the US stock market. Did you find this analysis of the US stock market helpful? Share this article with your network on social media to help others understand the nuances of current financial trends! To learn more about the latest stock market trends, explore our article on key developments shaping the US stock market‘s future performance. This post Crucial US Stock Market Update: What Wednesday’s Mixed Close Reveals first appeared on BitcoinWorld.
Share
Coinstats2025/09/18 05:30