This article will conduct an in-depth analysis from four dimensions: time cycle, macroeconomics, market demand, and on-chain data.This article will conduct an in-depth analysis from four dimensions: time cycle, macroeconomics, market demand, and on-chain data.

BTC's new journey after breaking $100,000: 10 reasons to hit $150,000 in 2025

2024/12/09 15:51
3 min read

BTC's new journey after breaking $100,000: 10 reasons to hit $150,000 in 2025

Original author: Miles Deutscher , Crypto Analyst

Compiled by: Yuliya, PANews

The market is experiencing a critical turning point. After Bitcoin broke through the $100,000 mark this week, investors' attention has turned to the next price target. Based on comprehensive data analysis, multiple indicators are showing that Bitcoin is expected to reach a new high of $150,000 by 2025.

This report will conduct in-depth analysis from the following four dimensions through 10 key indicators:

  • Timing cycle analysis

  • Macroeconomic factors

  • Market demand dynamics

  • On-chain data indicators

Timing cycle analysis

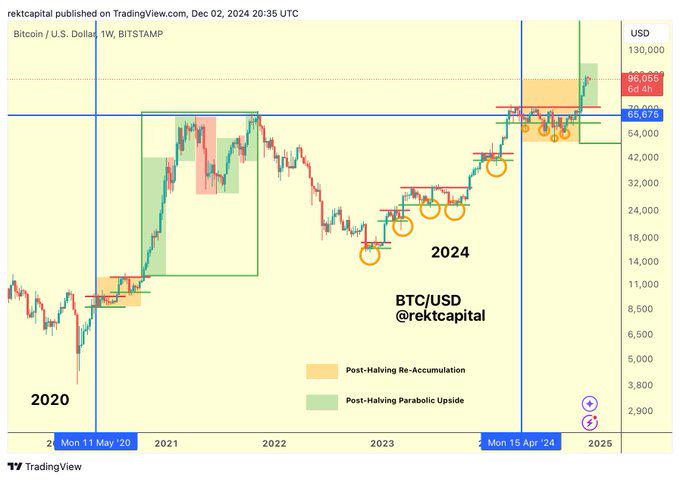
1. The current Bitcoin price trend is highly similar to previous cycles.

BTC's new journey after breaking $100,000: 10 reasons to hit $150,000 in 2025

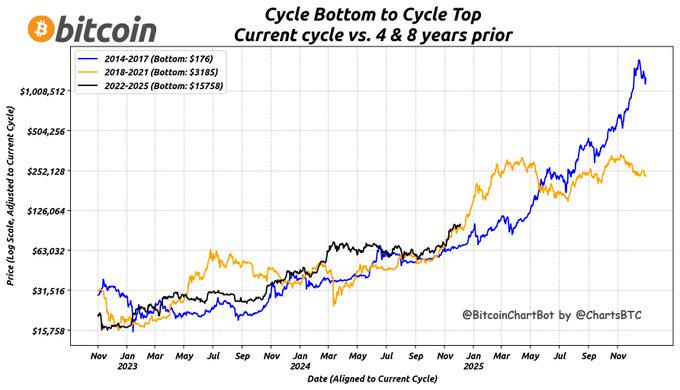
2. The market has entered its most explosive phase, which is the period when prices accelerate fastest.

BTC's new journey after breaking $100,000: 10 reasons to hit $150,000 in 2025

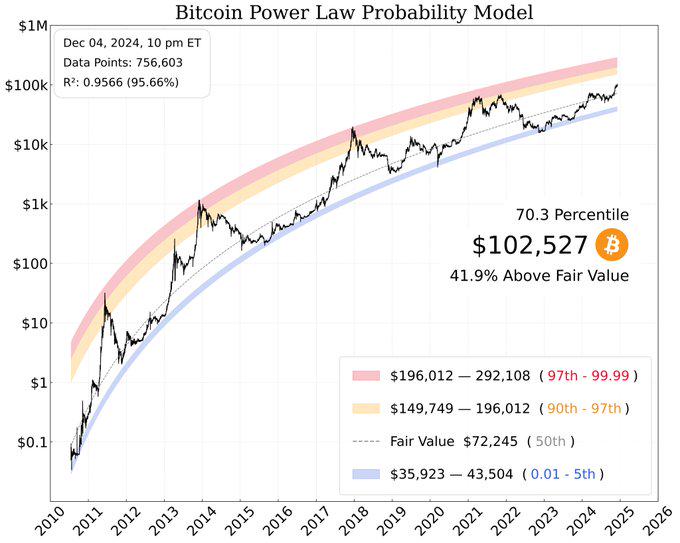
3. Throughout historical cycles, Bitcoin will enter the red area (97%) of the power law probability model. If this cycle repeats this pattern, it means that the price of Bitcoin will exceed $196,000.

BTC's new journey after breaking $100,000: 10 reasons to hit $150,000 in 2025

Macroeconomic factors

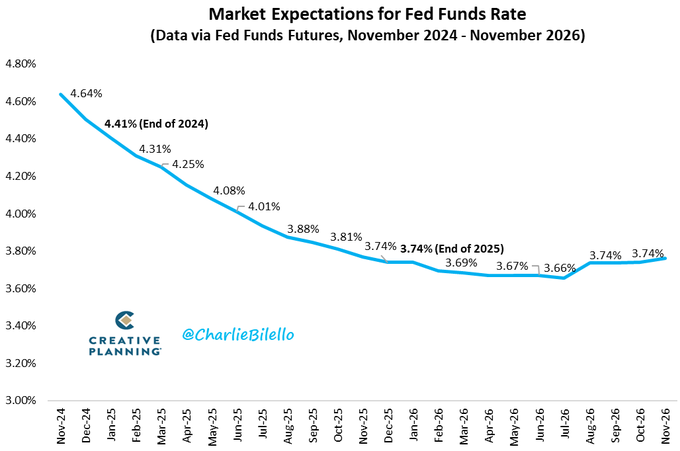
4. The current macro environment is in the most favorable state since 2021. Bitcoin is extremely sensitive to changes in monetary policy and global liquidity.

BTC's new journey after breaking $100,000: 10 reasons to hit $150,000 in 2025

5. Interest rate cuts are expected to continue in 2025, which will create strong macro support for risky assets.

BTC's new journey after breaking $100,000: 10 reasons to hit $150,000 in 2025

Market demand dynamics

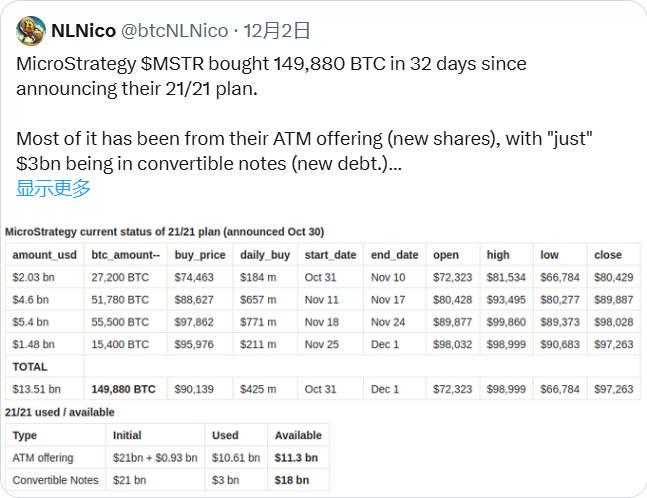
6. MicroStrategy continues to buy according to its 21/21 plan (targeting to hold 21% of the total supply of Bitcoin, with $29.3 billion remaining to be invested).

This affects Bitcoin demand in two ways:

  • MicroStrategy’s sustained and aggressive buying pressure

  • Speculative funds are deployed in advance to cope with future buying pressure

BTC's new journey after breaking $100,000: 10 reasons to hit $150,000 in 2025

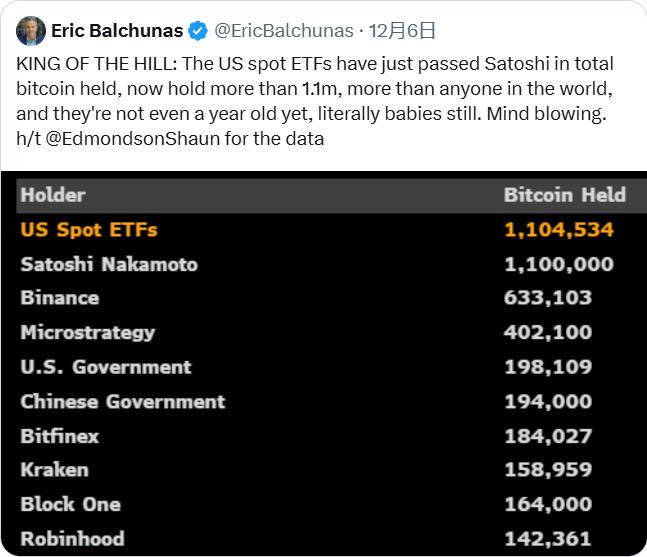
7. US spot ETF holdings have exceeded 1.1 million bitcoins, exceeding Satoshi Nakamoto's holdings. This brings continuous buying pressure. Spot ETFs also produce an extremely powerful "unit deviation" effect.

BTC's new journey after breaking $100,000: 10 reasons to hit $150,000 in 2025

BTC's new journey after breaking $100,000: 10 reasons to hit $150,000 in 2025

On-chain data indicators

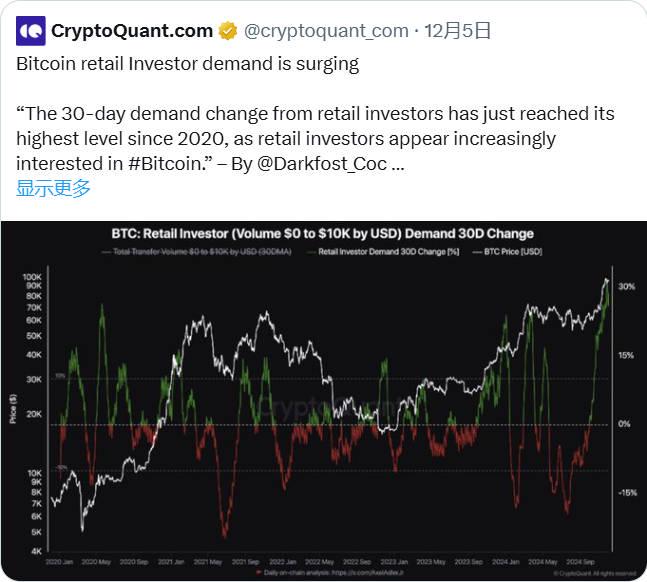
8. Retail demand for Bitcoin surges to its highest level since 2020.

BTC's new journey after breaking $100,000: 10 reasons to hit $150,000 in 2025

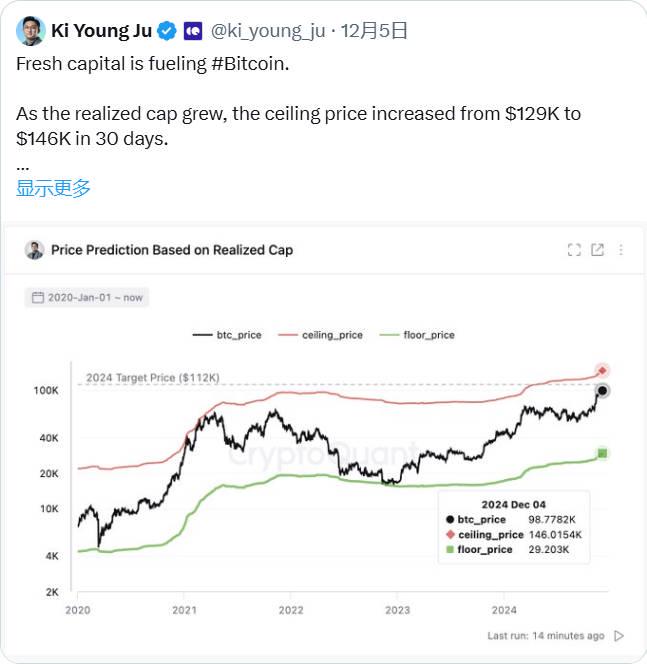
9. New money is driving Bitcoin's current price action. "Even at $102,000, it's still far from bubble levels - it would take another 43% to reach what is generally considered a bubble threshold."

BTC's new journey after breaking $100,000: 10 reasons to hit $150,000 in 2025

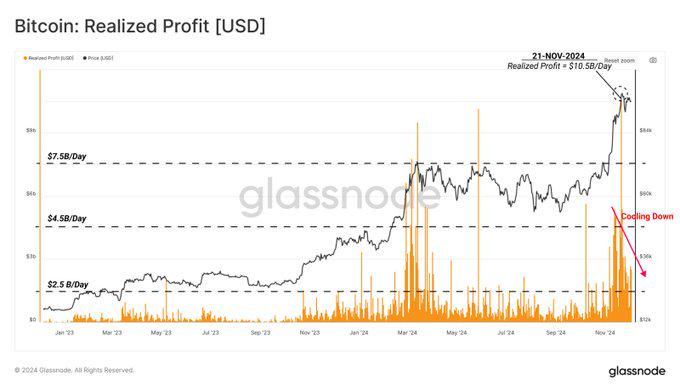
10. Even at $100,000, profit-taking pressure is easing, indicating that selling pressure is cooling.

BTC's new journey after breaking $100,000: 10 reasons to hit $150,000 in 2025

Market Outlook

Currently, multiple factors are highly consistent, indicating that the upward trend will continue. In such an environment, Bitcoin breaking through $150,000 will inject strong momentum into the entire cryptocurrency market.

The increase in market liquidity will inevitably lead to a greater rise in prices, especially for the altcoin market. In the next few weeks, we will continue to track and share altcoin investment opportunities that are worth paying attention to.

Market Opportunity
Bitcoin Logo
Bitcoin Price(BTC)
$64,969.72
$64,969.72$64,969.72
-3.74%
USD
Bitcoin (BTC) Live Price Chart
Disclaimer: The articles reposted on this site are sourced from public platforms and are provided for informational purposes only. They do not necessarily reflect the views of MEXC. All rights remain with the original authors. If you believe any content infringes on third-party rights, please contact [email protected] for removal. MEXC makes no guarantees regarding the accuracy, completeness, or timeliness of the content and is not responsible for any actions taken based on the information provided. The content does not constitute financial, legal, or other professional advice, nor should it be considered a recommendation or endorsement by MEXC.

You May Also Like

Microsoft Corp. $MSFT blue box area offers a buying opportunity

Microsoft Corp. $MSFT blue box area offers a buying opportunity

The post Microsoft Corp. $MSFT blue box area offers a buying opportunity appeared on BitcoinEthereumNews.com. In today’s article, we’ll examine the recent performance of Microsoft Corp. ($MSFT) through the lens of Elliott Wave Theory. We’ll review how the rally from the April 07, 2025 low unfolded as a 5-wave impulse followed by a 3-swing correction (ABC) and discuss our forecast for the next move. Let’s dive into the structure and expectations for this stock. Five wave impulse structure + ABC + WXY correction $MSFT 8H Elliott Wave chart 9.04.2025 In the 8-hour Elliott Wave count from Sep 04, 2025, we saw that $MSFT completed a 5-wave impulsive cycle at red III. As expected, this initial wave prompted a pullback. We anticipated this pullback to unfold in 3 swings and find buyers in the equal legs area between $497.02 and $471.06 This setup aligns with a typical Elliott Wave correction pattern (ABC), in which the market pauses briefly before resuming its primary trend. $MSFT 8H Elliott Wave chart 7.14.2025 The update, 10 days later, shows the stock finding support from the equal legs area as predicted allowing traders to get risk free. The stock is expected to bounce towards 525 – 532 before deciding if the bounce is a connector or the next leg higher. A break into new ATHs will confirm the latter and can see it trade higher towards 570 – 593 area. Until then, traders should get risk free and protect their capital in case of a WXY double correction. Conclusion In conclusion, our Elliott Wave analysis of Microsoft Corp. ($MSFT) suggested that it remains supported against April 07, 2025 lows and bounce from the blue box area. In the meantime, keep an eye out for any corrective pullbacks that may offer entry opportunities. By applying Elliott Wave Theory, traders can better anticipate the structure of upcoming moves and enhance risk management in volatile markets. Source: https://www.fxstreet.com/news/microsoft-corp-msft-blue-box-area-offers-a-buying-opportunity-202509171323
Share
BitcoinEthereumNews2025/09/18 03:50
Marathon Digital BTC Transfers Highlight Miner Stress

Marathon Digital BTC Transfers Highlight Miner Stress

The post Marathon Digital BTC Transfers Highlight Miner Stress appeared on BitcoinEthereumNews.com. In a tense week for crypto markets, marathon digital has drawn
Share
BitcoinEthereumNews2026/02/06 15:16
Fintech in a Fragmented World: Building Financial Products Across Geopolitical Lines

Fintech in a Fragmented World: Building Financial Products Across Geopolitical Lines

For most of the last ten years, the fintech growth story was one without borders. Startups made digital wallets, payment platforms, lending systems, and trading
Share
Globalfintechseries2026/02/06 15:17