PANews conducted data analysis based on DeFi-related tokens from Defillama and Coingecko, and used data to see which projects are likely to be underestimated by the market.PANews conducted data analysis based on DeFi-related tokens from Defillama and Coingecko, and used data to see which projects are likely to be underestimated by the market.

Analyzing 86 DeFi project data: Finding undervalued investment opportunities

2024/12/06 15:45
7 min read

Author: Frank, PANews

The crypto market is once again celebrating. On December 5, Bitcoin broke through the $100,000 mark. Other altcoins also began to surge against this backdrop. Previously, PANews conducted a market analysis of the mainstream tokens in the overall market. Over 60% of the tokens have risen by more than 100% in the past month. (Related reading: The altcoin season is here! Data analysis of the performance of 289 tokens, 60% of which rose by more than 100%, with public chains and MEME being the hottest )

As the market is improving, investors are looking for targets that may be undervalued. Among many tracks, DeFi projects can be more easily quantified through data such as TVL and fees. In this regard, PANews conducted data analysis based on DeFi-related tokens of Deflama and Coingecko, and used data to see which projects are likely to be undervalued by the market.

Data description: The data for this analysis is taken from December 5, 2024. The data of 86 DeFi-related projects or public chains are analyzed, and then compared and analyzed after being aggregated using the API program. Among them, the market value data and transaction volume data are from Coingecko, and the transaction volume refers to the 24-hour transaction volume of the token. TVL and fee data are from Deflama.

TVL perspective: 42 DeFi projects are relatively undervalued

For DeFi projects, TVL (total value locked) is almost the most important metric. Generally speaking, the larger the TVL, the more funds deposited on the protocol, which means that the protocol has a thicker capital pool and better user recognition. For projects that have already issued tokens, the P/TVL data has a certain reference value. If P/TVL is less than 1, it means that the TVL of this project has exceeded the total market value of the token and may be at a level that is underestimated by the market. If P/TVL is greater than 3, it means that the market believes that the token of the protocol has a high growth potential or the locked value provided by the protocol is considered insufficient.

After data analysis, we can see that among the samples, 42 tokens have a P/TVL of less than 1. Among them, projects including Marinade, Lido, Ether.fi, Scallop, JUST, Venus, Kamino, Morpho, BENQI, Rocket Pool, etc. have the lowest values and are ranked in the top ten.

Analyzing 86 DeFi project data: Finding undervalued investment opportunities

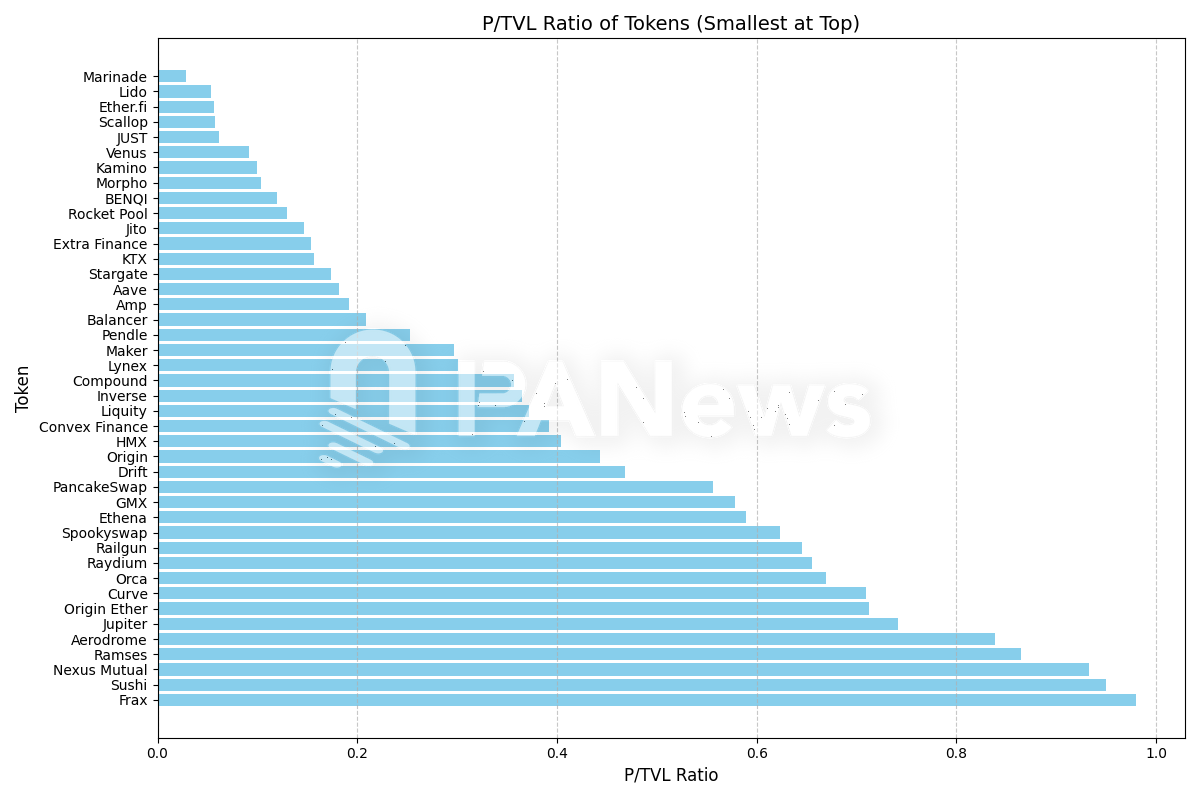
Among these projects, Lido, Aave, Ether.fi, JUST, Maker, Ethena, Amp, Pendle, Jito, and Compound are in the top ten in terms of TVL. These are also DeFi projects that have dominated the list for a long time, and are high TVL and low market value projects. According to the latest data disclosed by Grayscale, as of December 5, 2024, the investment portfolio of Grayscale DeFi Fund consists of 5 tokens: $UNI, $AAVE, $MKR, $LDO, and $SNX. Among Grayscale's holdings, $AAVE, $MKR, and $LDO are also at the forefront of P/TVL values less than 1.

Among the tokens with a P/TVL of less than 1, KTX.Finance has the lowest market value, with a market value of only $568,000 for its token KTC, but a TVL of $8.5 million. However, there are only a few trading markets for this token, and the total number of transfers on Arbitrum is only 35,000 times, indicating poor on-chain activity. In addition, some projects with lower market value include Ramses, HMX, Lynex, Scallop, Spookyswap, Extra Finance, Inverse, etc.

It is worth mentioning that in the ratio of TVL to market value, we can see that the ratios of several popular DEX protocols on Solana are less than 1, such as Raydium, Jupiter, Orca, etc. These projects account for more than 80% of the transaction volume on the Solana chain, but the market value of their tokens is lower than TVL.

What are the most profitable DeFi projects?

In addition to TVL, fees are also an important indicator for measuring the activity and profitability of DeFi projects. However, the reference method of fees is slightly different from TVL. In the fee calculation process, PANews focuses on using the total fee income of the last 30 days to calculate the average daily fee value, and then multiplies this fee value by 365 to simulate the expected annual fee based on the current fee level. This is achieved by comparing this predicted annual fee with the market value and the current total fee.

The first is the ratio of annual expenses to market value. This ratio is very similar to the PE of a company in the traditional financial market. We refer to it as "PF" here. If the PF is less than 10, it means that the project is undervalued. The value between 10 and 20 is generally a reasonable range. 20 to 50 is a project with high growth expectations. If it is greater than 50 times, it is likely to be overvalued.

In this analysis, 38 projects have a PF value of less than 10, among which Lifinity, Orca, Lynex, Raydium, WigoSwap, HMX, Marinade, Thena, Jito, and KTX are among the top ten with the smallest values.

Analyzing 86 DeFi project data: Finding undervalued investment opportunities

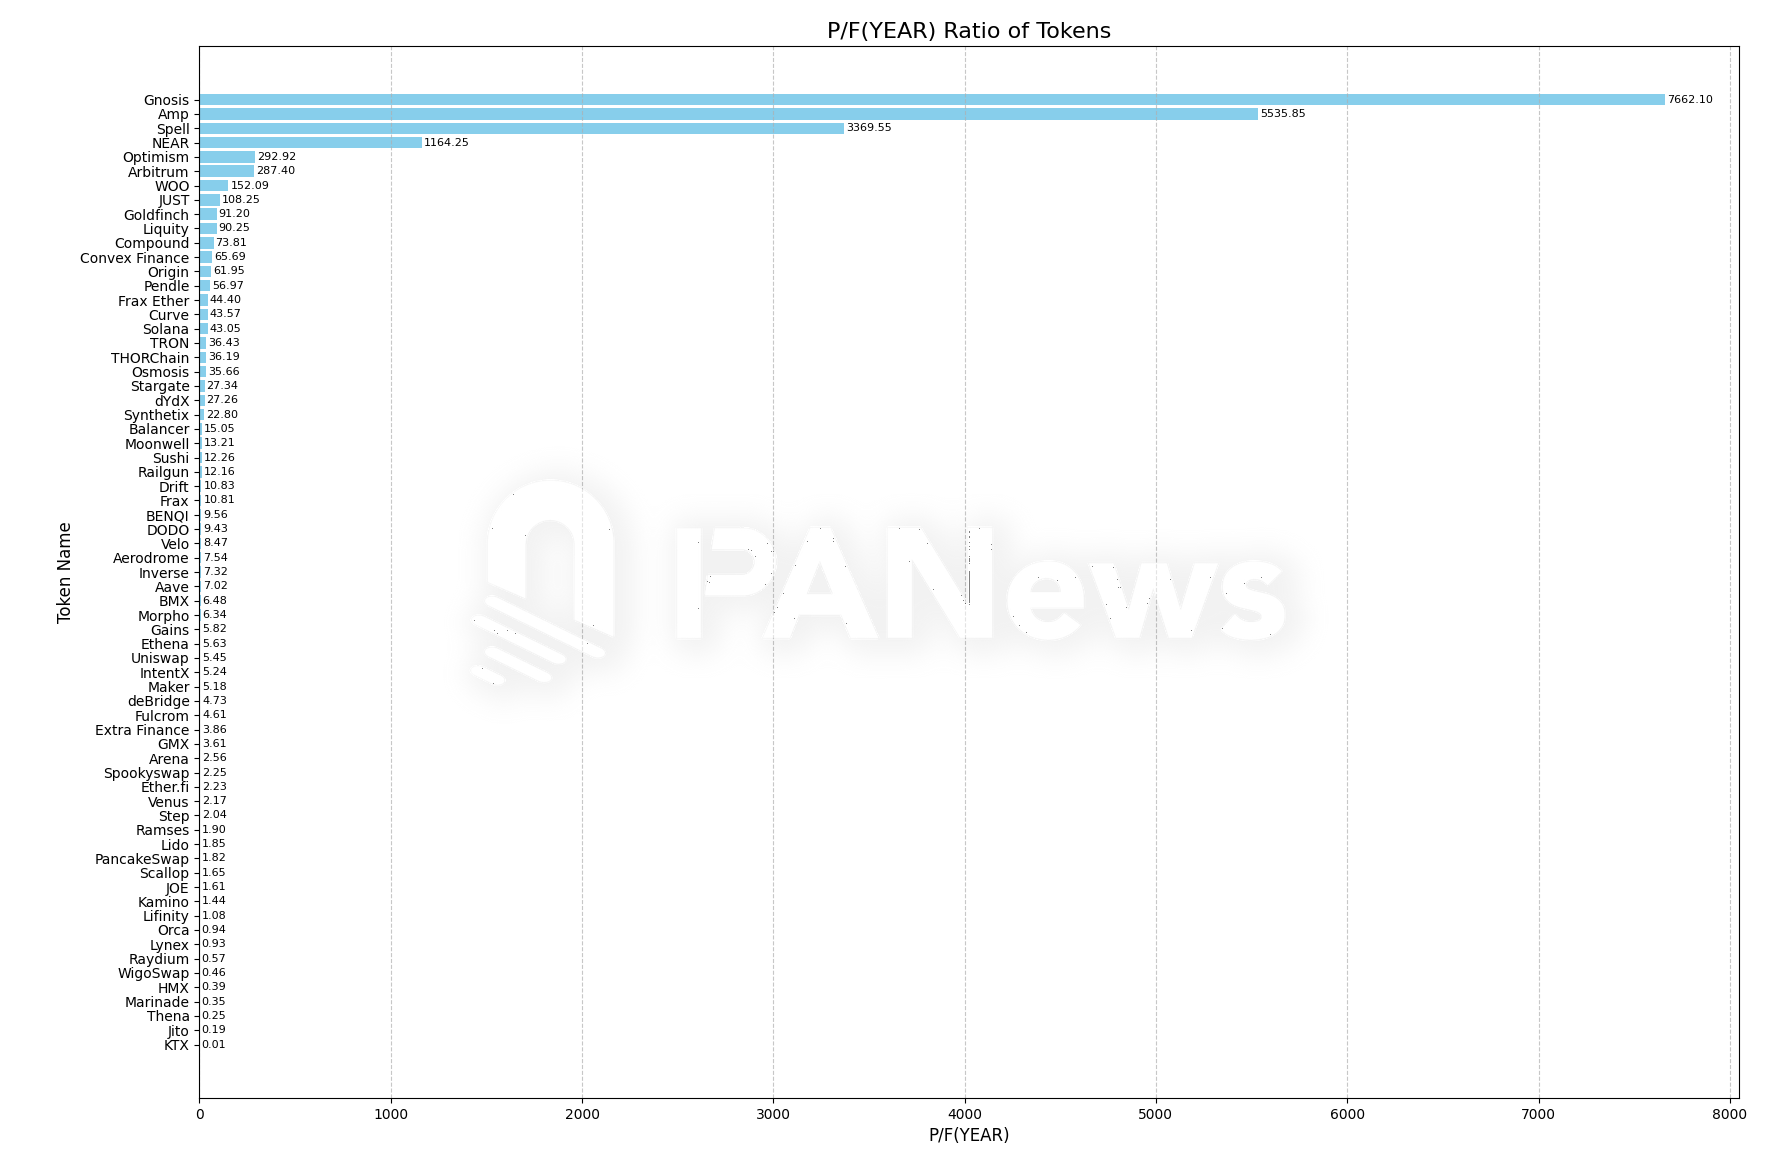
However, one thing to note here is that the high PF value of some projects does not necessarily mean that the valuation is overvalued. Rather, the cost generation mechanism of some projects is very low, especially when considering the PF value of the public chain. This data is usually more meaningful in some tools and decentralized exchanges or lending protocols.

In addition, among the 86 data analyzed, the predicted annual costs of 28 projects exceeded the total costs. This data means that if the current cost level is followed, the costs incurred by these projects in the next year will exceed the sum of past costs. It also shows that the activity and profitability of these projects are gradually increasing. The top ten projects in this data are Raydium, Jito, Solana, Thena, Ethena, Ether.fi, Orca, Aerodrome, Kamino, and KTX. Of course, when examining this data, the launch time of the project should also be considered. For example, for a project like Ether.fi that has been online for less than a year, the predicted annual cost will certainly exceed the total cost.

Analyzing 86 DeFi project data: Finding undervalued investment opportunities

In addition, there is another indicator dimension to consider, which is the ratio between the token trading volume and market value. Generally speaking, if this ratio is greater than 0.1, it means that the market activity and liquidity of the token are good. Among these tokens, a total of 51 projects have a V/P greater than 0.1.

8 projects combined several underestimated indicators

Analyzing 86 DeFi project data: Finding undervalued investment opportunities

After screening in multiple data dimensions (P/TVL less than 1, V/P greater than 0.1, P/F (YEAR) less than 10, and estimated annual costs greater than total costs), a total of 8 projects meet this condition: Raydium, KTX, Inverse, Aerodrome, Jito, Ethena, Morpho, and Ether.fi. However, in the investigation of these projects, further judgment is needed based on the time of coin issuance, the online market, and community activity.

In addition, when judging whether a DeFi project is undervalued, it is often possible to make an estimate by comparing the indicators of some leading projects such as Uniswap and Sushi.

Finally, there are still some additional explanations about the judgment of the underestimation level of DeFi projects. The above data screening method is not absolute. The market performance of a token often depends on situations other than data. Unless the market is rational enough, it is possible to influence the trend completely according to the data model. In addition to the above data, there are many factors to consider, such as user activity, marketing, and project type. (The above analysis is in a sense a figment of the imagination and cannot be used as an investment basis. The market is risky and you need to be cautious when entering the market!)

All the specific data are here for readers' reference.

Disclaimer: The articles reposted on this site are sourced from public platforms and are provided for informational purposes only. They do not necessarily reflect the views of MEXC. All rights remain with the original authors. If you believe any content infringes on third-party rights, please contact [email protected] for removal. MEXC makes no guarantees regarding the accuracy, completeness, or timeliness of the content and is not responsible for any actions taken based on the information provided. The content does not constitute financial, legal, or other professional advice, nor should it be considered a recommendation or endorsement by MEXC.

You May Also Like

Over 60% of crypto press releases linked to high-risk or scam projects: Report

Over 60% of crypto press releases linked to high-risk or scam projects: Report

A data analysis shows crypto press release wires are dominated by scam-linked projects, hype-driven content and low-impact announcements, raising concerns about
Share
Crypto.news2026/02/04 22:02
ArtGis Finance Partners with MetaXR to Expand its DeFi Offerings in the Metaverse

ArtGis Finance Partners with MetaXR to Expand its DeFi Offerings in the Metaverse

By using this collaboration, ArtGis utilizes MetaXR’s infrastructure to widen access to its assets and enable its customers to interact with the metaverse.
Share
Blockchainreporter2025/09/18 00:07
Crucial US Stock Market Update: What Wednesday’s Mixed Close Reveals

Crucial US Stock Market Update: What Wednesday’s Mixed Close Reveals

BitcoinWorld Crucial US Stock Market Update: What Wednesday’s Mixed Close Reveals The financial world often keeps us on our toes, and Wednesday was no exception. Investors watched closely as the US stock market concluded the day with a mixed performance across its major indexes. This snapshot offers a crucial glimpse into current investor sentiment and economic undercurrents, prompting many to ask: what exactly happened? Understanding the Latest US Stock Market Movements On Wednesday, the closing bell brought a varied picture for the US stock market. While some indexes celebrated gains, others registered slight declines, creating a truly mixed bag for investors. The Dow Jones Industrial Average showed resilience, climbing by a notable 0.57%. This positive movement suggests strength in some of the larger, more established companies. Conversely, the S&P 500, a broader benchmark often seen as a barometer for the overall market, experienced a modest dip of 0.1%. The technology-heavy Nasdaq Composite also saw a slight retreat, sliding by 0.33%. This particular index often reflects investor sentiment towards growth stocks and the tech sector. These divergent outcomes highlight the complex dynamics currently at play within the American economy. It’s not simply a matter of “up” or “down” for the entire US stock market; rather, it’s a nuanced landscape where different sectors and company types are responding to unique pressures and opportunities. Why Did the US Stock Market See Mixed Results? When the US stock market delivers a mixed performance, it often points to a tug-of-war between various economic factors. Several elements could have contributed to Wednesday’s varied closings. For instance, positive corporate earnings reports from certain industries might have bolstered the Dow. At the same time, concerns over inflation, interest rate policies by the Federal Reserve, or even global economic uncertainties could have pressured growth stocks, affecting the S&P 500 and Nasdaq. Key considerations often include: Economic Data: Recent reports on employment, manufacturing, or consumer spending can sway market sentiment. Corporate Announcements: Strong or weak earnings forecasts from influential companies can significantly impact their respective sectors. Interest Rate Expectations: The prospect of higher or lower interest rates directly influences borrowing costs for businesses and consumer spending, affecting future profitability. Geopolitical Events: Global tensions or trade policies can introduce uncertainty, causing investors to become more cautious. Understanding these underlying drivers is crucial for anyone trying to make sense of daily market fluctuations in the US stock market. Navigating Volatility in the US Stock Market A mixed close, while not a dramatic downturn, serves as a reminder that market volatility is a constant companion for investors. For those involved in the US stock market, particularly individuals managing their portfolios, these days underscore the importance of a well-thought-out strategy. It’s important not to react impulsively to daily movements. Instead, consider these actionable insights: Diversification: Spreading investments across different sectors and asset classes can help mitigate risk when one area underperforms. Long-Term Perspective: Focusing on long-term financial goals rather than short-term gains can help weather daily market swings. Stay Informed: Keeping abreast of economic news and company fundamentals provides context for market behavior. Consult Experts: Financial advisors can offer personalized guidance based on individual risk tolerance and objectives. Even small movements in major indexes can signal shifts that require attention, guiding future investment decisions within the dynamic US stock market. What’s Next for the US Stock Market? Looking ahead, investors will be keenly watching for further economic indicators and corporate announcements to gauge the direction of the US stock market. Upcoming inflation data, statements from the Federal Reserve, and quarterly earnings reports will likely provide more clarity. The interplay of these factors will continue to shape investor confidence and, consequently, the performance of the Dow, S&P 500, and Nasdaq. Remaining informed and adaptive will be key to understanding the market’s trajectory. Conclusion: Wednesday’s mixed close in the US stock market highlights the intricate balance of forces influencing financial markets. While the Dow showed strength, the S&P 500 and Nasdaq experienced slight declines, reflecting a nuanced economic landscape. This reminds us that understanding the ‘why’ behind these movements is as important as the movements themselves. As always, a thoughtful, informed approach remains the best strategy for navigating the complexities of the market. Frequently Asked Questions (FAQs) Q1: What does a “mixed close” mean for the US stock market? A1: A mixed close indicates that while some major stock indexes advanced, others declined. It suggests that different sectors or types of companies within the US stock market are experiencing varying influences, rather than a uniform market movement. Q2: Which major indexes were affected on Wednesday? A2: On Wednesday, the Dow Jones Industrial Average gained 0.57%, while the S&P 500 edged down 0.1%, and the Nasdaq Composite slid 0.33%, illustrating the mixed performance across the US stock market. Q3: What factors contribute to a mixed stock market performance? A3: Mixed performances in the US stock market can be influenced by various factors, including specific corporate earnings, economic data releases, shifts in interest rate expectations, and broader geopolitical events that affect different market segments uniquely. Q4: How should investors react to mixed market signals? A4: Investors are generally advised to maintain a long-term perspective, diversify their portfolios, stay informed about economic news, and avoid impulsive decisions. Consulting a financial advisor can also provide personalized guidance for navigating the US stock market. Q5: What indicators should investors watch for future US stock market trends? A5: Key indicators to watch include upcoming inflation reports, statements from the Federal Reserve regarding monetary policy, and quarterly corporate earnings reports. These will offer insights into the future direction of the US stock market. Did you find this analysis of the US stock market helpful? Share this article with your network on social media to help others understand the nuances of current financial trends! To learn more about the latest stock market trends, explore our article on key developments shaping the US stock market‘s future performance. This post Crucial US Stock Market Update: What Wednesday’s Mixed Close Reveals first appeared on BitcoinWorld.
Share
Coinstats2025/09/18 05:30