Comparison dimensions include business model, revenue, token quantity growth, etc.Comparison dimensions include business model, revenue, token quantity growth, etc.

Comparative Analysis: What are the differences between MEME launch platform Clanker and Pump.fun?

2024/11/29 20:06
2 min read

Author: Poopman , Cryptography Researcher

Compiled by: Felix, PANews

Recently, many well-known meme coins have emerged on the Base ecosystem meme coin issuance platform Clanker, including CLANKER, ANON, etc. Crypto researcher Poopman published an article comparing Clanker and Pump.fun in multiple dimensions such as business models. The following is the content details.

Comparative Analysis: What are the differences between MEME launch platform Clanker and Pump.fun?

1 ) Business Model

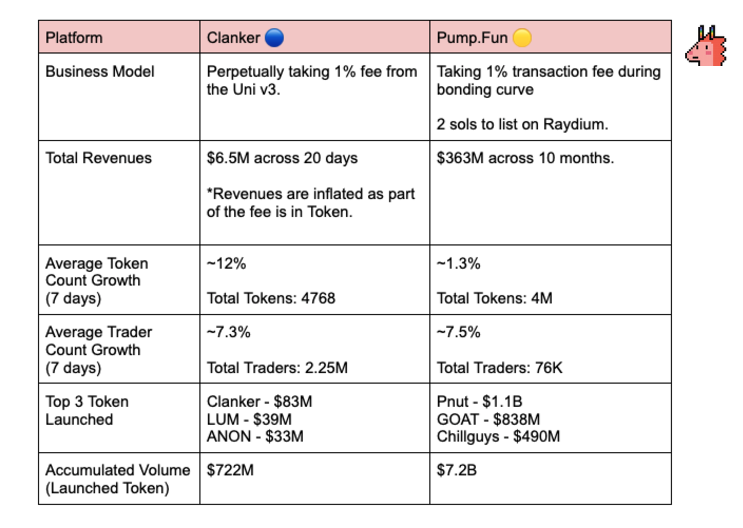
PumpFun: A 1% transaction fee + 2 SOLs are charged during the Bonding Curves (a process that uses smart contracts and mathematical formulas to dynamically adjust the price of tokens based on the supply of tokens) to be listed on Raydium.

Clanker: Since there is no bonding curve, use the #LpFeesCut function and collect 1% fees from Uni v3 forever.

New upgrade: 0.4% of fees are returned to issuers, providing more incentives for issuing tokens.

2 ) Total income

PumpFun: $363 million in 10 months. Currently 55 times that of Clanker.

Clanker: $6-7 million in revenue in 20 days. Revenue is inflated because part of the fees are in tokens.

3 ) Token quantity growth ( 7 days)

PumpFun: 4 million tokens, daily growth of about 1.3%

Clanker: 4768 tokens to date, with a daily growth of about 12%

4 ) Top 3 tokens issued

PumpFun:

  • Pnut: $1.1 billion
  • GOAT: $838 million
  • Chillguys: $490 million

Clanker:

  • Clanker: $83 million
  • LUM: $39 million
  • ANON: $33 million

Some key points:

Although Clanker has successfully channeled a large amount of Base volume, it has yet to show any signals in Farcaster’s favor.

Early robot sniping seemed to be a problem, but there was no clear/accurate data on its toxicity.

Farcaster’s limited user base may hinder the growth of the token number. However, this design can provide strategic value to Base and Farcaster.

The continuous increase in the types of assets on Base is the key to unlocking the "real" Base Season.

Related reading: Clanker recasts the glory of Ethereum ecosystem Meme? Analysis of AI Agent coin issuance application on Base chain

Market Opportunity
Sport.Fun Logo
Sport.Fun Price(FUN)
$0.03106
$0.03106$0.03106
-7.83%
USD
Sport.Fun (FUN) Live Price Chart
Disclaimer: The articles reposted on this site are sourced from public platforms and are provided for informational purposes only. They do not necessarily reflect the views of MEXC. All rights remain with the original authors. If you believe any content infringes on third-party rights, please contact [email protected] for removal. MEXC makes no guarantees regarding the accuracy, completeness, or timeliness of the content and is not responsible for any actions taken based on the information provided. The content does not constitute financial, legal, or other professional advice, nor should it be considered a recommendation or endorsement by MEXC.
Tags:

You May Also Like

Microsoft Corp. $MSFT blue box area offers a buying opportunity

Microsoft Corp. $MSFT blue box area offers a buying opportunity

The post Microsoft Corp. $MSFT blue box area offers a buying opportunity appeared on BitcoinEthereumNews.com. In today’s article, we’ll examine the recent performance of Microsoft Corp. ($MSFT) through the lens of Elliott Wave Theory. We’ll review how the rally from the April 07, 2025 low unfolded as a 5-wave impulse followed by a 3-swing correction (ABC) and discuss our forecast for the next move. Let’s dive into the structure and expectations for this stock. Five wave impulse structure + ABC + WXY correction $MSFT 8H Elliott Wave chart 9.04.2025 In the 8-hour Elliott Wave count from Sep 04, 2025, we saw that $MSFT completed a 5-wave impulsive cycle at red III. As expected, this initial wave prompted a pullback. We anticipated this pullback to unfold in 3 swings and find buyers in the equal legs area between $497.02 and $471.06 This setup aligns with a typical Elliott Wave correction pattern (ABC), in which the market pauses briefly before resuming its primary trend. $MSFT 8H Elliott Wave chart 7.14.2025 The update, 10 days later, shows the stock finding support from the equal legs area as predicted allowing traders to get risk free. The stock is expected to bounce towards 525 – 532 before deciding if the bounce is a connector or the next leg higher. A break into new ATHs will confirm the latter and can see it trade higher towards 570 – 593 area. Until then, traders should get risk free and protect their capital in case of a WXY double correction. Conclusion In conclusion, our Elliott Wave analysis of Microsoft Corp. ($MSFT) suggested that it remains supported against April 07, 2025 lows and bounce from the blue box area. In the meantime, keep an eye out for any corrective pullbacks that may offer entry opportunities. By applying Elliott Wave Theory, traders can better anticipate the structure of upcoming moves and enhance risk management in volatile markets. Source: https://www.fxstreet.com/news/microsoft-corp-msft-blue-box-area-offers-a-buying-opportunity-202509171323
Share
BitcoinEthereumNews2025/09/18 03:50
Marathon Digital BTC Transfers Highlight Miner Stress

Marathon Digital BTC Transfers Highlight Miner Stress

The post Marathon Digital BTC Transfers Highlight Miner Stress appeared on BitcoinEthereumNews.com. In a tense week for crypto markets, marathon digital has drawn
Share
BitcoinEthereumNews2026/02/06 15:16
Fintech in a Fragmented World: Building Financial Products Across Geopolitical Lines

Fintech in a Fragmented World: Building Financial Products Across Geopolitical Lines

For most of the last ten years, the fintech growth story was one without borders. Startups made digital wallets, payment platforms, lending systems, and trading
Share
Globalfintechseries2026/02/06 15:17