Is this round of small explosion in MEME market a return of MEME bull market or a return of hot money in a boring market? PANews conducted a data analysis on several large addresses of MEME coins with large recent gains.Is this round of small explosion in MEME market a return of MEME bull market or a return of hot money in a boring market? PANews conducted a data analysis on several large addresses of MEME coins with large recent gains.

Local frenzy or full recovery? Data analysis of Solana chain MEME whale movements and market differentiation

2025/04/16 11:49
8 min read

Author: Frank, PANews

The MEME market seems to be heating up again. Since mid-March, Fartcoin has bottomed out and rebounded, rising by about 349% in about a month, with the total market value reaching nearly $985 million. At the same time, the actions of MEME whales on the chain have also attracted attention. Some whales have spent millions of dollars on Fartcoin, RFC and other MEME coins, causing the market value of related tokens to rise rapidly.

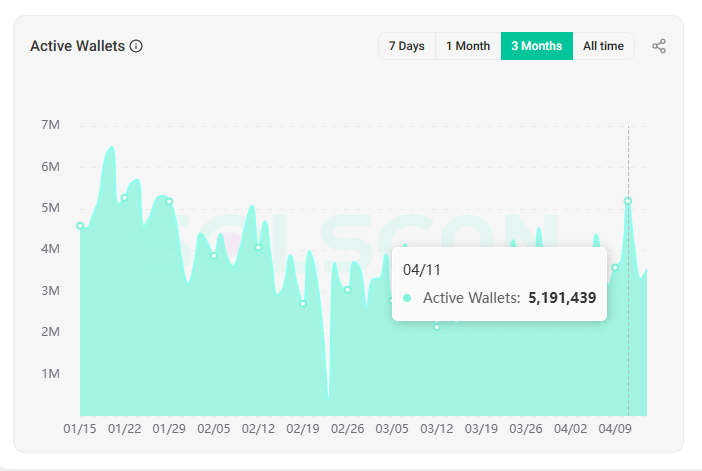
Behind these changes, on April 11, the number of active addresses on the Solana chain once again exceeded 5.1 million, approaching the peak level in January.

Local frenzy or full recovery? Data analysis of Solana chain MEME whale movements and market differentiation

Is this round of small explosion in MEME market a return of MEME bull market or a return of hot money in a boring market? PANews conducted a data analysis on several large addresses of MEME coins with large recent gains, hoping to find clues.

Fartcoin analysis: Whales entered the market in mid-March, with an average cost of about $0.62

First, after observing several tokens with high market value before, PANews found that this round of MEME craze is not universal, but concentrated in several specific tokens. Most MEMEs with market value of over 100 million before (such as Trump, BONK, WIF, POPCAT) are still in the stage of decline or bottom oscillation. Among the tokens counted by PANews, except Fartcoin, the other tokens are either new coins born in the past 1~2 months, or tokens that have been tepid since their issuance. The following are several tokens observed by PANews: RFC, Fartcoin, ALCH, GOHOME, DARK, House, FAT.

Local frenzy or full recovery? Data analysis of Solana chain MEME whale movements and market differentiation

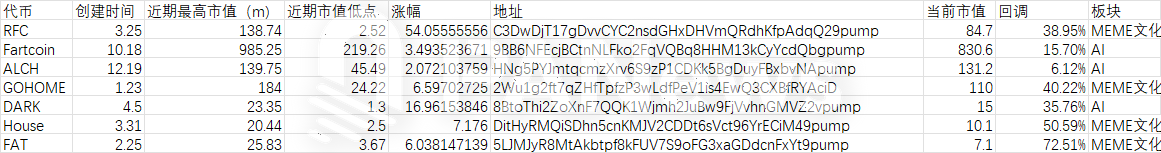
The token screening rule is that the market value is between 10 million and 100 million US dollars, and the tokens have seen a large increase or rebound in the market in the past 1 to 3 months. Among them, RFC, which has been very popular recently, has the largest increase, with the largest increase in the past month reaching 54 times.

The leading token in this round is Fartcoin. After hitting the bottom on March 10, Fartcoin started a new round of upward trend. Its market value once reached 948 million US dollars, making it the leader of MEME again.

From the analysis of the initial purchase time of large investors, it can be found that this round of large investors collectively entered the market from mid-March. It continued until April 10, and the entry of large investors maintained an upward trend. Local frenzy or full recovery? Data analysis of Solana chain MEME whale movements and market differentiation

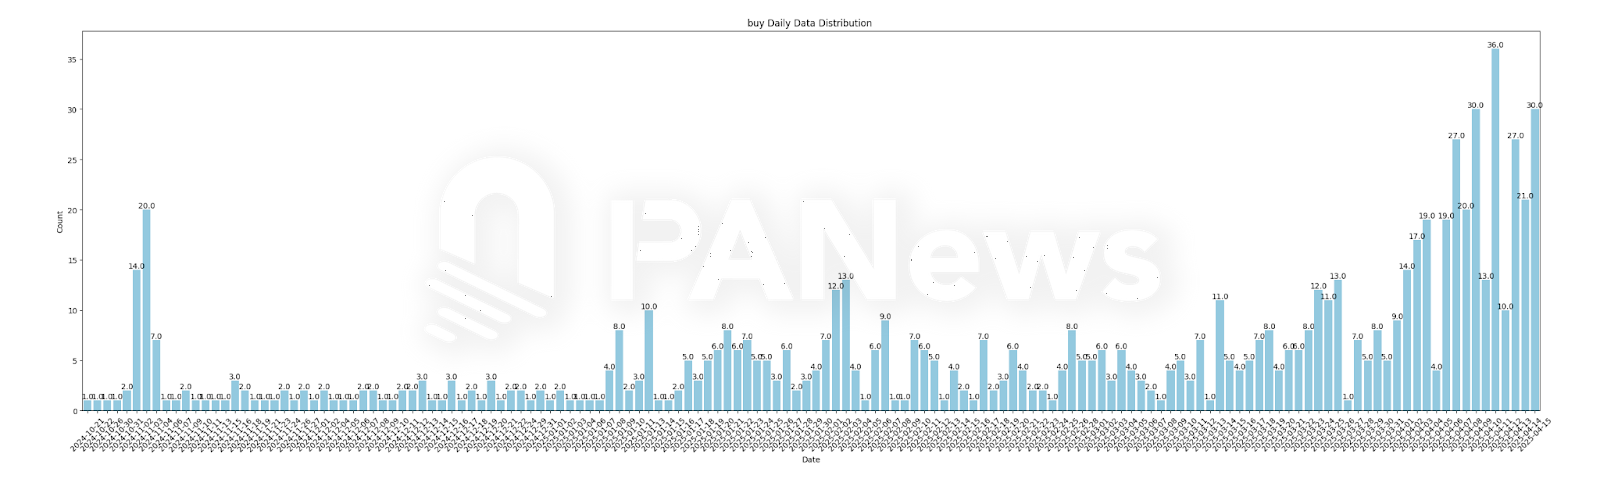
Fartcoin big players’ entry time distribution

From the cost point of view, the initial purchase costs of the top 1,000 large holders are basically concentrated between 0.2~0.6 USD and 0.6~0.9 USD. Combined with the Fartcoin chart, the proportion of large holders who are still stuck at more than 1 USD is relatively small. And from a comprehensive analysis, the current large holders basically entered the market after the price low on March 12.

Local frenzy or full recovery? Data analysis of Solana chain MEME whale movements and market differentiation

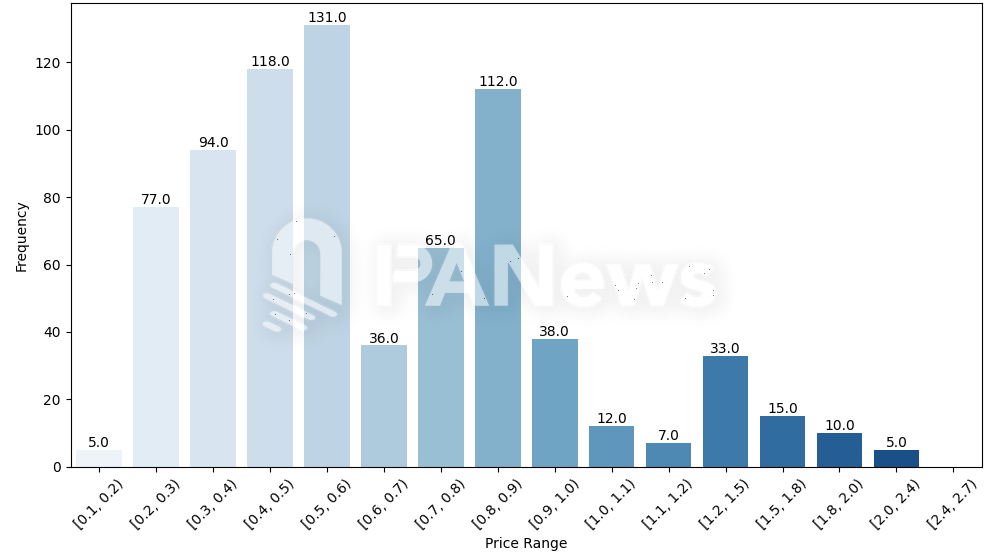
Fartcoin large holders' holding cost distribution

In general, the initial purchase cost of Fartcoin by major holders is about $0.62. Based on the current price of $0.844, these new major holders have an average profit margin of about 36%.

23% of addresses have cross-holdings, DARK and RFC have repeated the same script

Overall, by comparing the top 1,000 holders of these tokens, it was found that 23% of the addresses of the holders held at least two or more tokens. Among them, the token that the holders held the most was DARK, which was created the shortest time, but 116 holders held this token repeatedly.

Local frenzy or full recovery? Data analysis of Solana chain MEME whale movements and market differentiation

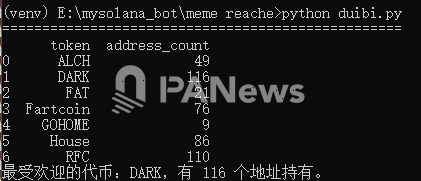
Secondly, RFC has the highest number of repetitions, reaching 110 times. Fartcoin has received a lot of market attention recently, and its market value is also the highest among the analyzed tokens, but it has only 76 repetitions. However, according to PANews analysis, the reason for this may be that the market value of Fartcoin has risen to a relatively high level, and many large holders have withdrawn or changed positions. Since it is impossible to track the historical information of large holders at a specific time, we are currently unable to come up with a clear answer.

However, judging from the analysis of RFC and DARK, the two tokens seem to have similar scripts.

Local frenzy or full recovery? Data analysis of Solana chain MEME whale movements and market differentiation

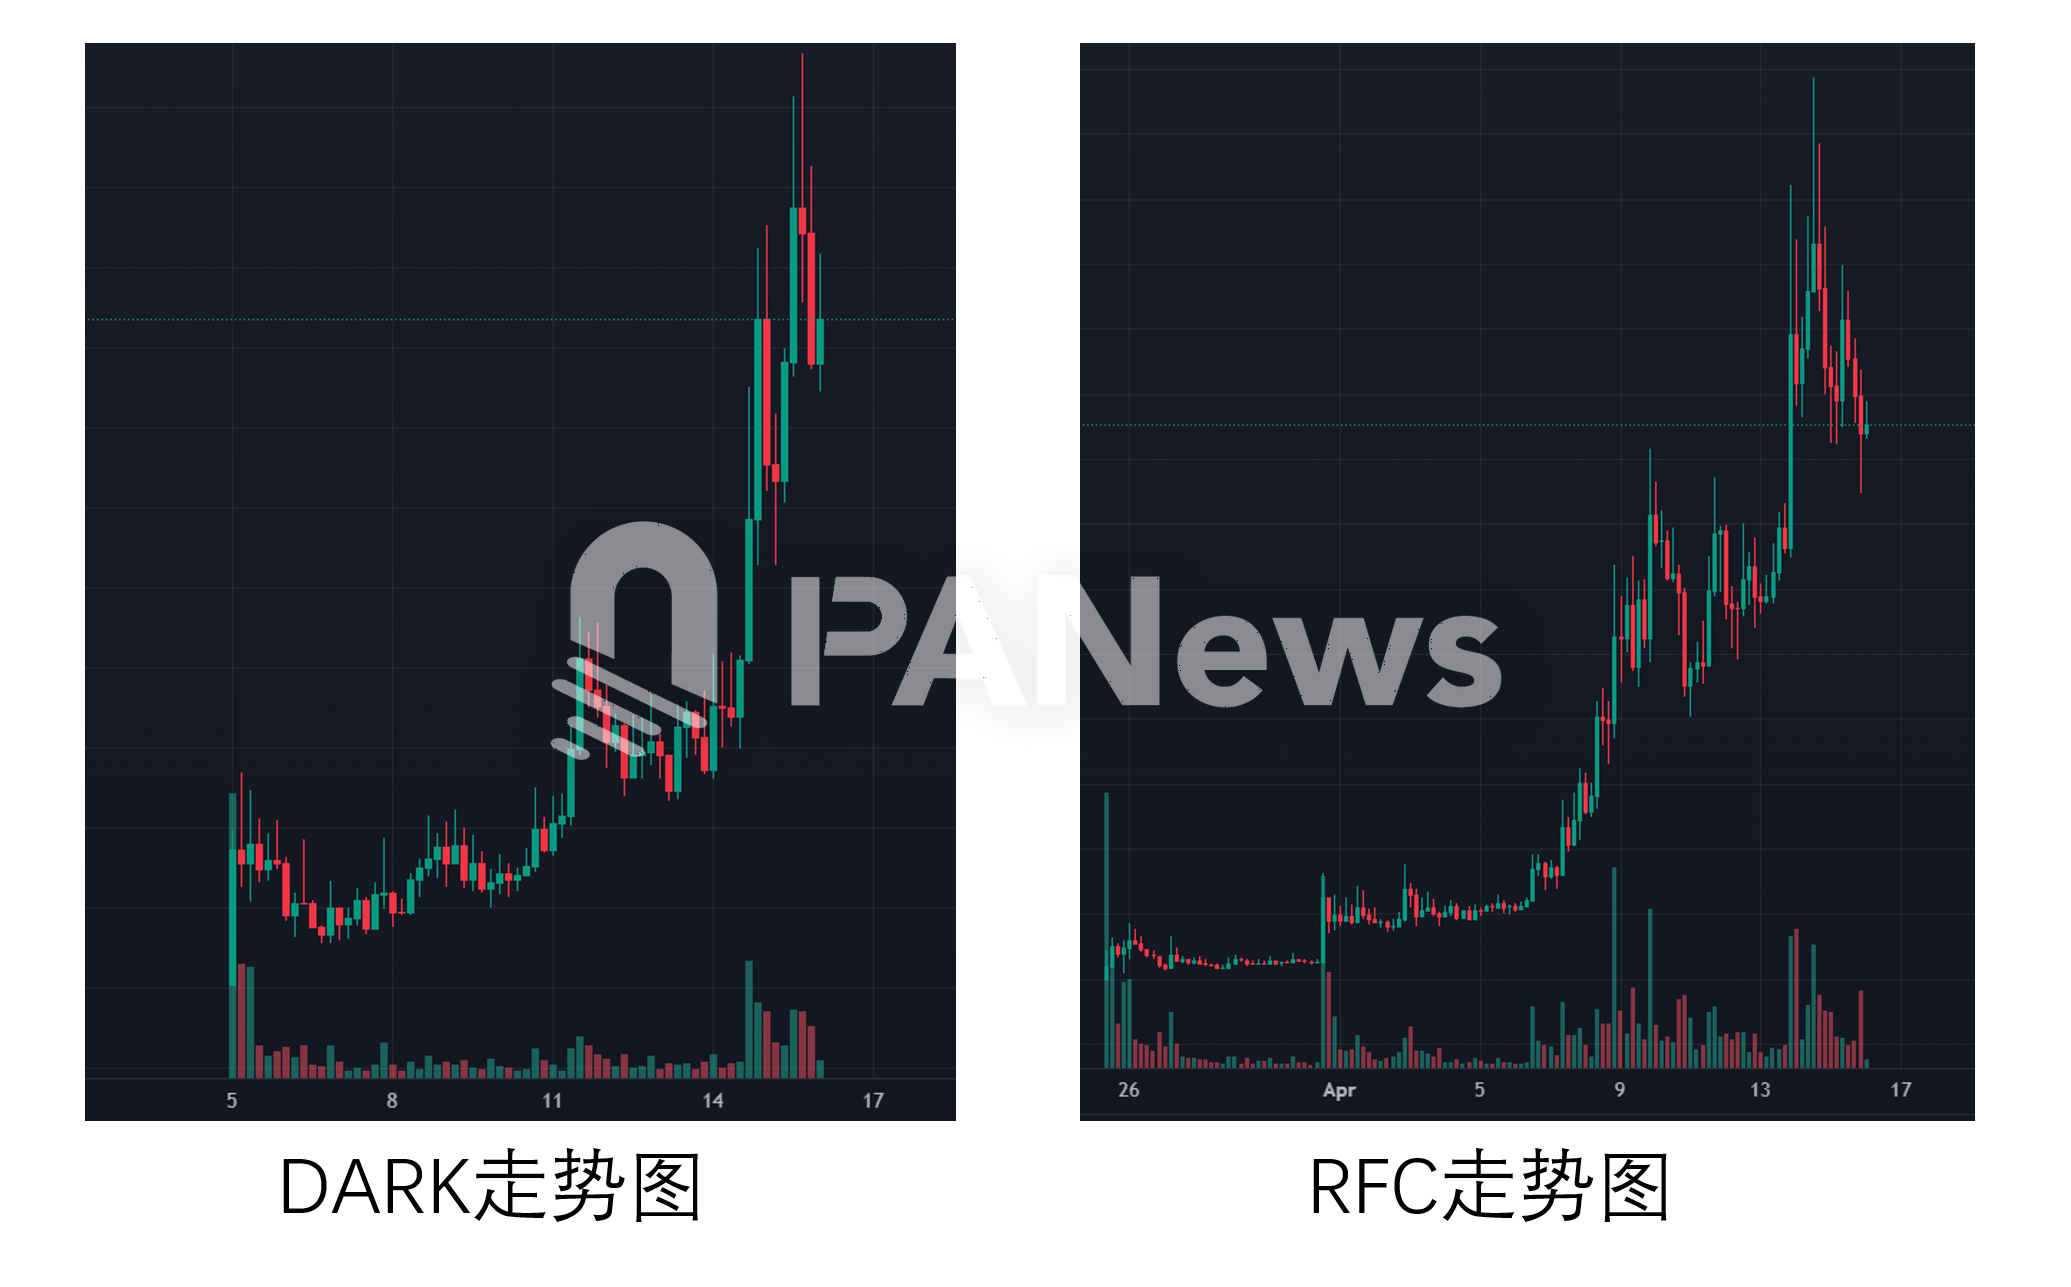
First of all, in terms of the K-line chart trends of the two, except for the different creation time, other trends including callback patterns tend to be similar.

In addition, the data of repeated holdings of these two tokens by major holders are also relatively close, both above 110. In a more detailed analysis, PANews found that 75 addresses hold both DARK and RFC tokens, which is the largest number among the major holders. The second largest number is the Fartcoin and House combination, with 35 addresses holding both tokens.

Further analysis of the purchase timing of these addresses holding both RFC and DARK shows that most of the large addresses first bought these two tokens on April 13 and April 14.

From the K-line trend, April 13 was the day when RFC rose rapidly, with an increase of 65% and an amplitude of 107% on that day. On April 14, DARK ushered in a similar market, with an increase of 80% and an amplitude of 218% on that day. This sharp rise in the front and back feet seems to be a move by the main force to change vehicles and raise prices.

Local frenzy or full recovery? Data analysis of Solana chain MEME whale movements and market differentiation

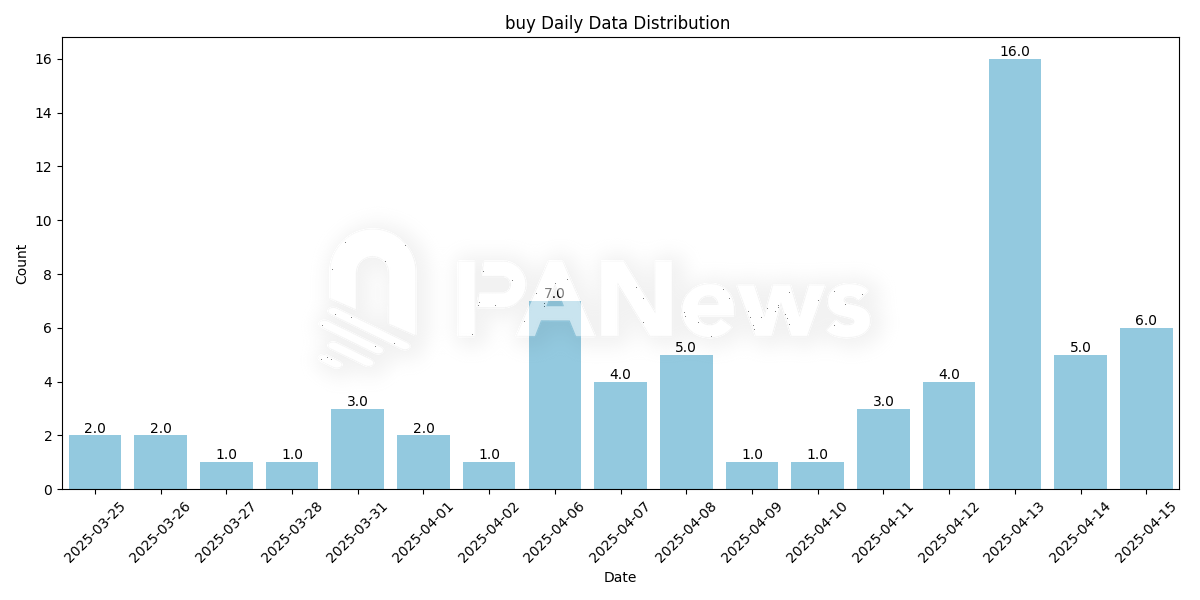
Date of the first major purchase distribution of RFC

Local frenzy or full recovery? Data analysis of Solana chain MEME whale movements and market differentiation

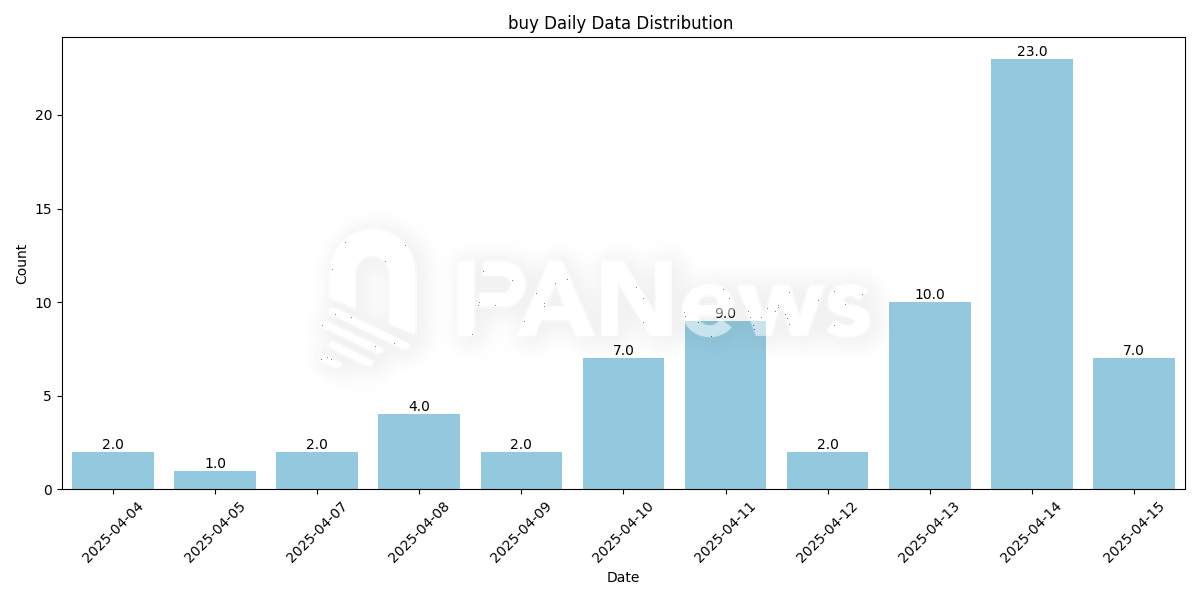
DARK’s main initial purchase distribution date

Of course, it should be noted that the market value of RFC has reached a maximum of 138 million US dollars, while the maximum market value of DARK is only 23 million US dollars. It seems that the big players behind this are not the absolute dominant force in the market, or the main players have different expectations for the two tokens. Therefore, it cannot be assumed that DARK can replicate the market value scale of RFC.

In addition, Fartcoin, House, DARK, House and other token combinations also appear many times in the holdings of large investors.

“Artificial Cow” Loves MEME Culture and AI

In the overall data, the total holding amount of these large holders with repeated holdings in these 7 tokens is about 100 million US dollars (excluding the holdings of several major exchanges such as Gate, Bitget, Raydium, etc.), accounting for 8.47% of the market value of these tokens.

As of the early morning of April 16, these tokens have generally experienced a certain correction. Among them, FAT has pulled back 72.51% from its high point, House has pulled back 50%, and the overall average pullback is 37.12%. Among them, only ALCH has a smaller pullback. From the nature of this project, it is the only AI-related token with practical applications. However, from a cyclical perspective, ALCH may just be in the stage of market rotation and has not yet entered the selling cycle.

Behind this round of MEME rise, there seem to be some traces of an artificial MEME bull market. KOL @MasonCanoe said on Twitter that the whale address of the RFC rise is related to the addresses of TRUMP, VIRTUAL, LIBRA and other tokens that have market-making behaviors before, and is also related to several addresses that have been ambushing on RFC for a long time. Based on this, @MasonCanoe believes that the rise of RFC is by no means accidental, and it may be a signal of the careful layout of the big funds behind it.

Judging from the performance of the data, MEME on the Solana chain does seem to be attracting market attention again under the impetus of some whales. However, since this pull effect does not benefit all MEME tokens, the trend can only be determined by tracking the real-time dynamics of these major funds. In addition, judging from the classification of several tokens, cat, dog, and frog-themed tokens do not seem to have occupied a place in the recent rise, while AI and MEME cultural tokens have performed well.

In general, the recent MEME craze on the Solana chain is not widespread, but highly concentrated on a few specific tokens, among which Fartcoin, as the leader, has attracted a large number of new large investors who entered the market after mid-March. What is more noteworthy is that behind the two tokens RFC and DARK, which have highly similar trends, there are a large number of overlapping large addresses, and their main buying time is concentrated on April 13 and 14, when the two tokens rose sharply one after the other. This strongly suggests possible coordinated operations or major rotation behaviors. This round of rise does not seem to be a purely spontaneous market behavior, but bears traces of an "artificial bull market", and whether this "artificial rainfall" can evolve into a natural influx of funds remains to be seen.

Disclaimer: The articles reposted on this site are sourced from public platforms and are provided for informational purposes only. They do not necessarily reflect the views of MEXC. All rights remain with the original authors. If you believe any content infringes on third-party rights, please contact [email protected] for removal. MEXC makes no guarantees regarding the accuracy, completeness, or timeliness of the content and is not responsible for any actions taken based on the information provided. The content does not constitute financial, legal, or other professional advice, nor should it be considered a recommendation or endorsement by MEXC.

You May Also Like

Over 60% of crypto press releases linked to high-risk or scam projects: Report

Over 60% of crypto press releases linked to high-risk or scam projects: Report

A data analysis shows crypto press release wires are dominated by scam-linked projects, hype-driven content and low-impact announcements, raising concerns about
Share
Crypto.news2026/02/04 22:02
ArtGis Finance Partners with MetaXR to Expand its DeFi Offerings in the Metaverse

ArtGis Finance Partners with MetaXR to Expand its DeFi Offerings in the Metaverse

By using this collaboration, ArtGis utilizes MetaXR’s infrastructure to widen access to its assets and enable its customers to interact with the metaverse.
Share
Blockchainreporter2025/09/18 00:07
Crucial US Stock Market Update: What Wednesday’s Mixed Close Reveals

Crucial US Stock Market Update: What Wednesday’s Mixed Close Reveals

BitcoinWorld Crucial US Stock Market Update: What Wednesday’s Mixed Close Reveals The financial world often keeps us on our toes, and Wednesday was no exception. Investors watched closely as the US stock market concluded the day with a mixed performance across its major indexes. This snapshot offers a crucial glimpse into current investor sentiment and economic undercurrents, prompting many to ask: what exactly happened? Understanding the Latest US Stock Market Movements On Wednesday, the closing bell brought a varied picture for the US stock market. While some indexes celebrated gains, others registered slight declines, creating a truly mixed bag for investors. The Dow Jones Industrial Average showed resilience, climbing by a notable 0.57%. This positive movement suggests strength in some of the larger, more established companies. Conversely, the S&P 500, a broader benchmark often seen as a barometer for the overall market, experienced a modest dip of 0.1%. The technology-heavy Nasdaq Composite also saw a slight retreat, sliding by 0.33%. This particular index often reflects investor sentiment towards growth stocks and the tech sector. These divergent outcomes highlight the complex dynamics currently at play within the American economy. It’s not simply a matter of “up” or “down” for the entire US stock market; rather, it’s a nuanced landscape where different sectors and company types are responding to unique pressures and opportunities. Why Did the US Stock Market See Mixed Results? When the US stock market delivers a mixed performance, it often points to a tug-of-war between various economic factors. Several elements could have contributed to Wednesday’s varied closings. For instance, positive corporate earnings reports from certain industries might have bolstered the Dow. At the same time, concerns over inflation, interest rate policies by the Federal Reserve, or even global economic uncertainties could have pressured growth stocks, affecting the S&P 500 and Nasdaq. Key considerations often include: Economic Data: Recent reports on employment, manufacturing, or consumer spending can sway market sentiment. Corporate Announcements: Strong or weak earnings forecasts from influential companies can significantly impact their respective sectors. Interest Rate Expectations: The prospect of higher or lower interest rates directly influences borrowing costs for businesses and consumer spending, affecting future profitability. Geopolitical Events: Global tensions or trade policies can introduce uncertainty, causing investors to become more cautious. Understanding these underlying drivers is crucial for anyone trying to make sense of daily market fluctuations in the US stock market. Navigating Volatility in the US Stock Market A mixed close, while not a dramatic downturn, serves as a reminder that market volatility is a constant companion for investors. For those involved in the US stock market, particularly individuals managing their portfolios, these days underscore the importance of a well-thought-out strategy. It’s important not to react impulsively to daily movements. Instead, consider these actionable insights: Diversification: Spreading investments across different sectors and asset classes can help mitigate risk when one area underperforms. Long-Term Perspective: Focusing on long-term financial goals rather than short-term gains can help weather daily market swings. Stay Informed: Keeping abreast of economic news and company fundamentals provides context for market behavior. Consult Experts: Financial advisors can offer personalized guidance based on individual risk tolerance and objectives. Even small movements in major indexes can signal shifts that require attention, guiding future investment decisions within the dynamic US stock market. What’s Next for the US Stock Market? Looking ahead, investors will be keenly watching for further economic indicators and corporate announcements to gauge the direction of the US stock market. Upcoming inflation data, statements from the Federal Reserve, and quarterly earnings reports will likely provide more clarity. The interplay of these factors will continue to shape investor confidence and, consequently, the performance of the Dow, S&P 500, and Nasdaq. Remaining informed and adaptive will be key to understanding the market’s trajectory. Conclusion: Wednesday’s mixed close in the US stock market highlights the intricate balance of forces influencing financial markets. While the Dow showed strength, the S&P 500 and Nasdaq experienced slight declines, reflecting a nuanced economic landscape. This reminds us that understanding the ‘why’ behind these movements is as important as the movements themselves. As always, a thoughtful, informed approach remains the best strategy for navigating the complexities of the market. Frequently Asked Questions (FAQs) Q1: What does a “mixed close” mean for the US stock market? A1: A mixed close indicates that while some major stock indexes advanced, others declined. It suggests that different sectors or types of companies within the US stock market are experiencing varying influences, rather than a uniform market movement. Q2: Which major indexes were affected on Wednesday? A2: On Wednesday, the Dow Jones Industrial Average gained 0.57%, while the S&P 500 edged down 0.1%, and the Nasdaq Composite slid 0.33%, illustrating the mixed performance across the US stock market. Q3: What factors contribute to a mixed stock market performance? A3: Mixed performances in the US stock market can be influenced by various factors, including specific corporate earnings, economic data releases, shifts in interest rate expectations, and broader geopolitical events that affect different market segments uniquely. Q4: How should investors react to mixed market signals? A4: Investors are generally advised to maintain a long-term perspective, diversify their portfolios, stay informed about economic news, and avoid impulsive decisions. Consulting a financial advisor can also provide personalized guidance for navigating the US stock market. Q5: What indicators should investors watch for future US stock market trends? A5: Key indicators to watch include upcoming inflation reports, statements from the Federal Reserve regarding monetary policy, and quarterly corporate earnings reports. These will offer insights into the future direction of the US stock market. Did you find this analysis of the US stock market helpful? Share this article with your network on social media to help others understand the nuances of current financial trends! To learn more about the latest stock market trends, explore our article on key developments shaping the US stock market‘s future performance. This post Crucial US Stock Market Update: What Wednesday’s Mixed Close Reveals first appeared on BitcoinWorld.
Share
Coinstats2025/09/18 05:30