

Bitcoin interest index rankings of countries around the world: 7 of the top 10 are European countries
By Bitcoin Magazine
Compiled by: Felix, PANews
The Bitcoin Popularity Index (BPI) is the first comprehensive search study of its kind. The index seeks to measure Bitcoin’s global influence through extensive analysis of Google search queries.
Unlike many studies that provide absolute data or individual dimensions for multiple coins, the BPI data provides specific insights into interest in Bitcoin by taking into account factors such as language diversity, Google Chrome dominance, and population size. This approach not only measures the raw interest in Bitcoin in different countries, but also measures the level of participation in Bitcoin in different countries.
While the BPI is not designed to give definitive answers, by integrating these different elements it provides a unique perspective that moves away from generic metrics to provide a richer, more contextual understanding of Bitcoin adoption around the world.
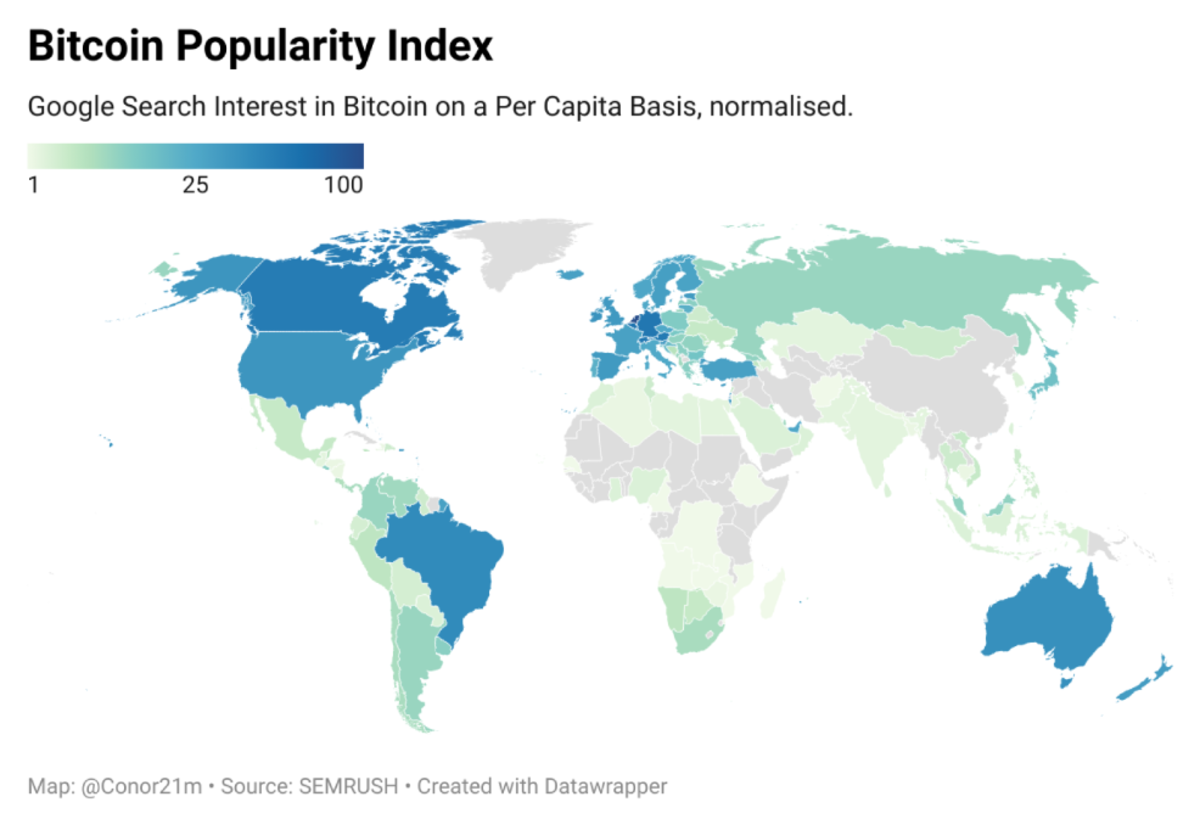
Bitcoin Popularity Index 2024
Key findings
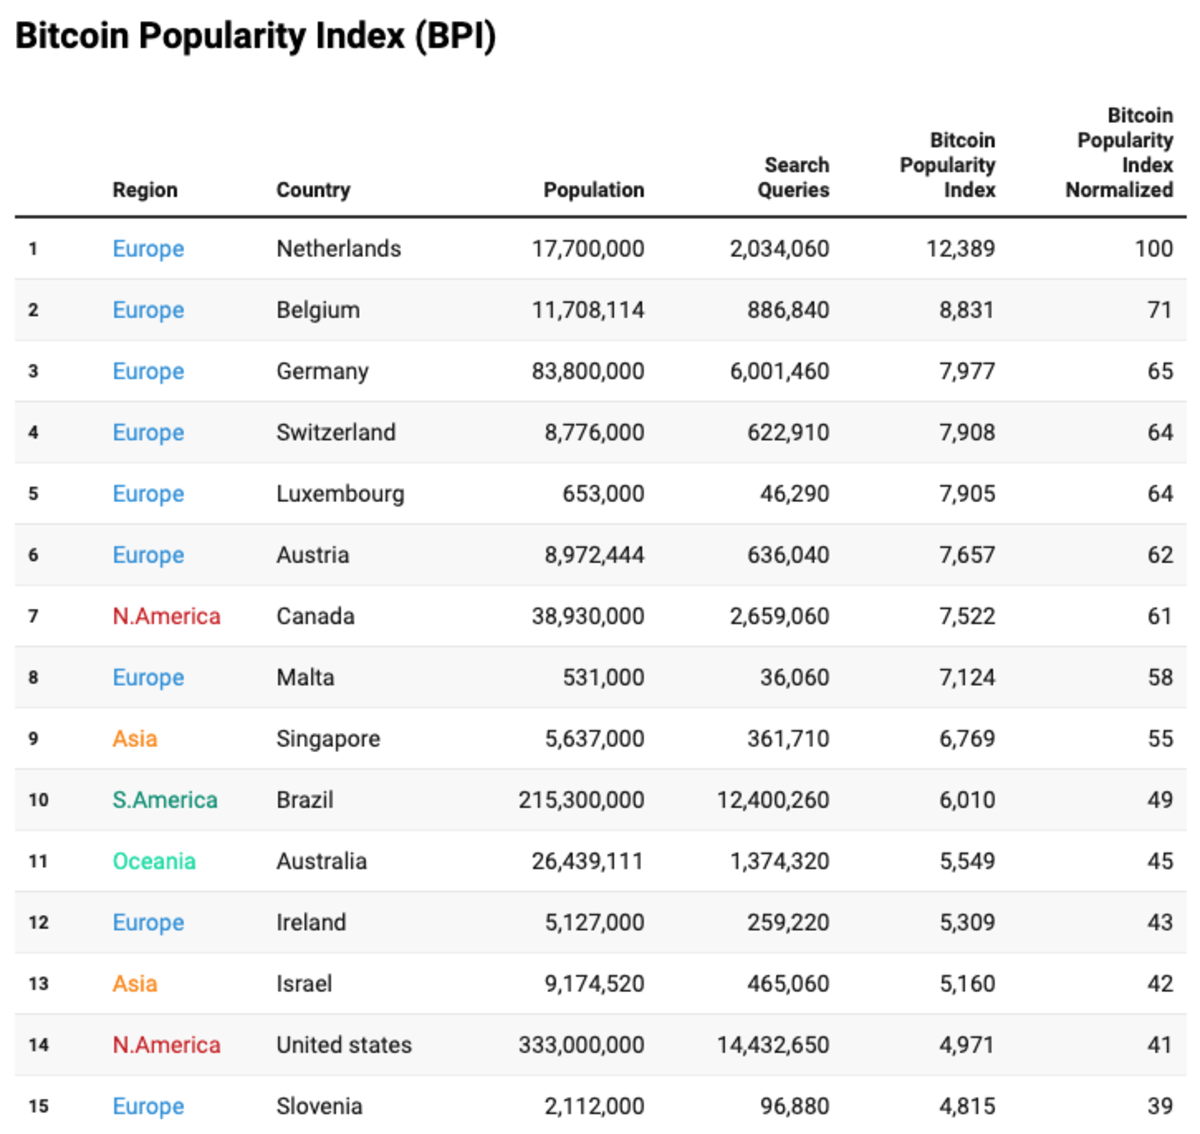
- The United States had the most monthly queries at 14,432,650, followed by Brazil at 12,400,260. Germany, India and Turkey rounded out the top five.
- The top seven spots and eight of the top ten are occupied by Western European countries.
- The average BPI for “Western” countries around the world is around 3,720 (1,250 for other regions), indicating that Bitcoin’s popularity is relatively high.
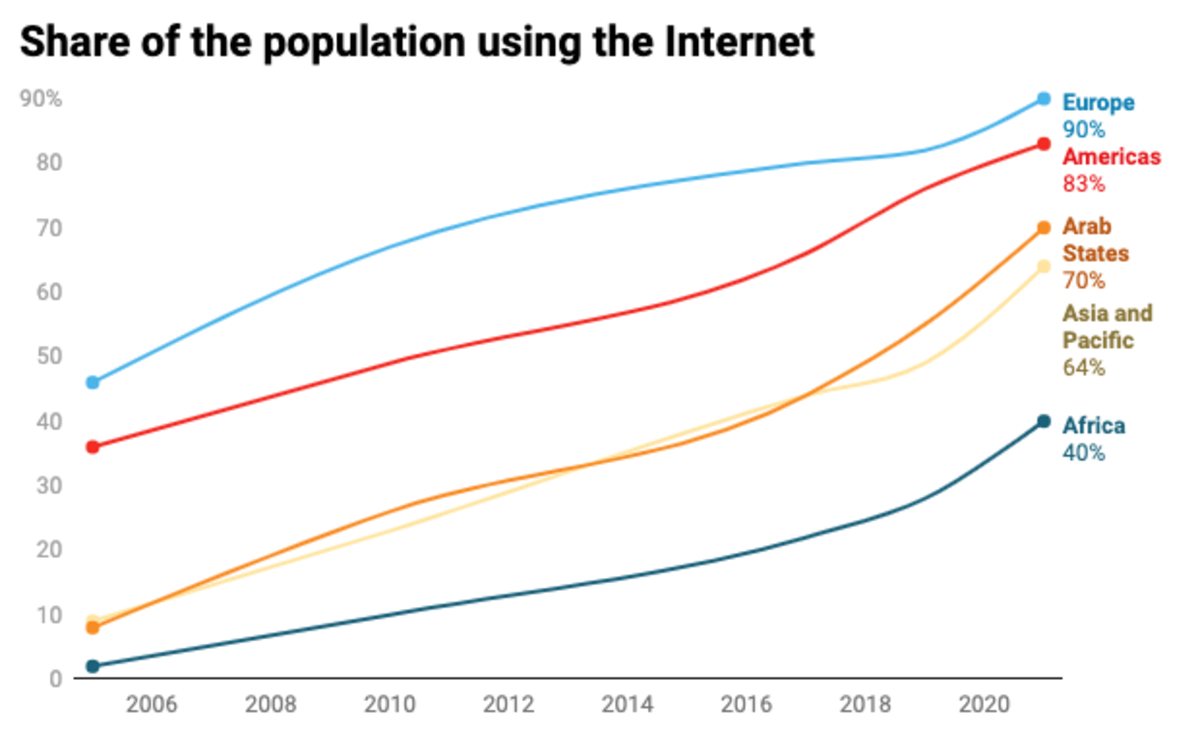
- Africa has the lowest BPI score of all continents. This may be due to the fact that the Internet penetration rate in Africa is only 40%.
- The most common query for Bitcoin is price, usually in terms of Bitcoin to USD. However, in Egypt, Bitcoin is more often priced in gold bars rather than USD or Egyptian pounds.
- The total number of Bitcoin-related queries per month is close to 77 million, with direct searches for “Bitcoin” approaching 10 million.
- The query ratio of Bitcoin to Ethereum is 9:1.
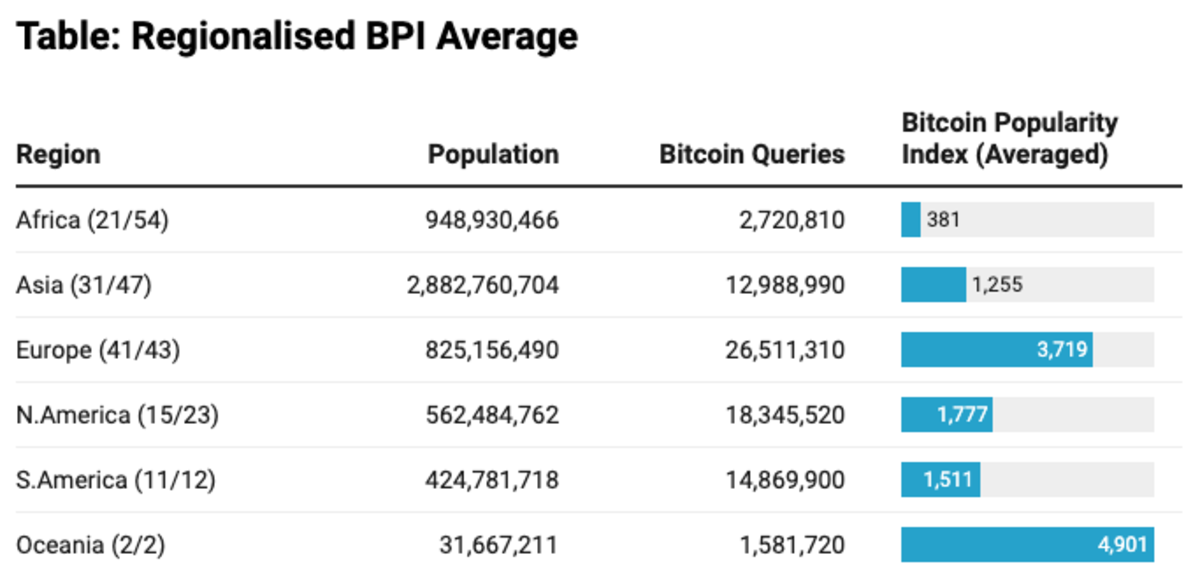
Comparison of continents
Oceania has the highest average BPI at around 4,901, indicating that Bitcoin is very popular in the region. This data comes from only two countries (New Zealand and Australia), both of which benefit from high levels of internet penetration.
Close behind is Europe, where the BPI averages 3,719 across 41 countries, with Bitcoin’s popularity across the continent far higher than in most other regions.
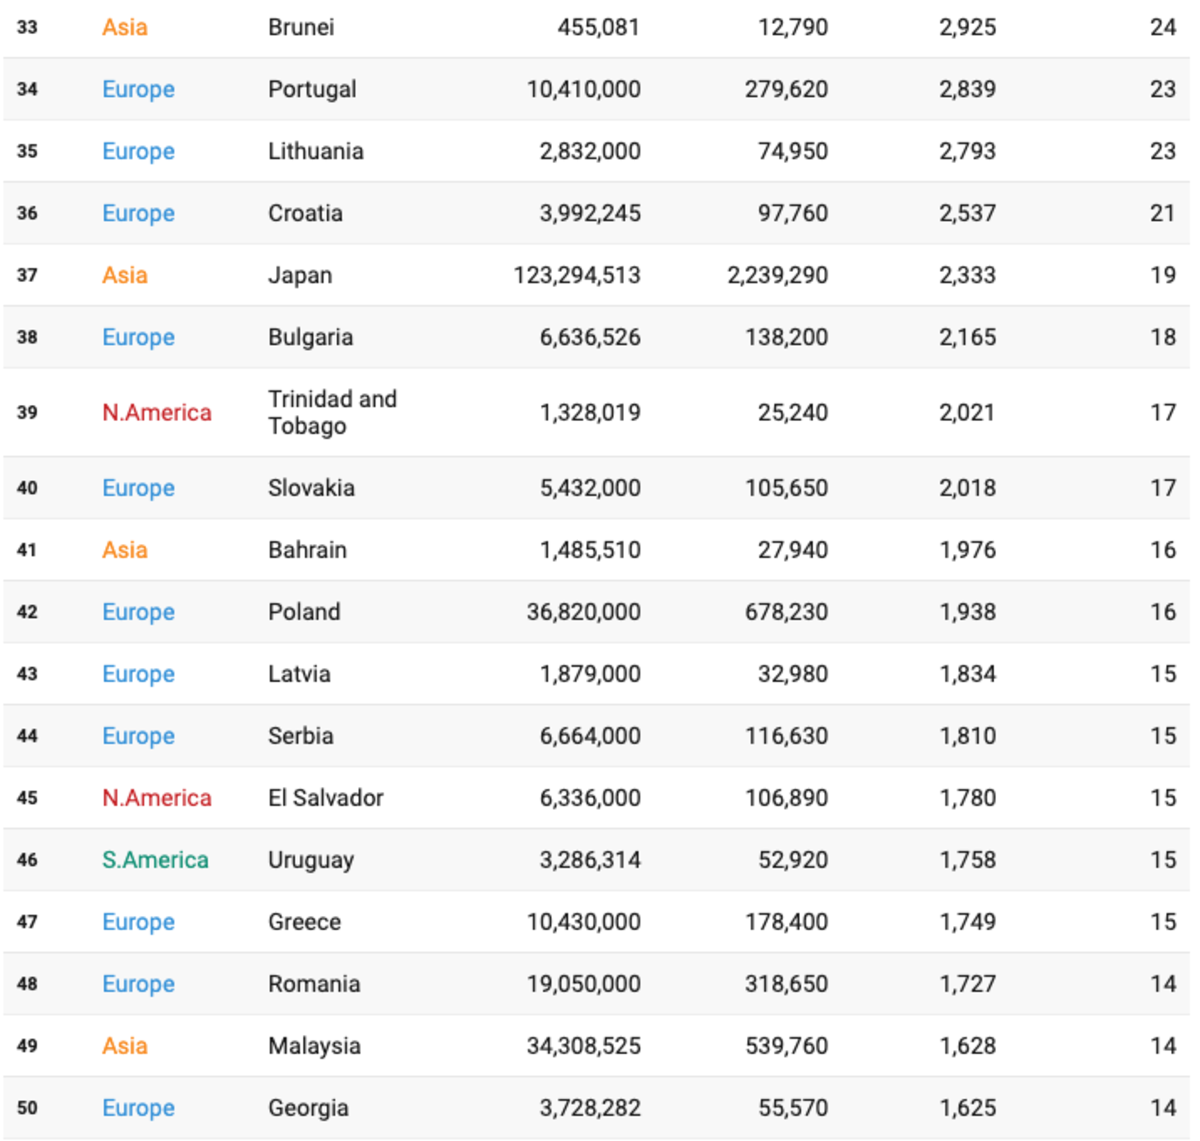
Top 50 countries
Ranking 1-15
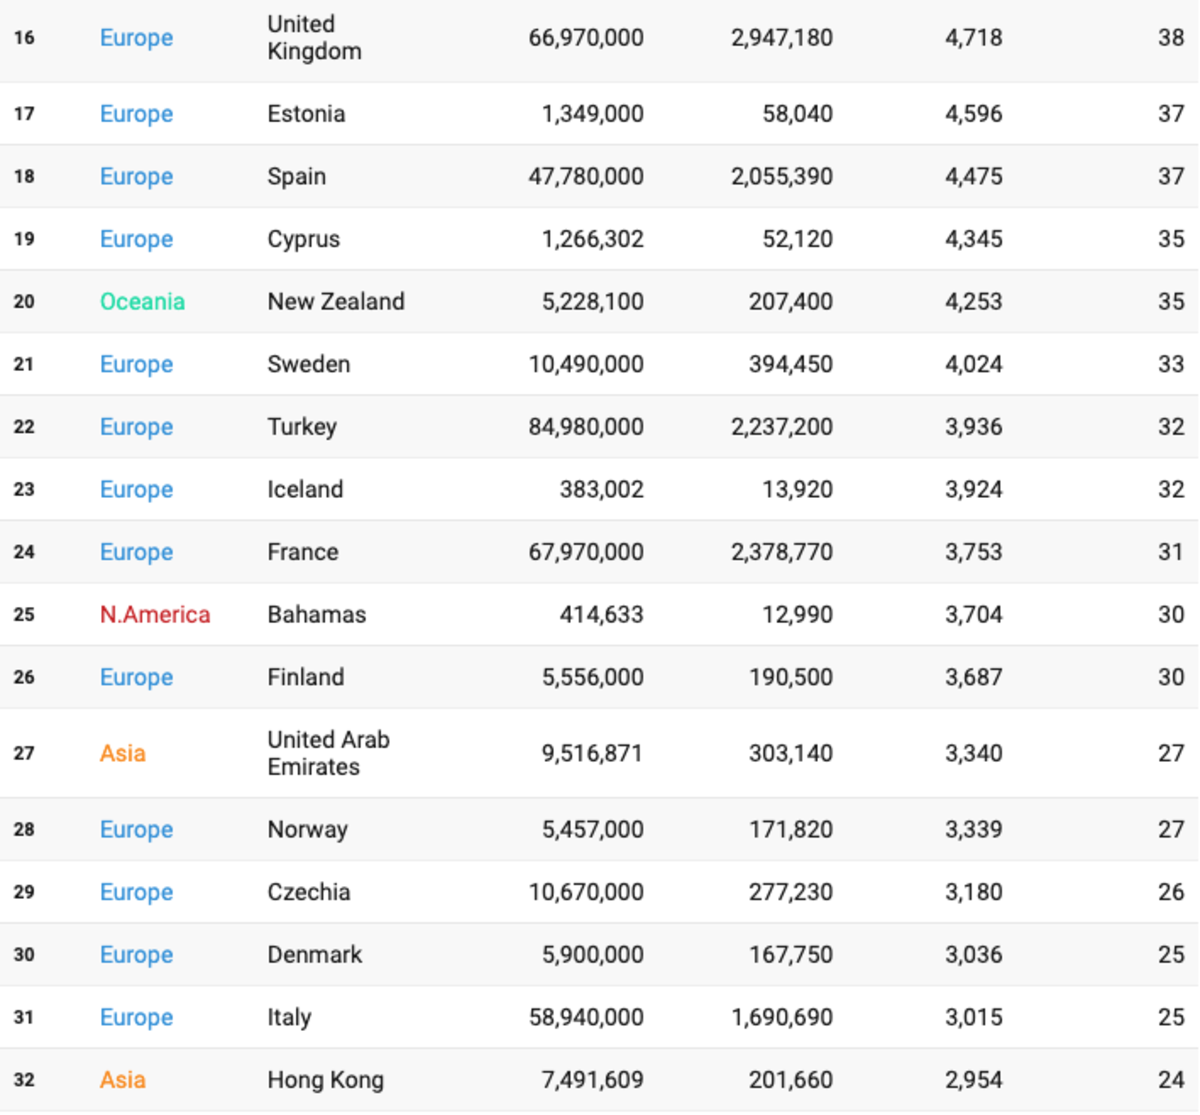
Ranking 16-32
Ranking 33-50
Data Collection Methods
- Data Selection: Given that Google maintains data on all search queries related to cryptocurrency, it was important to identify the most reliable dataset. In order to be as comprehensive as possible, I downloaded and studied datasets from SEMRUSH, Ahrefs, DataOs, Moz, and Google Trends.
- Data comparison and selection: Although the results from SEMRUSH and Ahrefs, the two largest available datasets, are largely similar, there are significant differences between the two in many terms. The data for some countries show differences of more than 80%. This variability makes it impractical to blend the data or fill in gaps for countries where SEMRUSH does not provide data, as the differences are too large to be reliably aggregated.
- Query configuration: Broad match queries for "bitcoin" and "BTC" in Latin, Arabic, Hebrew, Cyrillic, Japanese, Hindi, Perso-Arabic, Cyrillic, Tamil, Sinhala, Chinese, and Thai.
- Combination of demographic and search engine data: Population data comes from Worldometers and Google’s market share data comes from Statcounter. For this study, Google’s market share in all countries was recalculated to 100% to normalize the effect of search engine usage on the data.
- Calculate searches per capita: Using the above data, calculate the number of search queries per capita for each country. This step is critical to normalizing the data across different populations and allowing for an apples-to-apples comparison of interest in Bitcoin regardless of country size.
- Data Visualization: The final results were categorized and plotted on a Chloropleth map using the visualization tool Datawrapper.
The calculation does not take into account the percentage of a country’s population that uses the internet, as those without access to the internet are unlikely to be interested in Bitcoin. Africa’s most recently reported internet penetration rate was 40%, which is comparable to the penetration rates in Europe and the United States in 2005. While this rate is still low, it is rising, and so is Bitcoin’s popularity.
Data Scope and Limitations
The BPI index is limited by a lack of data from 77 countries, including China, Iran, Cuba, and 33 African countries (particularly Tanzania, Kenya, and Sudan). The lack of data from key regions results in an incomplete global perspective on Bitcoin participation.
Additionally, the BPI index is based on third-party estimates, as Google does not share specific search query data for Bitcoin or other cryptocurrencies. VPNs also obfuscate the source of searches to some extent, but are not expected to have much impact on the results.
Data for a few countries is incorrect, as "BTC" is the name of a telephone company in the Bahamas, an internet provider in Botswana, and a shopping mall in Slovenia.
The BPI index provides a detailed look at global interest in Bitcoin through the lens of Google search queries. While this research uses the best available data, it is important to note that the BPI is not designed to definitively answer which country has the highest adoption of Bitcoin. Instead, the BPI is a measure of general interest and engagement in Bitcoin across different countries.
The data shows that Oceania has the highest BPI score, but Europe is the strongest, with 41 of 43 countries performing well. In addition, countries with higher internet penetration have stronger search data, so the data is biased towards these countries.
Related reading: Nasdaq and gold hit record highs, BTC is about to hit a new record, is a bull market coming?
You May Also Like

Over 60% of crypto press releases linked to high-risk or scam projects: Report

ArtGis Finance Partners with MetaXR to Expand its DeFi Offerings in the Metaverse
