Ethereum (ETH) Price: Bullish Momentum Fades as Middle East Tensions Push ETH Toward $2,100
TLDR
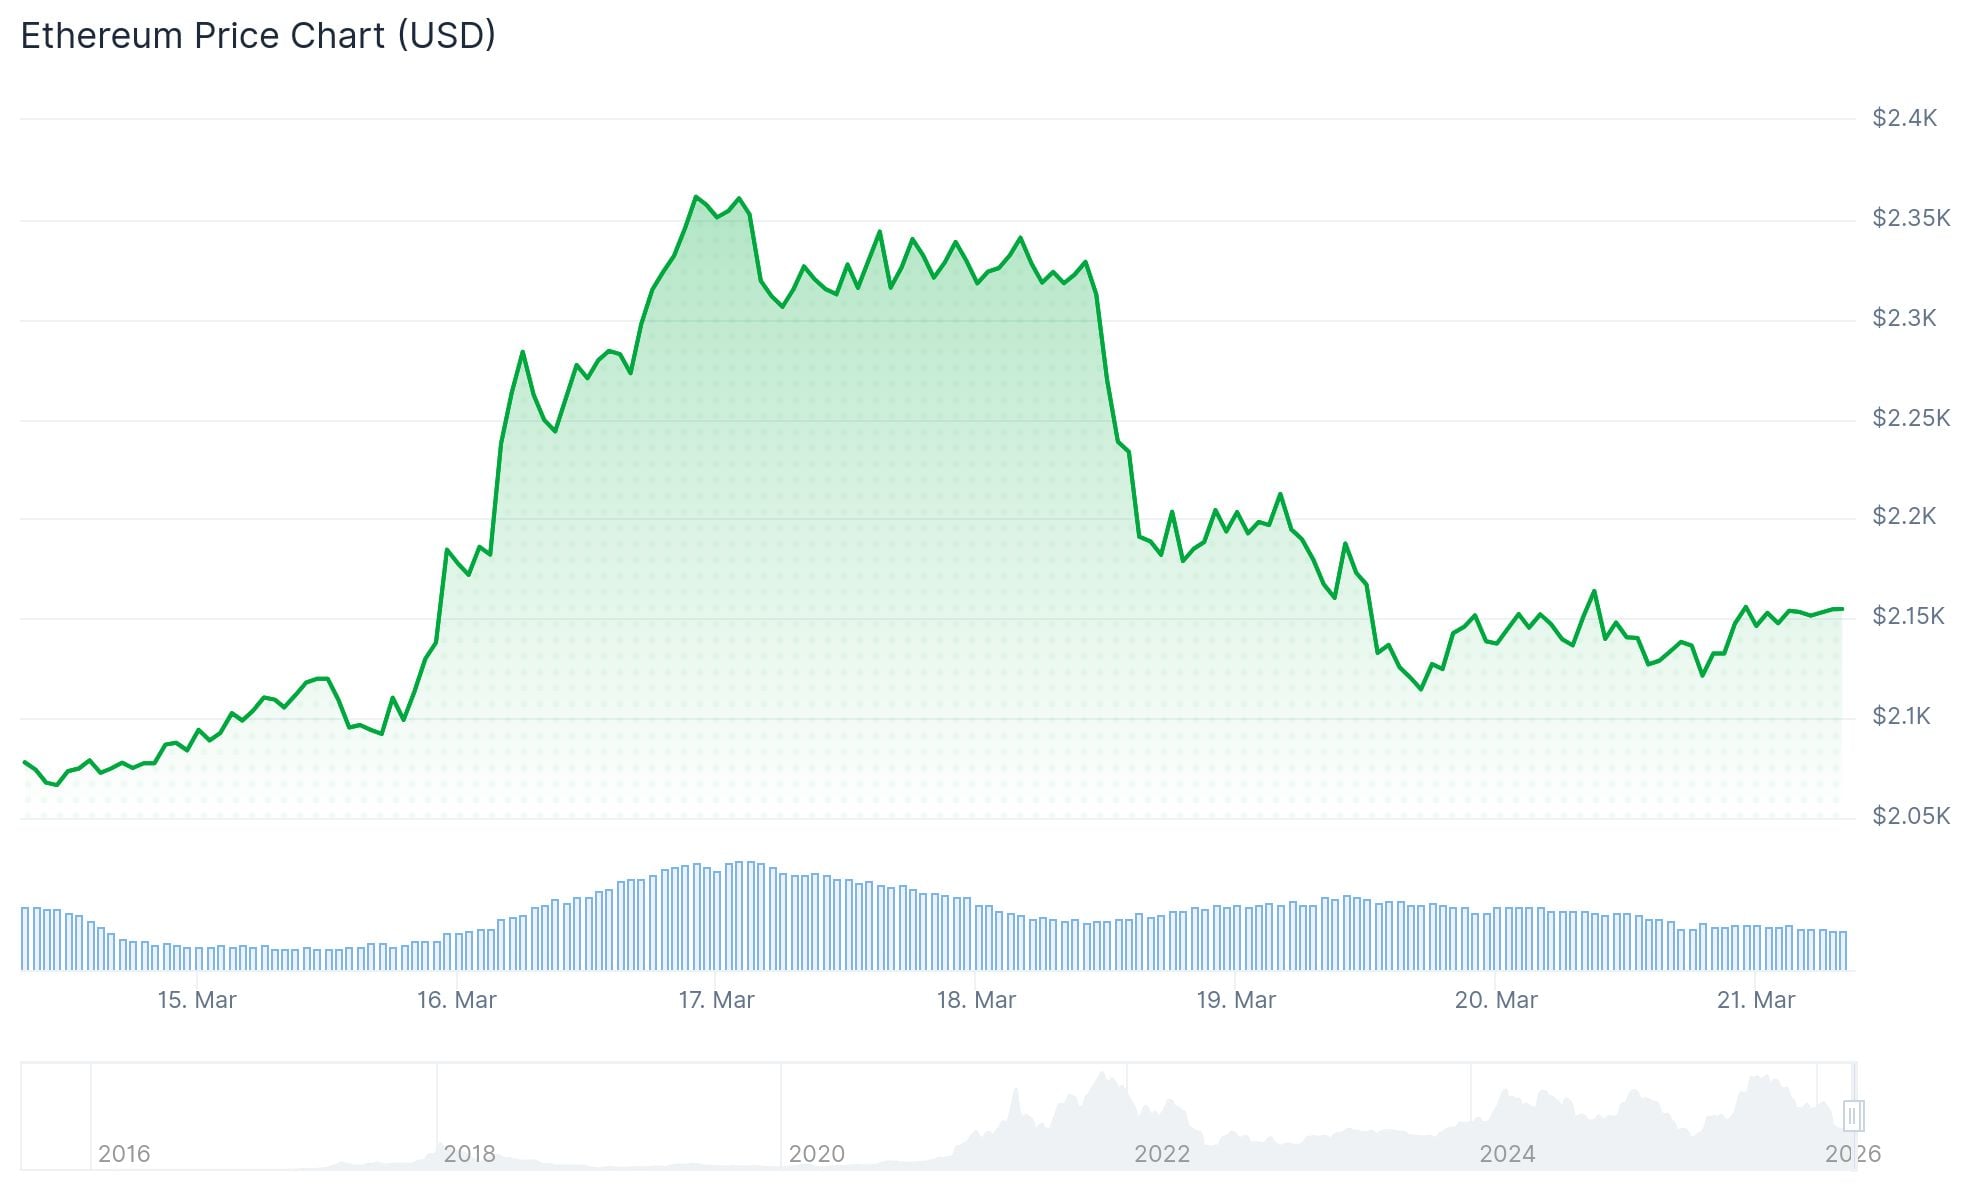
- ETH pulled back to ~$2,130 after hitting $2,390 earlier in the week
- BitMine Immersion bought 60,999 ETH, bringing its holdings to 4.59 million ETH
- Whales are closing longs and opening shorts while retail traders do the opposite
- US spot ETH ETFs flipped to net outflows, shedding $192.1 million over two days
- A CME gap at $2,117 has been filled, with a buy wall forming around $2,100
Ethereum started the week with strong bullish momentum, climbing to $2,390, its highest price since early February. Institutional buying, whale accumulation, and a surge in derivatives activity all drove the move higher.
 Ethereum (ETH) Price
On Monday, Ethereum treasury firm BitMine Immersion (BMNR) disclosed it had purchased 60,999 ETH, lifting its total holdings to 4.59 million ETH. Open interest in ETH derivatives also hit its highest level since last September.
But the rally ran out of steam. Middle East tensions pushed oil prices up and reduced expectations for rate cuts in 2026, weighing on risk assets including crypto.
ETH was rejected near its realized price, or on-chain cost basis, of around $2,310. That level has historically triggered selling when an uptrend is weak, as investors break even and step aside.
ETF Outflows Add to Selling Pressure
US spot Ethereum ETFs flipped to net outflows after six straight days of inflows. Investors pulled approximately $192.1 million over just two days, adding to the downward pressure on price.
 Source; SoSoValue
ETH saw $39 million in liquidations in 24 hours, with $21.2 million coming from long positions, according to Coinglass data.
On-chain analyst Boris flagged a potential liquidity trap forming. As ETH climbed toward $2,400, the Whale vs Retail Delta moved deeper into negative territory. Whales were closing long positions and opening shorts, while retail traders were doing the opposite — aggressively buying.
Boris noted that buying pressure was strong for a period but was absorbed by sell-side liquidity. The market has since entered a cooling phase. Liquidation data shows a long buildup with key targets at $1,850 and below.
CME Gap Filled at $2,117
Market analyst CW confirmed that ETH has filled its CME gap at $2,117. A buy wall has formed around the $2,100 level, which also aligns with the 0.382 Fibonacci level. If a bounce occurs here, the next target is $2,686.
Ethereum is currently testing the $2,110 support zone, where the 20-day EMA also sits. A break below this level could expose $1,740 and then $1,524. To the upside, ETH needs a daily close above $2,390 to reopen a sustained recovery.
The RSI hovers near 50, showing balanced but cooling momentum.
Crypto trader Ted weighed in on X: “$ETH bounced back from its $2,100 support zone. The move is looking a bit weak, as spot buyers aren’t here. This means Ethereum could drop below the $2,100 level again given rising macro uncertainty and low institutional demand.”
The most recent data shows ETH holding just above $2,100 with ETF outflows continuing and macro pressure from the Middle East still in play.
The post Ethereum (ETH) Price: Bullish Momentum Fades as Middle East Tensions Push ETH Toward $2,100 appeared first on CoinCentral.
You May Also Like

Spot Bitcoin ETFs Face Outflows Despite Strong March Inflows

Strategy CEO: If Morgan Stanley allocates 2% to Bitcoin, it will bring in approximately $160 billion in funds.