Bitcoin Price Prediction: Is $80,000 Next for BTC? Analyst Weighs In
Key highlights:
- Bitcoin surged to $75,300, triggering a short squeeze that wiped out $80M in bearish positions.
- Liquidity heatmap reveals major long clusters at $70K, $65K, and $57K, potential downside targets.
- Analysts warn of a possible flush before continuation, as crowded long positioning builds risk.
Bitcoin made a run toward $75,300, wiping out $80 million in shorts along the way. Mission accomplished, as Ali Martinez put it. Now that those shorts are cleared, the market is beginning to lean long as traders chase the rally.
But here is the thing: the liquidity heatmap shows something different. The biggest clusters of long positions now sit below us at $70,000, $65,000, and $57,000. Those levels could act as liquidity magnets, flushing out late leverage and resetting the market before the next relief rally.
What the BTC liquidity heatmap shows
We had a look at the liquidity heatmap from Ali, and the picture is clear. The heatmap shows where leveraged positions are clustered. Brighter colors mean more liquidity. The run to $75,300 did exactly what it was supposed to do. It cleared the overhead resistance. Now the market has shifted. Traders are chasing the rally, and long positions are building up below.
The heatmap shows three major clusters of long liquidity. The first is at $70,000. The second is at $65,000. The third is at $57,000. These are not random levels. They are zones where a lot of leveraged long positions are.
In crypto, liquidity acts like a magnet. Price tends to move toward large clusters of positions, either to take them out or to run past them. Right now, the biggest clusters are below the current BTC price. That means the path of least resistance could be down before the next leg up.
What happened this week
The BTC price charged toward $75,300 and wiped out $80 million in shorts. That was a classic short squeeze. Sellers got caught, were forced to buy back, and that added fuel to the rally. But once the shorts were cleared, the dynamic changed. Now traders are leaning long, chasing the move. That is when markets tend to reverse. Not always, but often. The liquidity below becomes the target.
Ali notes that the overhead resistance has been cleaned up. That is good for the bulls. But the long positions sitting below are a problem. If the BTC price starts to drop, those longs will get liquidated, which adds more selling pressure. That is how a small pullback turns into a cascade.
Where the BTC price goes from here
The BTC price is trading near $75,300 after the squeeze. The immediate support below is at $70,000, then $65,000, then $57,000. Those are the liquidity zones. The upside resistance is not clearly marked on the heatmap, but the next major level above is $80,000, then $85,000, then $90,000.
The market is leaning long. That is usually a contrarian signal. The smart play is not to chase the rally. It is to wait for a flush. Now the longs are exposed. The BTC price is the only thing left to decide which side gets wrecked next.
CoinCodex's 1-month BTC price prediction places the price at $77,982, which sits above the current $75,300 level. That forecast expects a rally toward $80,000. But the liquidity heatmap says the market might need to flush out long positions at $70,000 and $65,000 before that happens.
Kraken: Best crypto exchange for security & reliability
- Buy, sell, and trade 400+ cryptocurrencies with industry-leading security
- Spot, Futures & Margin trading – leverage up to 5x for advanced traders
- Earn rewards with staking on top cryptocurrencies
- 24/7 customer support and high liquidity for fast trades
- Regulated in the US with strong compliance and security measures
- 13+ million users worldwide
Get Started on Kraken
Disclaimer: This content is for informational purposes only and does not constitute financial, investment, or other advice. Nothing on this page is a recommendation or solicitation. Always seek independent professional advice before making investment decisions. Some links may earn us a commission at no extra cost to you.


Ayrıca Şunları da Beğenebilirsiniz
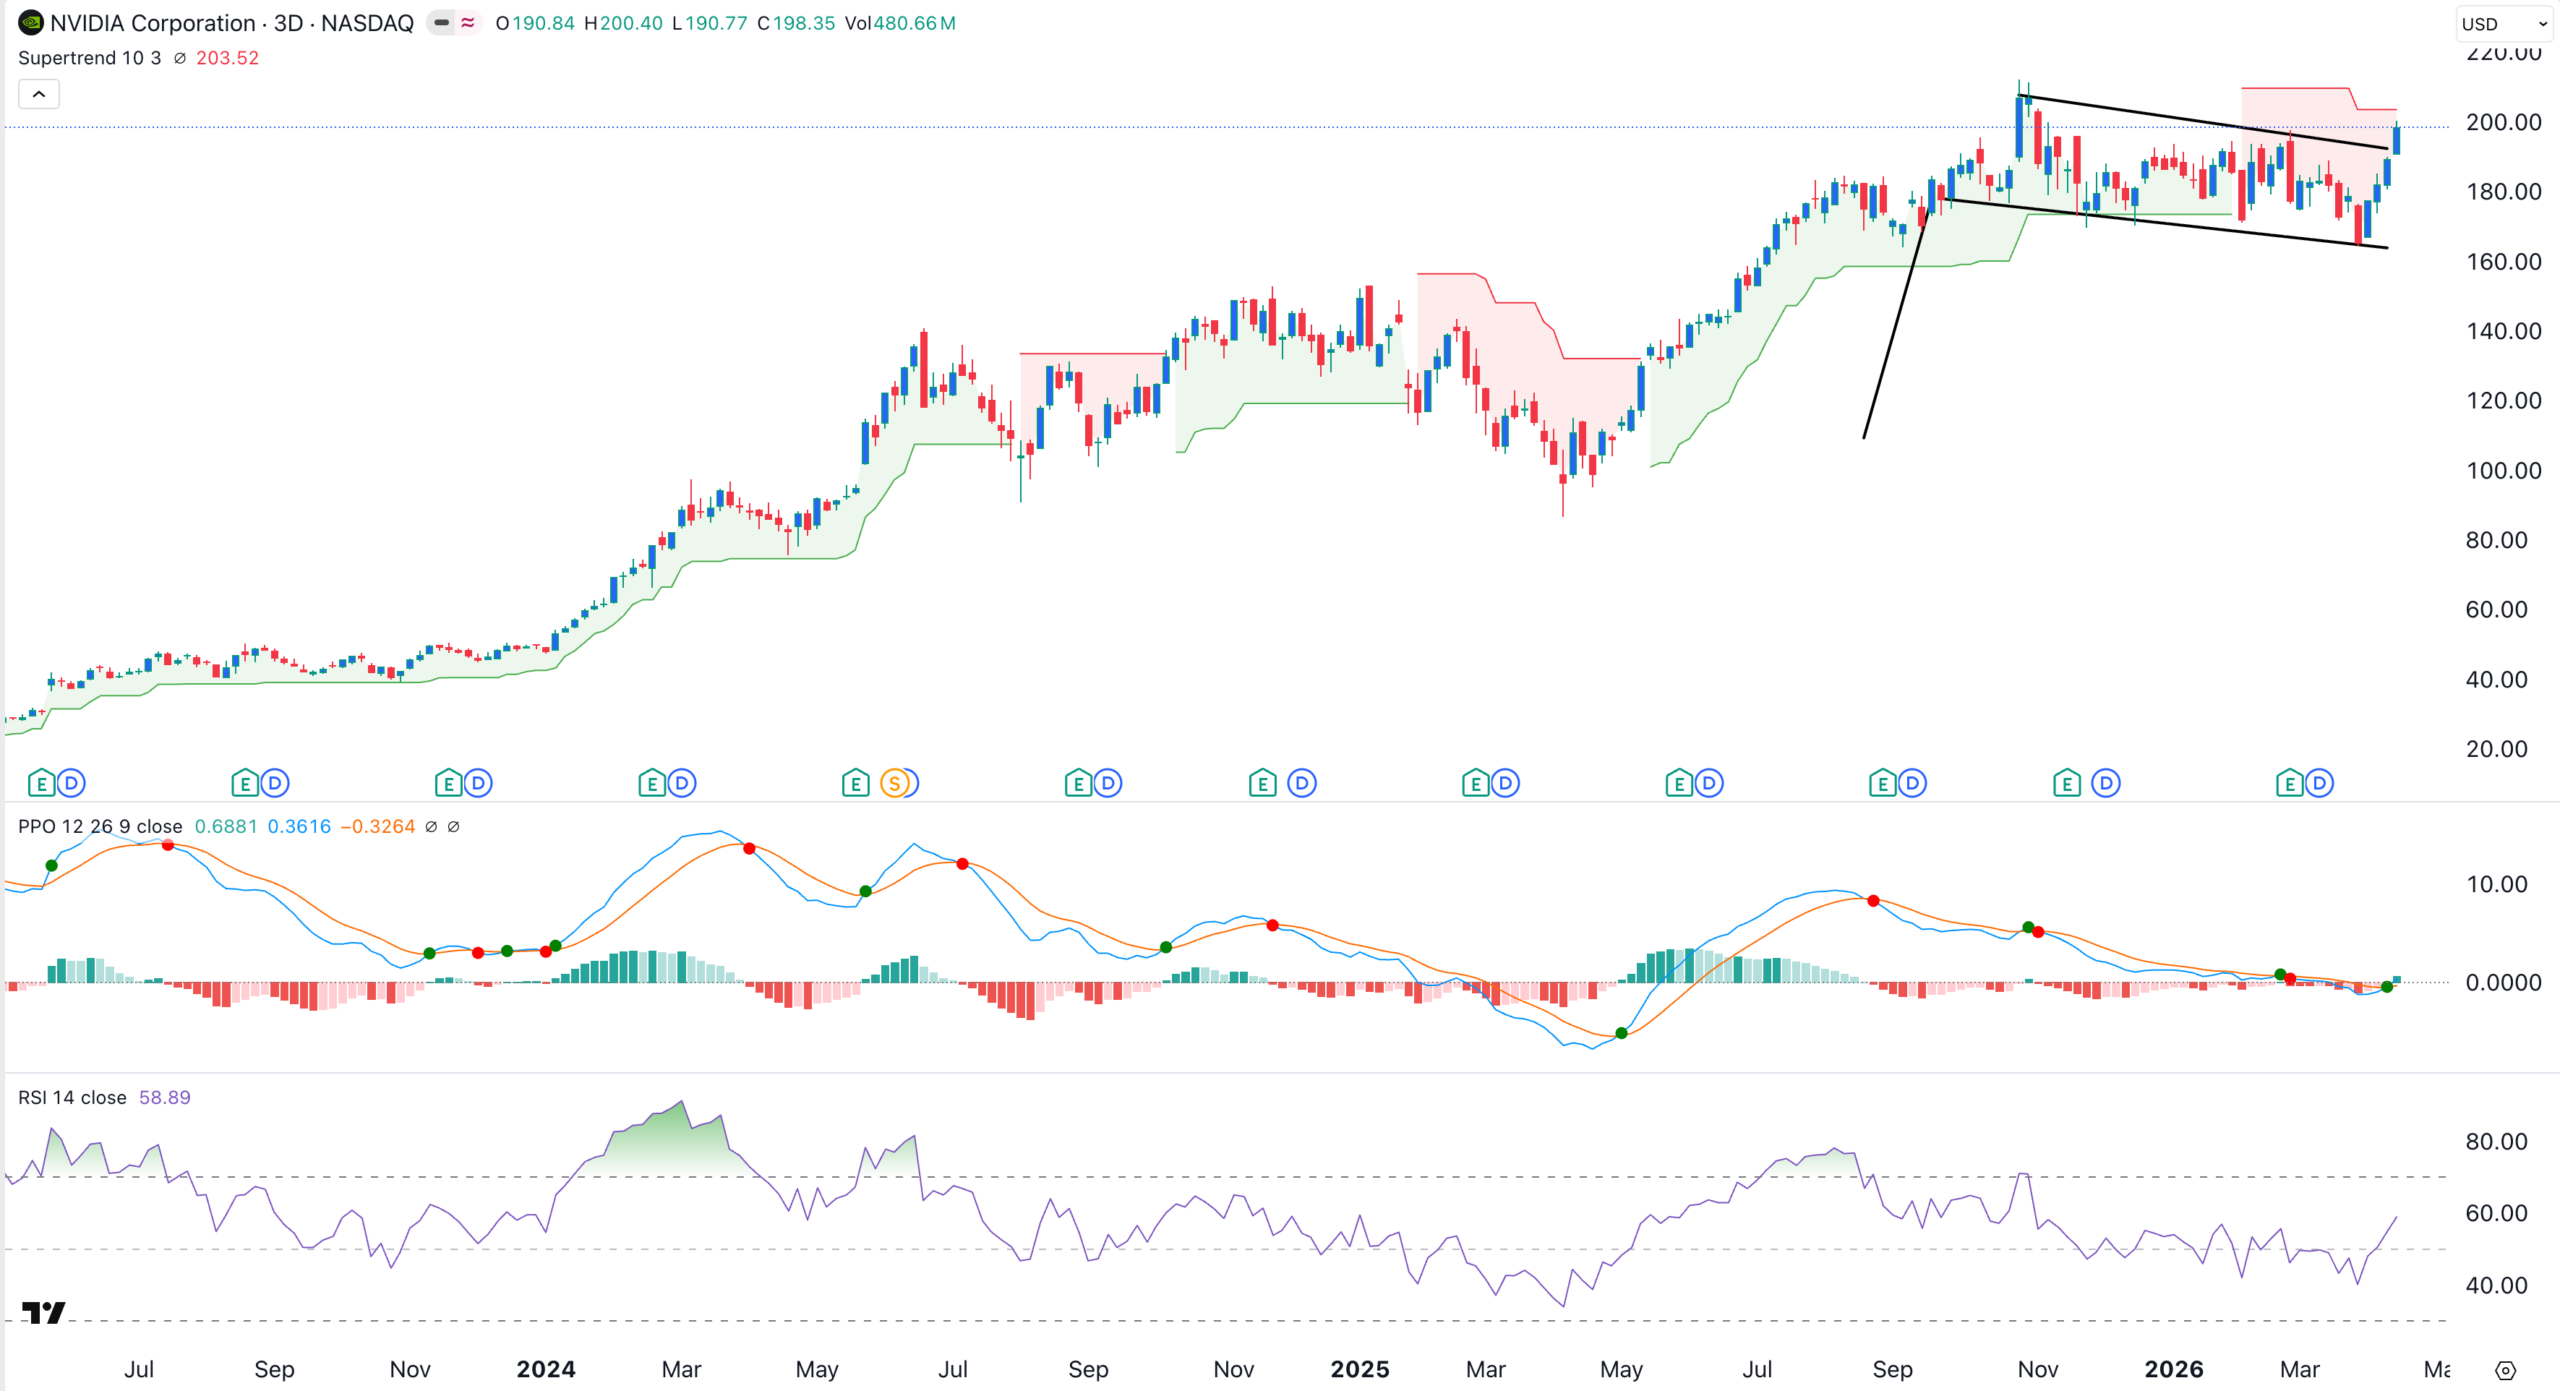
NVIDIA Stock is Finally Breaking Out: Can it Hit $250 as Catalysts Build?

68% of global BTC miners came from the U.S., Russia, and China, Q1 2026