

Polkadot ($DOT) Just Got Classified as a Commodity… Here’s Why $50 Could Happen Next
Polkadot has been silently stacking up major developments, even though the price isn’t showing it yet. A new tokenomics update just capped total supply at 2.1 billion DOT, while cutting emissions by more than half.
That shift leans hard into scarcity, which is usually the kind of thing that matters more over time than in the moment.
However, the first U.S. spot DOT ETF has started trading on Nasdaq, opening the door for institutional money to step in more easily. But despite all of that, the DOT price hasn’t responded the way many would expect.
DOT lost a key support zone and slipped toward the $1.25 area as the broader altcoin market stayed weak.
Polkadot “Still Down 98%”… But That’s the Point
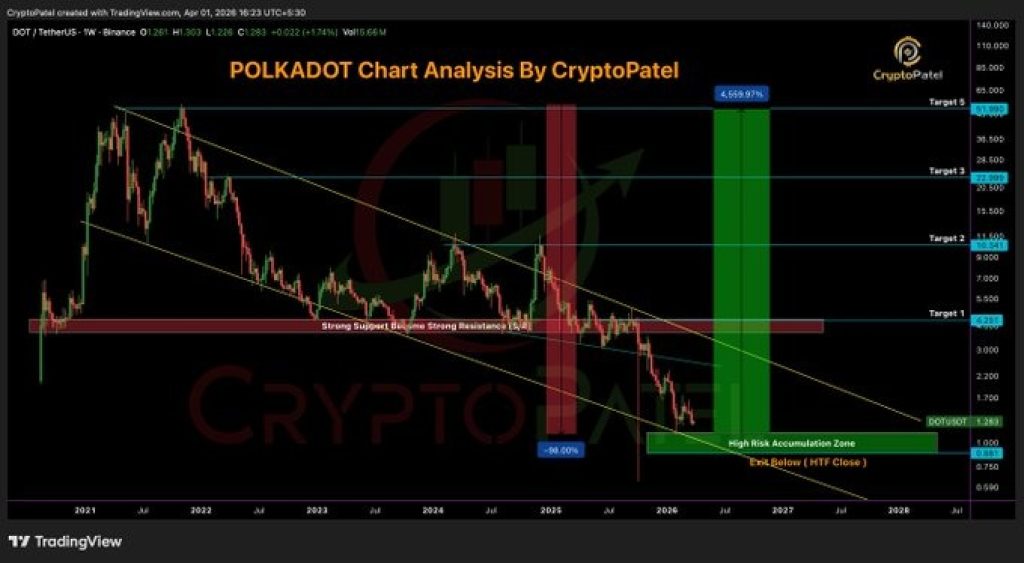
One take that’s been making rounds comes from Crypto Patel, who pointed out that the DOT price is still sitting roughly 98% below its all-time high. On the surface, that sounds like a problem. But the argument being made is the opposite.
The comparison goes back to Ethereum in its early days, when people dismissed smart contracts as unnecessary. At the time, it didn’t look obvious. Now it’s the foundation for a huge part of the crypto space.
The idea here is simple. When something with strong fundamentals gets ignored for long enough, it can create a window where the upside starts to outweigh the downside.
What the Polkadot Chart Is Saying Right Now
We took a look at the chart and the DOT price has been in a steady downtrend for a long time. It’s been printing lower highs and lower lows, and there’s no real way to dress that up. The trend has been clearly bearish.
But right now, price is sitting in a zone that’s often associated with early accumulation. Around the $1.00 region, the chart marks a high-risk accumulation area, where long-term buyers sometimes begin stepping in quietly.
There’s also a descending trendline that has been pushing price down since the last cycle peak. The DOT price is now moving closer to the lower edge of this structure, and this sometimes indicates that selling pressure may be running out of steam.
This does not mean a reversal is yet complete, but it indicates that this downtrend may be close to its conclusion.
 Source: X/CryptoPatel
How the Path to $50 Starts to Form
For the DOT price to even begin moving toward higher levels, it first needs to reclaim lost ground. The early signs would come from pushing back above previous support zones that have now turned into resistance. If momentum builds from there, the structure starts to open up.
The chart itself shows a potential long-term projection that stretches toward the $50 region. That kind of move wouldn’t happen overnight. It would take a full shift in trend, stronger market conditions, and sustained buying pressure.
Still, once a downtrend like this breaks, moves can accelerate quickly, especially when price has been suppressed for so long.
Read Also: How Much Could $1,035 in Hedera (HBAR) Be Worth in 10 Years (2036)?
Why the Fundamentals Are Starting to Matter More For Polkadot
Beyond the chart, the fundamentals are beginning to line up in a way they haven’t in a while. The supply cap introduces a new dynamic that could tighten availability over time, while reduced emissions slow down the rate of new tokens entering the market.
The ETF adds another layer, making it easier for larger players to gain exposure without directly buying and holding the asset themselves.
Then there’s the regulatory angle. Being viewed more clearly as a commodity gives DOT a more defined position, which tends to reduce uncertainty for bigger investors.
All of these factors don’t move price instantly, but they build a foundation that can support a larger move later on.
For now, the DOT price still looks weak if you only focus on it. The trend hasn’t flipped yet, and the market hasn’t fully turned around.
But under the surface, things are shifting. The structure is getting close to a point where the downside momentum could fade, while the fundamentals are quietly improving.
It’s not a guaranteed move, and it’s definitely not without risk. But if the market environment changes, this is the kind of setup that can go from quiet to explosive faster than most people expect.
Subscribe to our YouTube channel for daily crypto updates, market insights, and expert analysis.
The post Polkadot ($DOT) Just Got Classified as a Commodity… Here’s Why $50 Could Happen Next appeared first on CaptainAltcoin.


Ayrıca Şunları da Beğenebilirsiniz

Potential U.S. Recession Could Buy Japan More Time as It Faces Debt Implosion, Says Brookings Economist Robin Brooks

US Spot Bitcoin ETFs Draw $1.3B in March, Marking First Monthly Inflow of 2026 – Crypto News Flash


